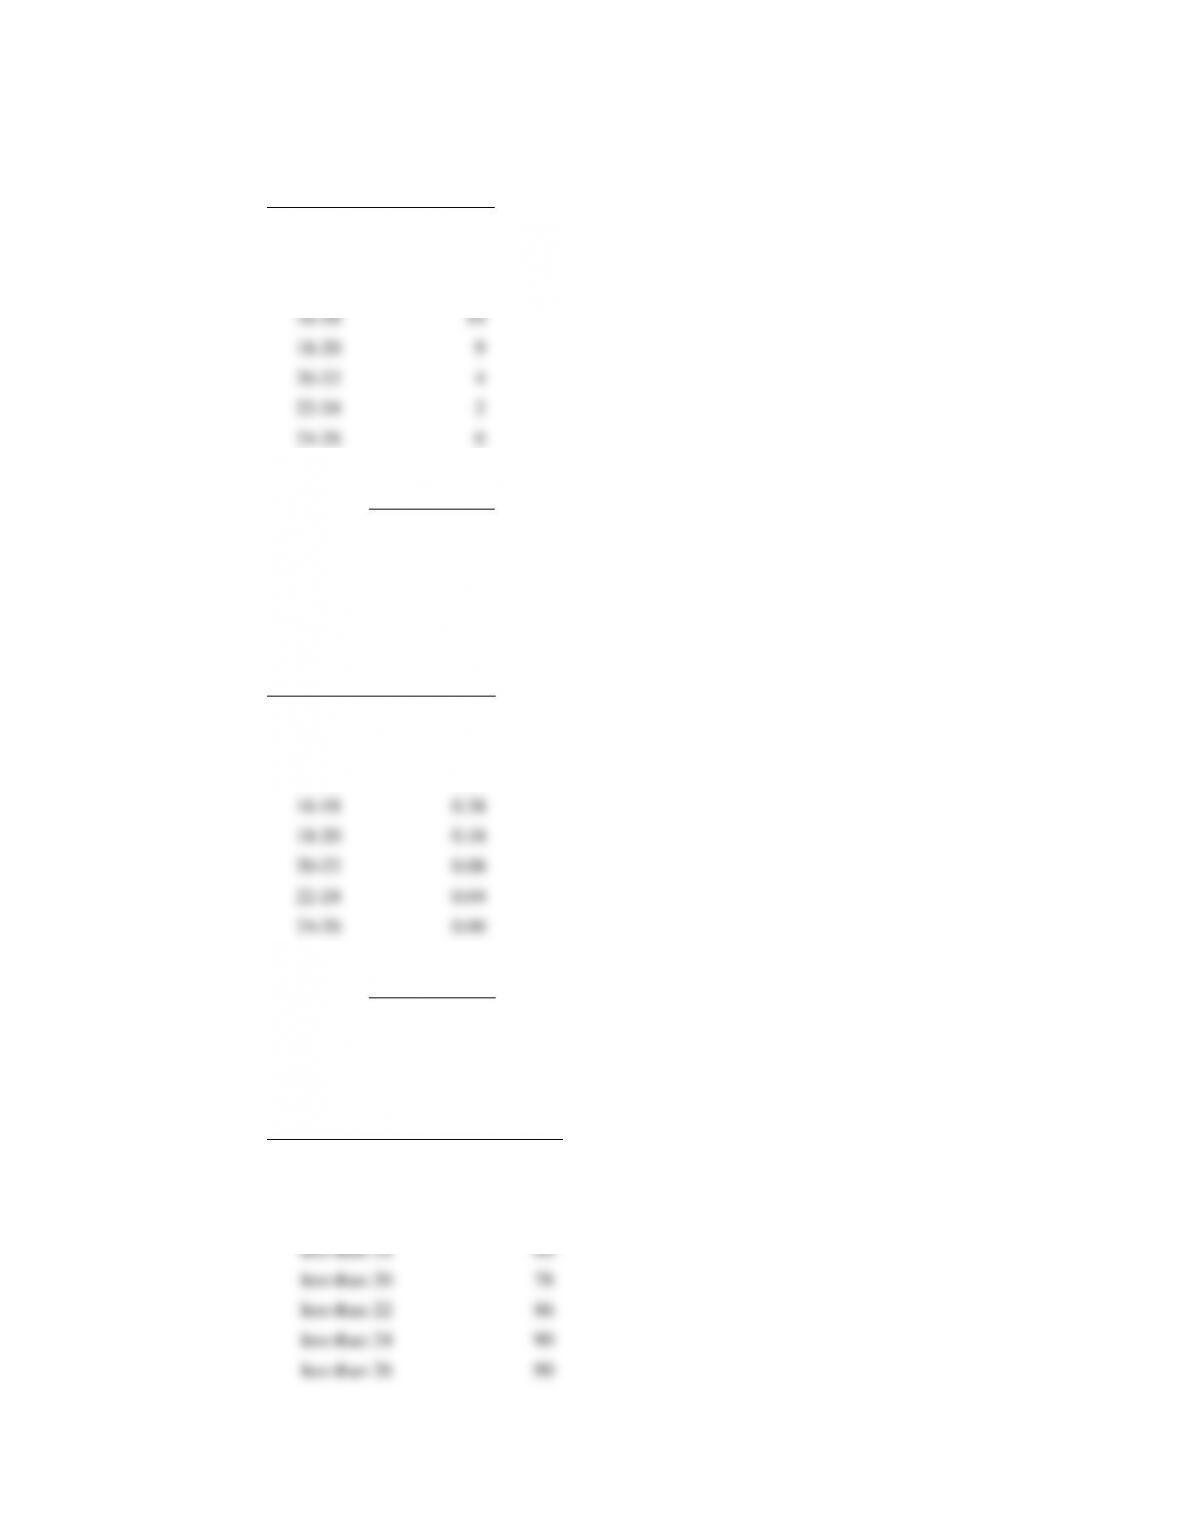
18. a.
PPG
Frequency
10–12
1
12–14
3
14–16
7
16–18
19
18–20
9
20–22
4
22–24
2
24–26
0
26–28
3
28–30
2
Total
50
b.
PPG
Relative
Frequency
10–12
0.02
12–14
0.06
14–16
0.14
16–18
0.38
18–20
0.18
20–22
0.08
22–24
0.04
24–26
0.00
26–28
0.06
28–30
0.04
Total
1.00
c.
PPG
Cumulative
Percent
Frequency
less than 12
2
less than 14
8
less than 16
22
less than 18
60
less than 20
78
less than 22
86
less than 24
90
less than 26
90
less than 28
96
less than 30
100
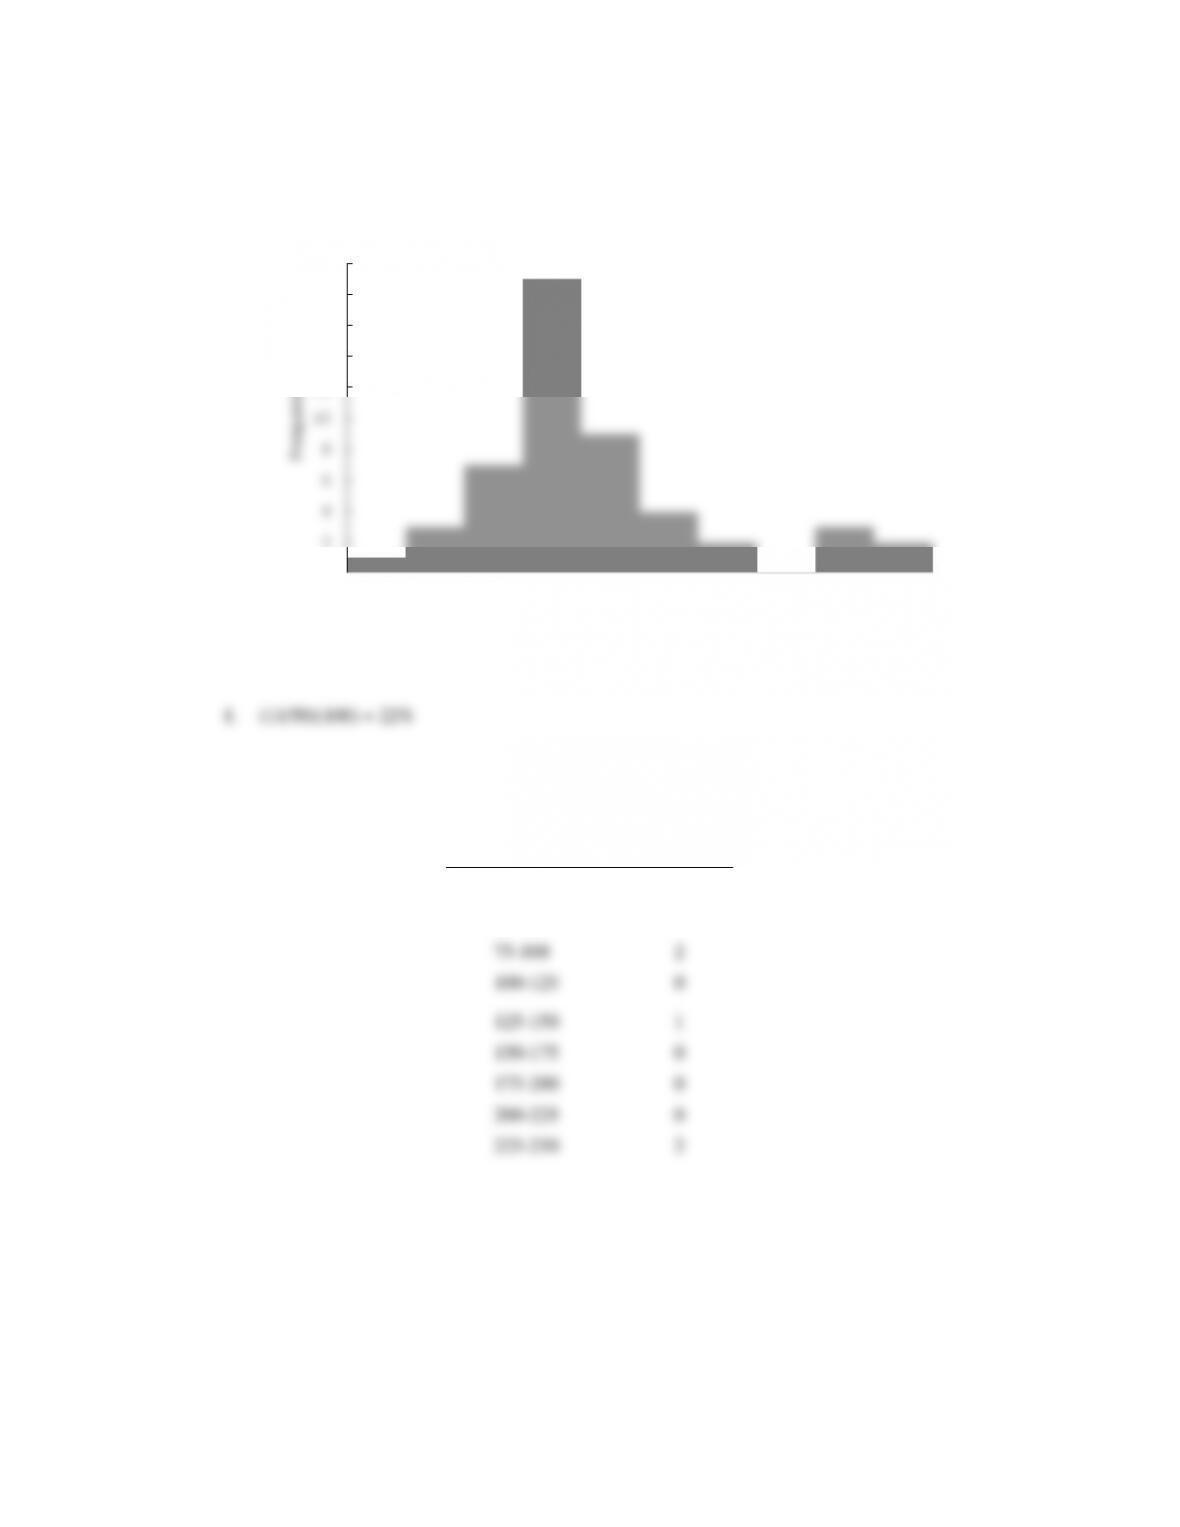
d.
e. There is skewness to the right.
19. a. The largest number of tons is 236.3 million (South Louisiana). The smallest number of tons is 30.2
million (Port Arthur).
b.
Millions Of Tons
Frequency
25–50
11
50–75
9
75-100
2
100–125
0
125–150
1
150–175
0
175–200
0
200–225
0
225–250
2
0
2
4
6
8
10
12
14
16
18
20
10-12 12-14 14-16 16-18 18-20 20-22 22-24 24-26 26-28 28-30
Frequency
PPG
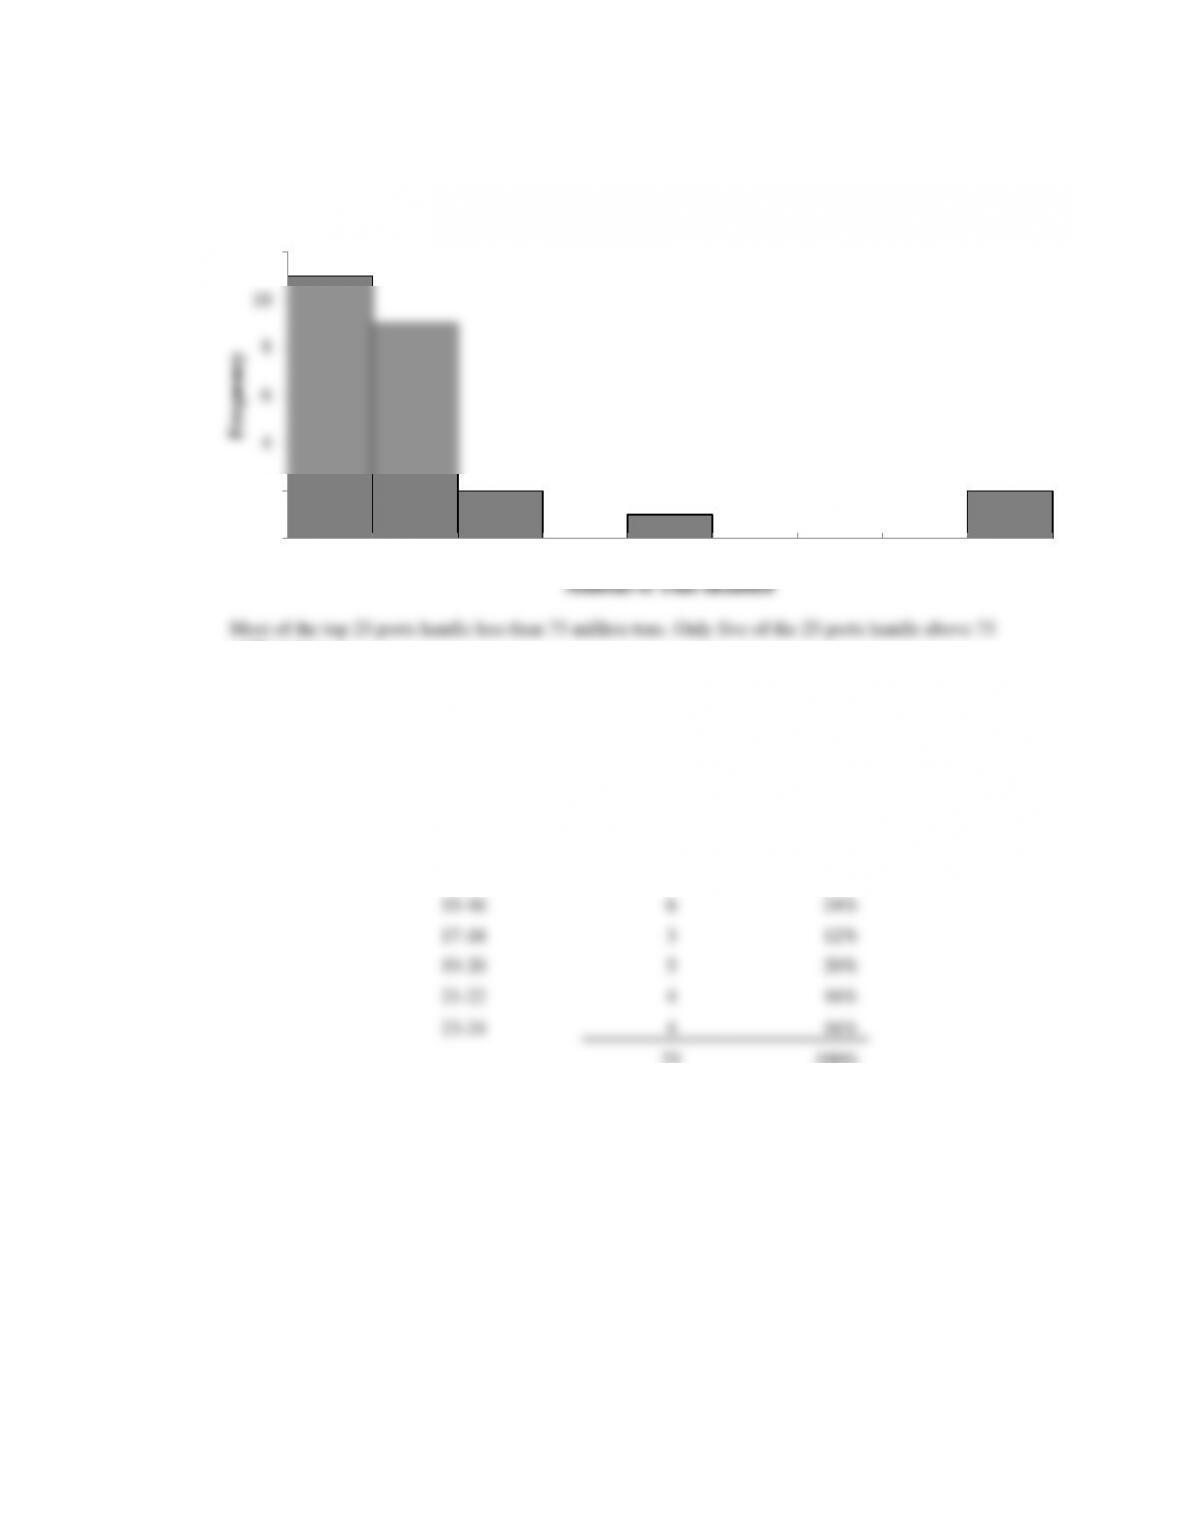
c.
million tons.
20. a. Lowest = 12, Highest = 23
b.
Percent
Hours in Meetings per
Week
Frequency
Frequency
11–12
1
4%
13–14
2
8%
15–16
6
24%
17–18
3
12%
19–20
5
20%
21–22
4
16%
23–24
4
16%
25
100%
c.
0
2
4
6
8
10
12
25-49.9 50-74.9 75-99.9 100-124.9 125-149.9 150-174.9 175-199.9 200-224.9 225-249.9
Frequency
Millions of Tons Handled
Histogram for 25 Busiest U.S Ports
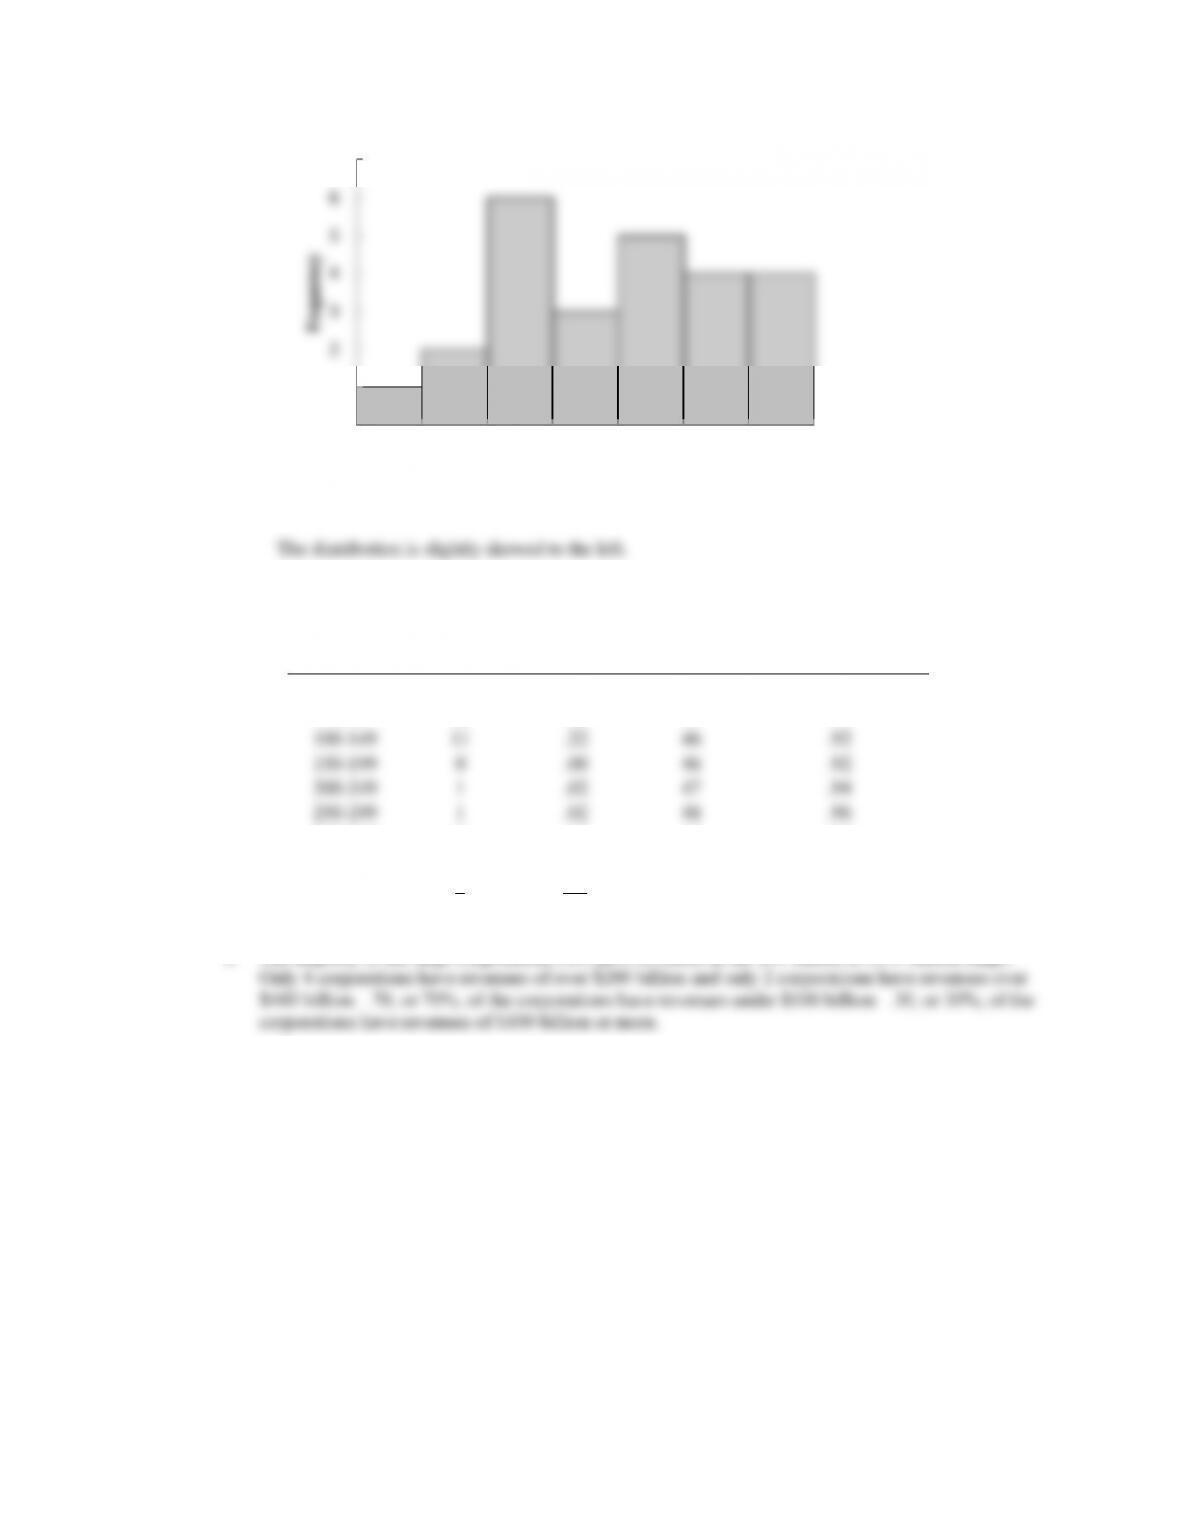
21. a/b/c/d.
Relative
Cumulative
Cumulative Relative
Revenue
Frequency
Frequency
Frequency
Frequency
0-49
6
.12
6
.12
50–99
29
.58
35
.70
100–149
11
.22
46
.92
150–199
0
.00
46
.92
200–249
1
.02
47
.94
250–299
1
.02
48
.96
300–349
0
.00
48
.96
350–399
0
.00
48
.96
400–449
2
.04
50
1.00
Total
50
1.00
e. The majority of the large corporations (40) have revenues in the $50 billion to $149 billion range.
f.
0
1
2
3
4
5
6
7
11-12 13-14 15-16 17-18 19-20 21-22 23-24
Fequency
Hours per Week in Meetings
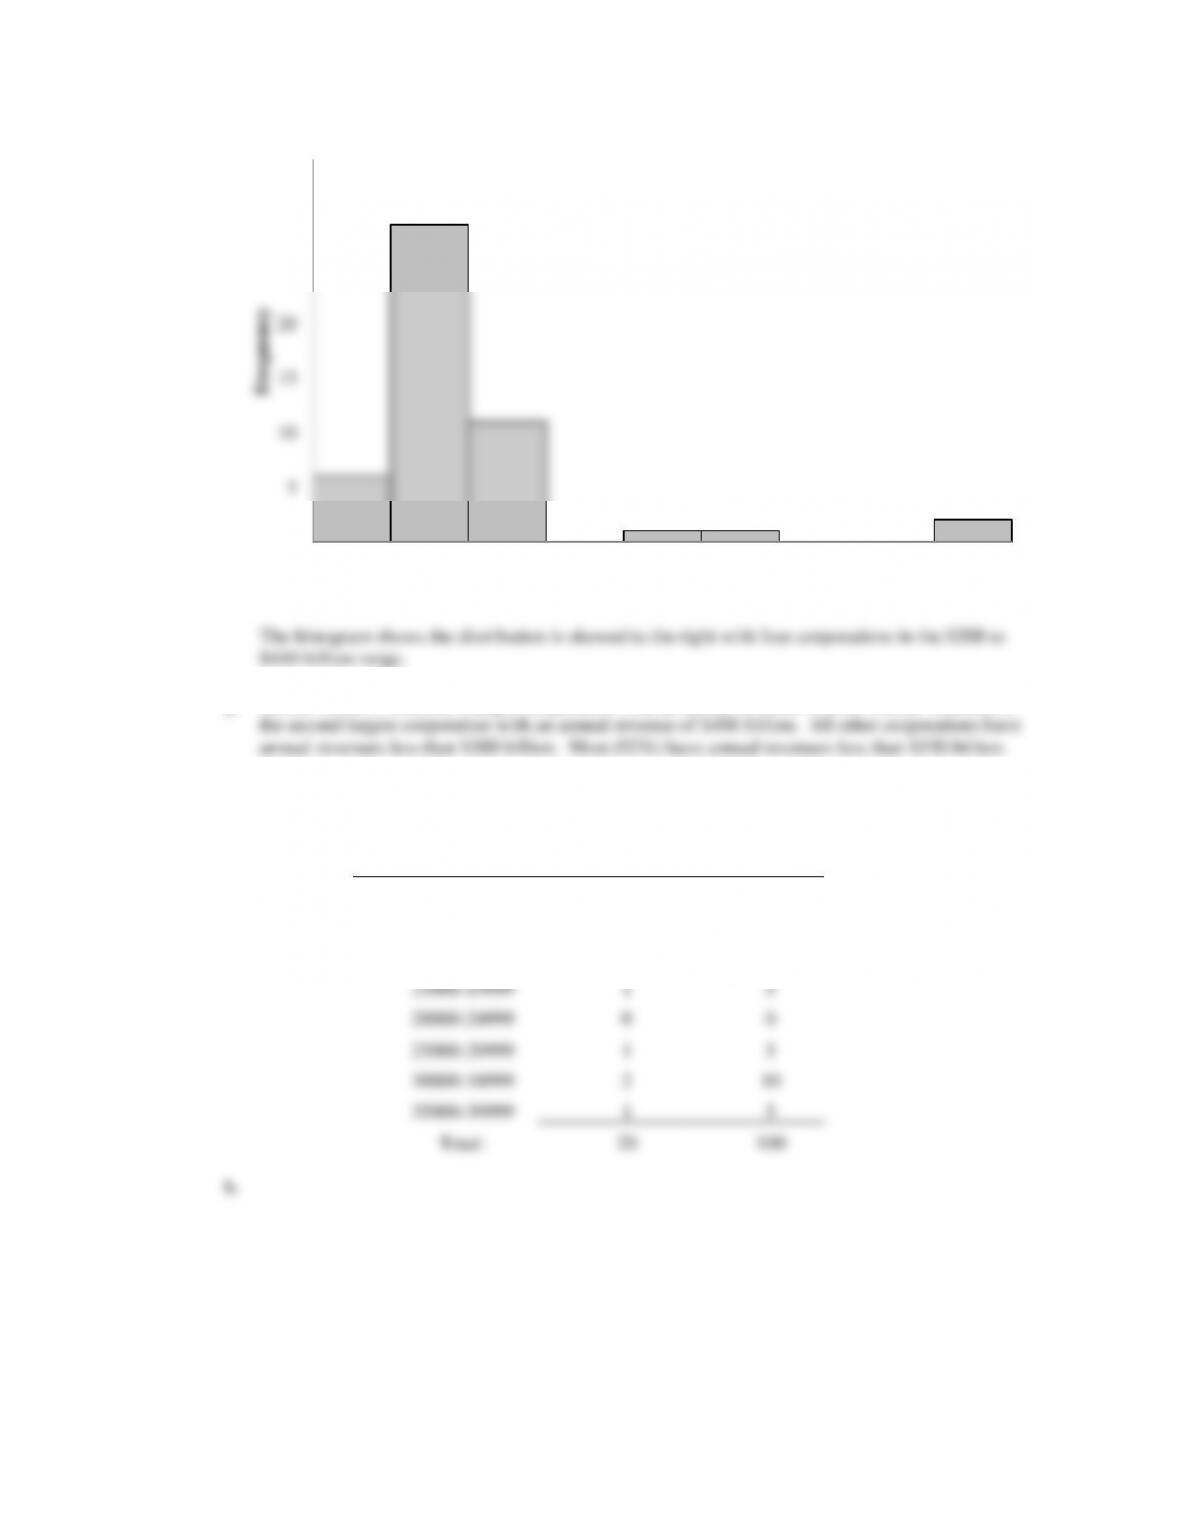
g. Exxon-Mobil is America’s largest corporation with an annual revenue of $443 billion. Walmart is
22. a.
0
5
10
15
20
25
30
35
0-49 50-99 100-149 150-199 200-249 250-299 300-349 350-399 400-449
Frequency
Revenue (Billion $)
# U.S.
Locations
Frequency
Percent
Frequency
0-4999
10
50
5000-9999
3
15
10000-14999
2
10
15000-19999
1
5
20000-24999
0
0
25000-29999
1
5
30000-34999
2
10
35000-39999
1
5
Total:
20
100
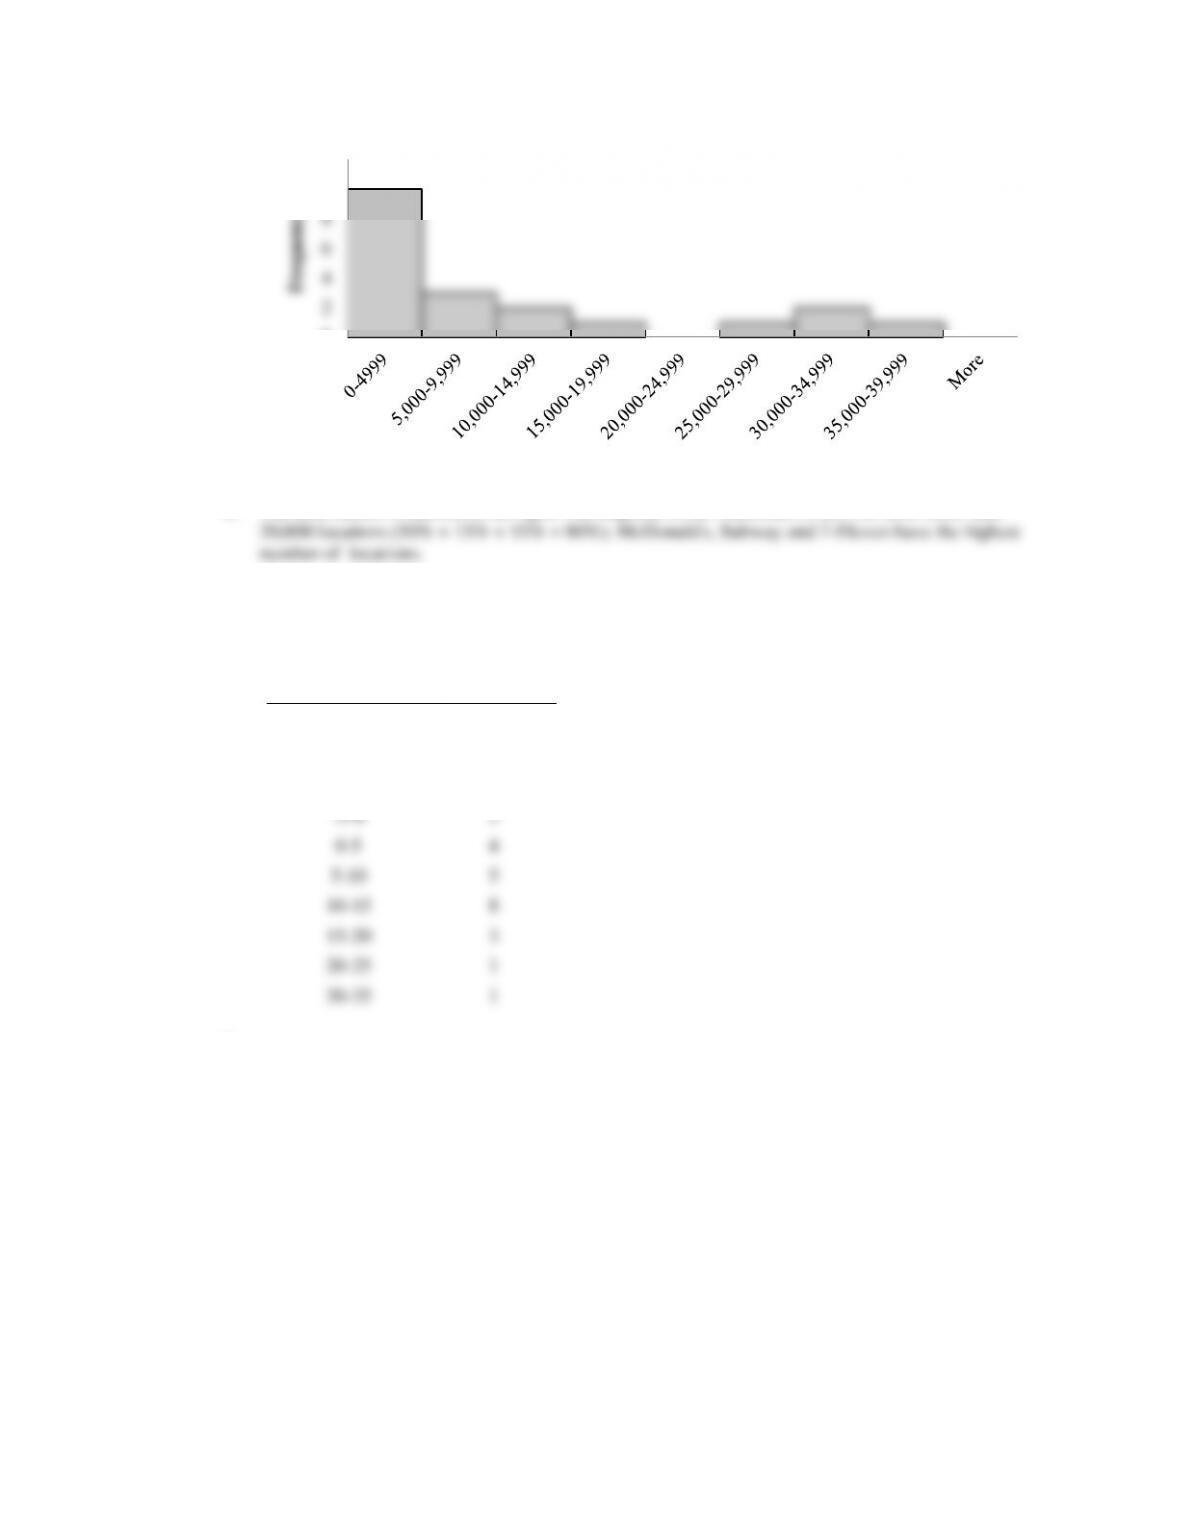
c. The distribution is skewed to the right. The majority of the franchises in this list have fewer than
23. a. The highest positive YTD % Change for Japan’s Nikkei index with a YTD % Change of 31.4%.
b. A class size of 10 results in 10 classes.
YTD % Change
Frequency
–20—15
1
–15—10
1
–10—5
3
-5-0
3
0-5
4
5-10
5
10–15
8
15–20
3
20–25
1
30–35
1
c.
0
2
4
6
8
10
12
Frequency
Number of U.S. Locations
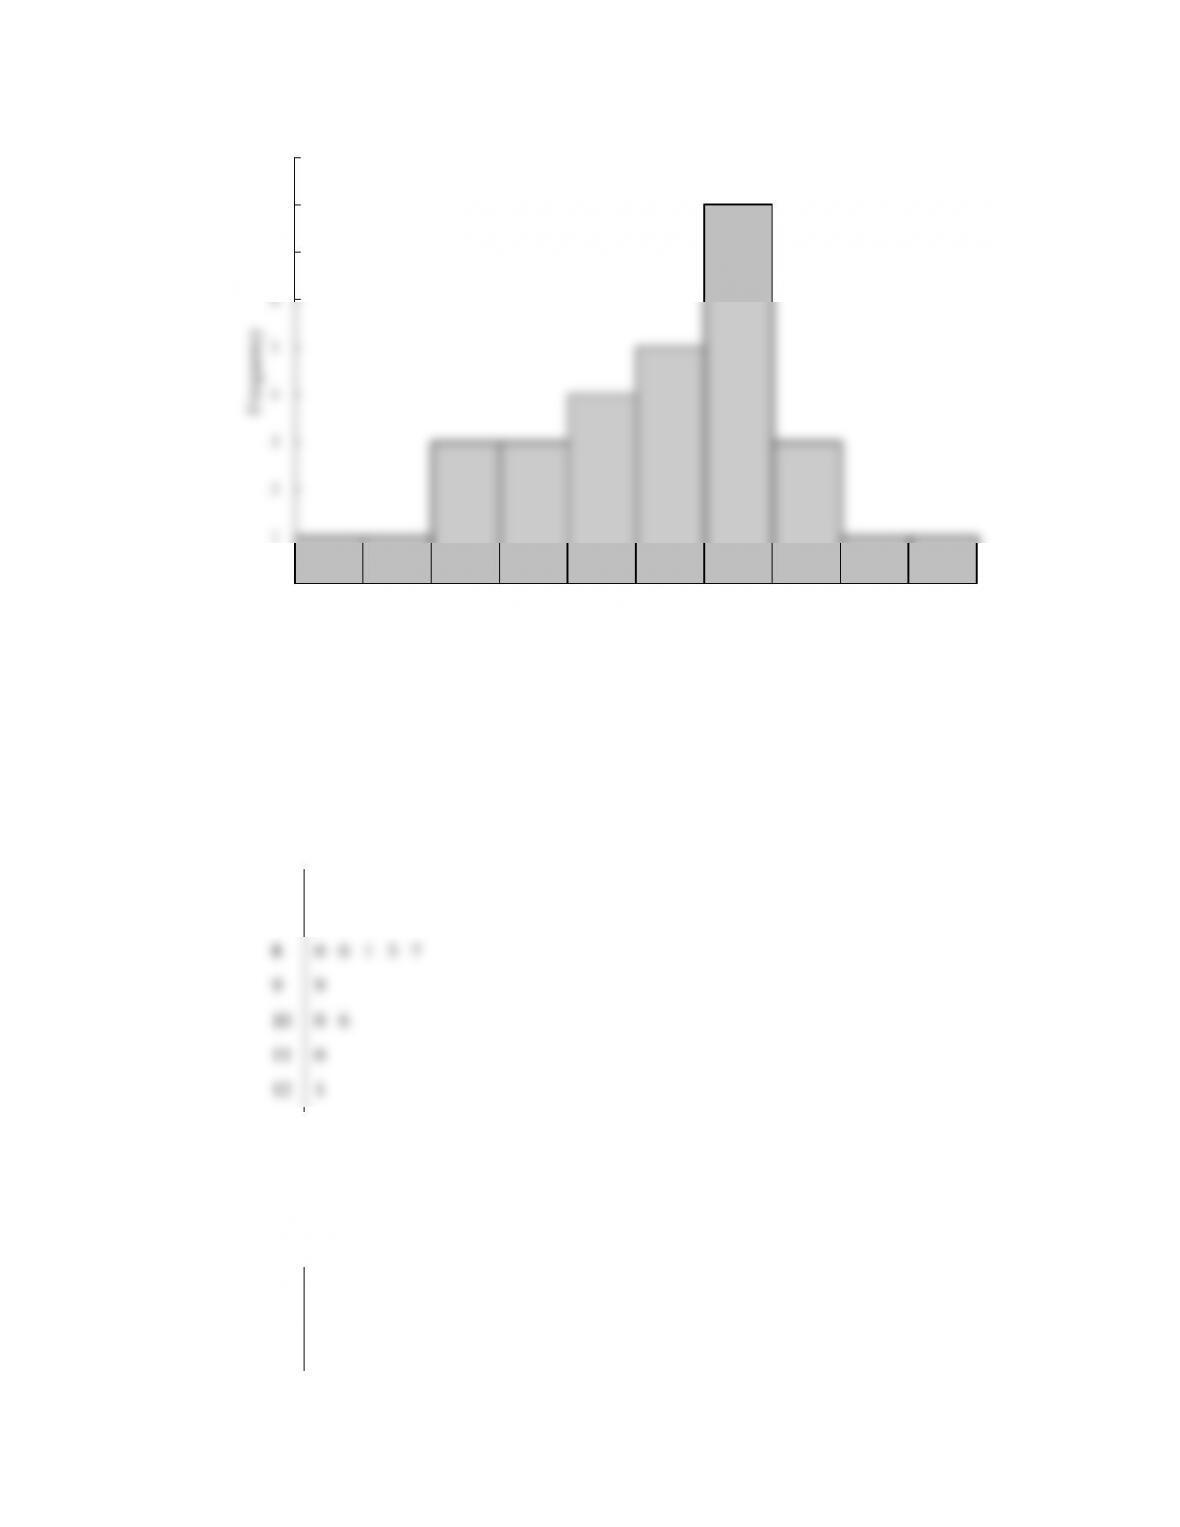
The general shape of the distribution is skewed to the right. Twenty two of the 30 indexes have a
positive YTD % Change and 13 have a YTD % Change of 10% or more. Eight of the indexes had a
negative YTD % Change.
d. A variety of comparisons are possible depending upon when the study is done.
24. Median Pay
6
6 7 7
7
2 4 6 7 7 8 9
8
0 0 1 3 7
9
9
10
0 6
11
0
12
1
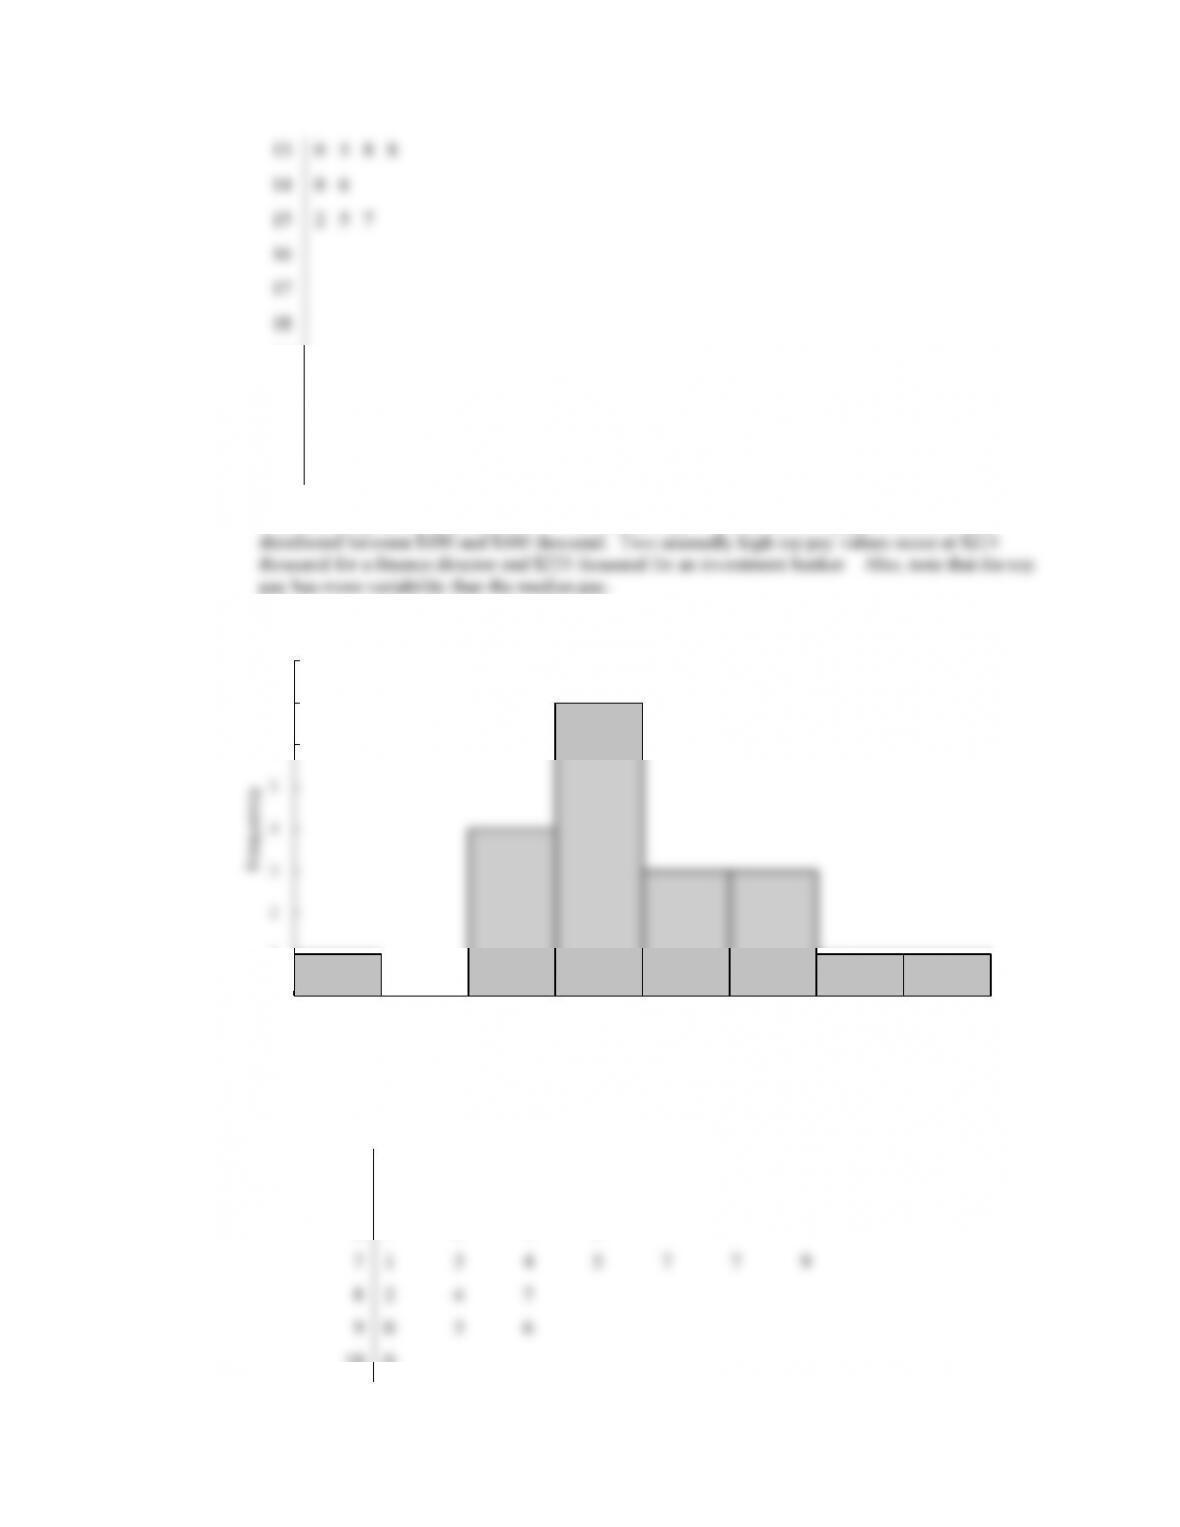
The median pay for these careers is generally in the $70 and $80 thousands. Only four careers have
a median pay of $100 thousand or more. The highest median pay is $121 thousand for a finance
director.
Top Pay
10
0 6 9
11
1 6 9
12
2 5 6
0
1
2
3
4
5
6
7
8
9
-20–15 -15–10 -10–5 -5-0 0-5 5-10 10-15 15-20 20-25 30-35
Frequency
YTD % Change
13
0 5 8 8
14
0 6
15
2 5 7
16
17
18
19
20
21
4
22
1
The most frequent top pay is in the $130 thousand range. However, the top pay is rather evenly
25. a.
b. The histogram is skewed to the right.
c.
4
3
5
6
1
3
7
9
7
1
3
4
5
7
7
9
8
2
4
7
9
0
3
6
10
0
0
1
2
3
4
5
6
7
8
40-50 50-60 60-70 70-80 80-90 90-100 100-110 110-120
Frequency
% Increase
11
3
is easier to construct by hand; and the stem-and-leaf display provides more information than the
histogram because the stem-and-leaf shows the actual data.
26. a.
2
1 4
2
6 7
3
0 1 1 1 2 3
3
5 6 7 7
4
0 0 3 3 3 3 3 4 4
4
6 6 7 9
5
0 0 0 2 2
5
5 6 7 9
6
1 4
6
6
7
2
b. Most frequent age group: 40-44 with 9 runners
c. 43 was the most frequent age with 5 runners
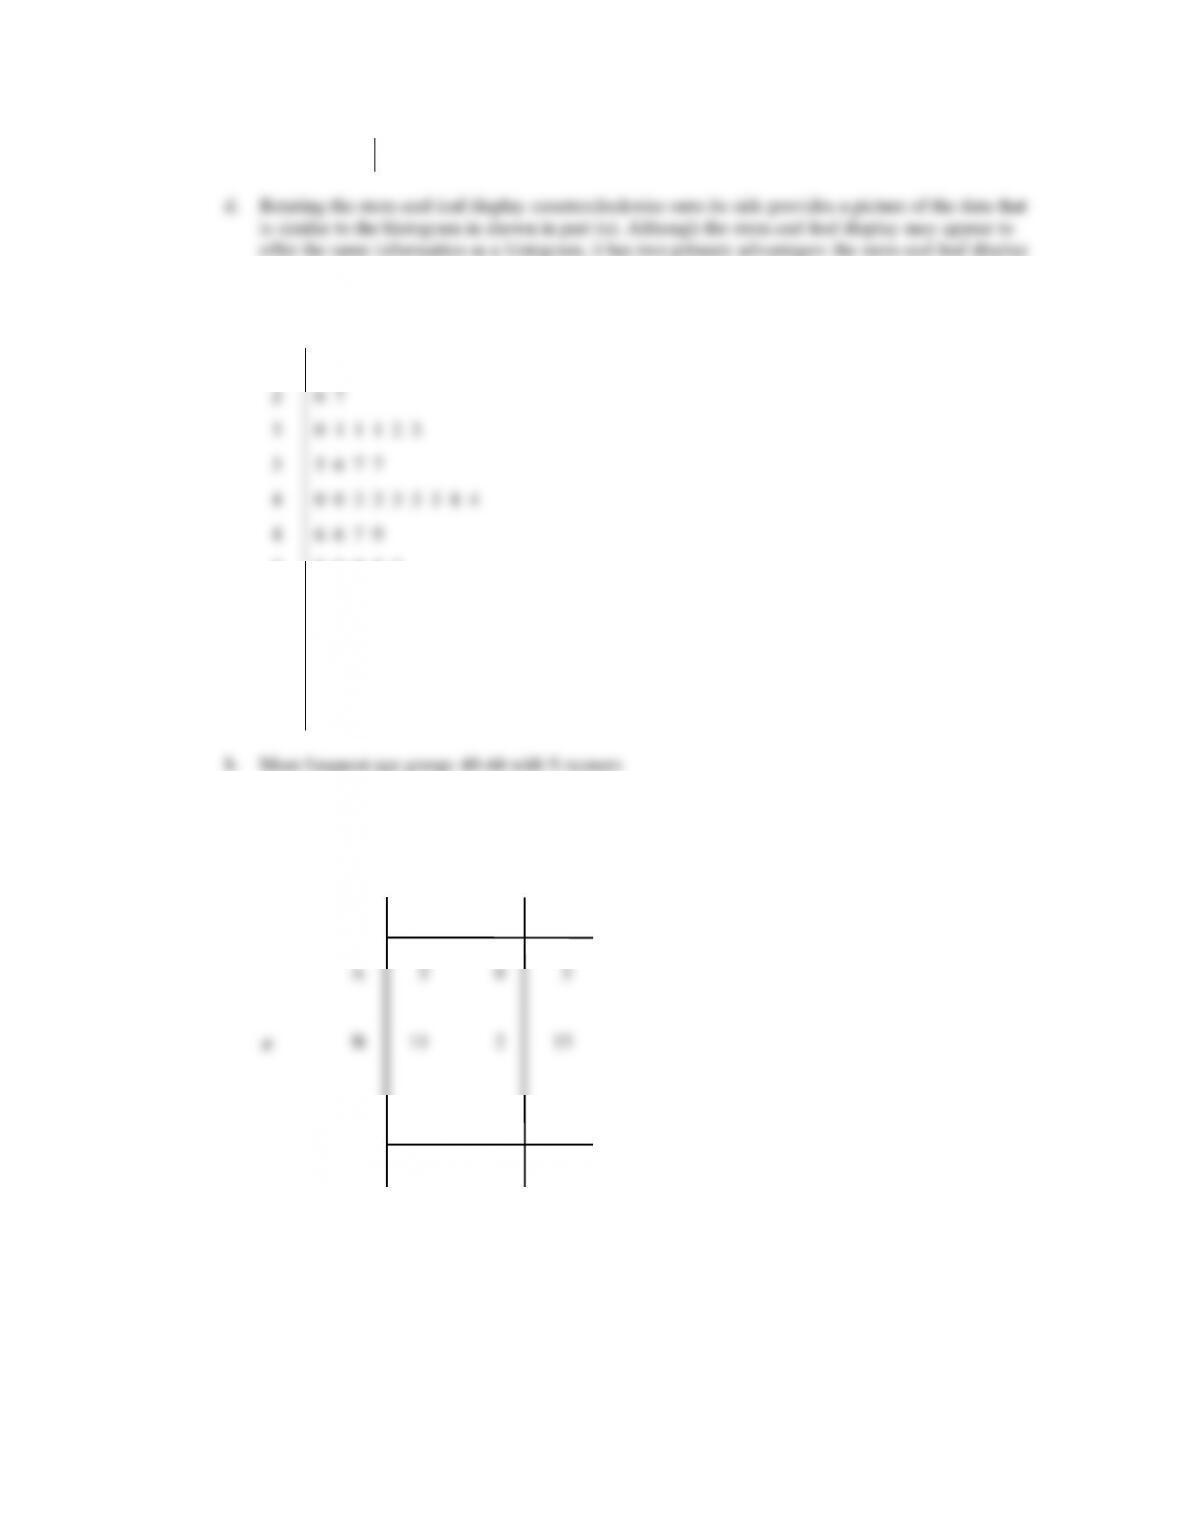
27. a.
y
x
A
B
C
5
11
2
0
2
10
12
18
5
13
12
30
Total
1
2
Total
b.
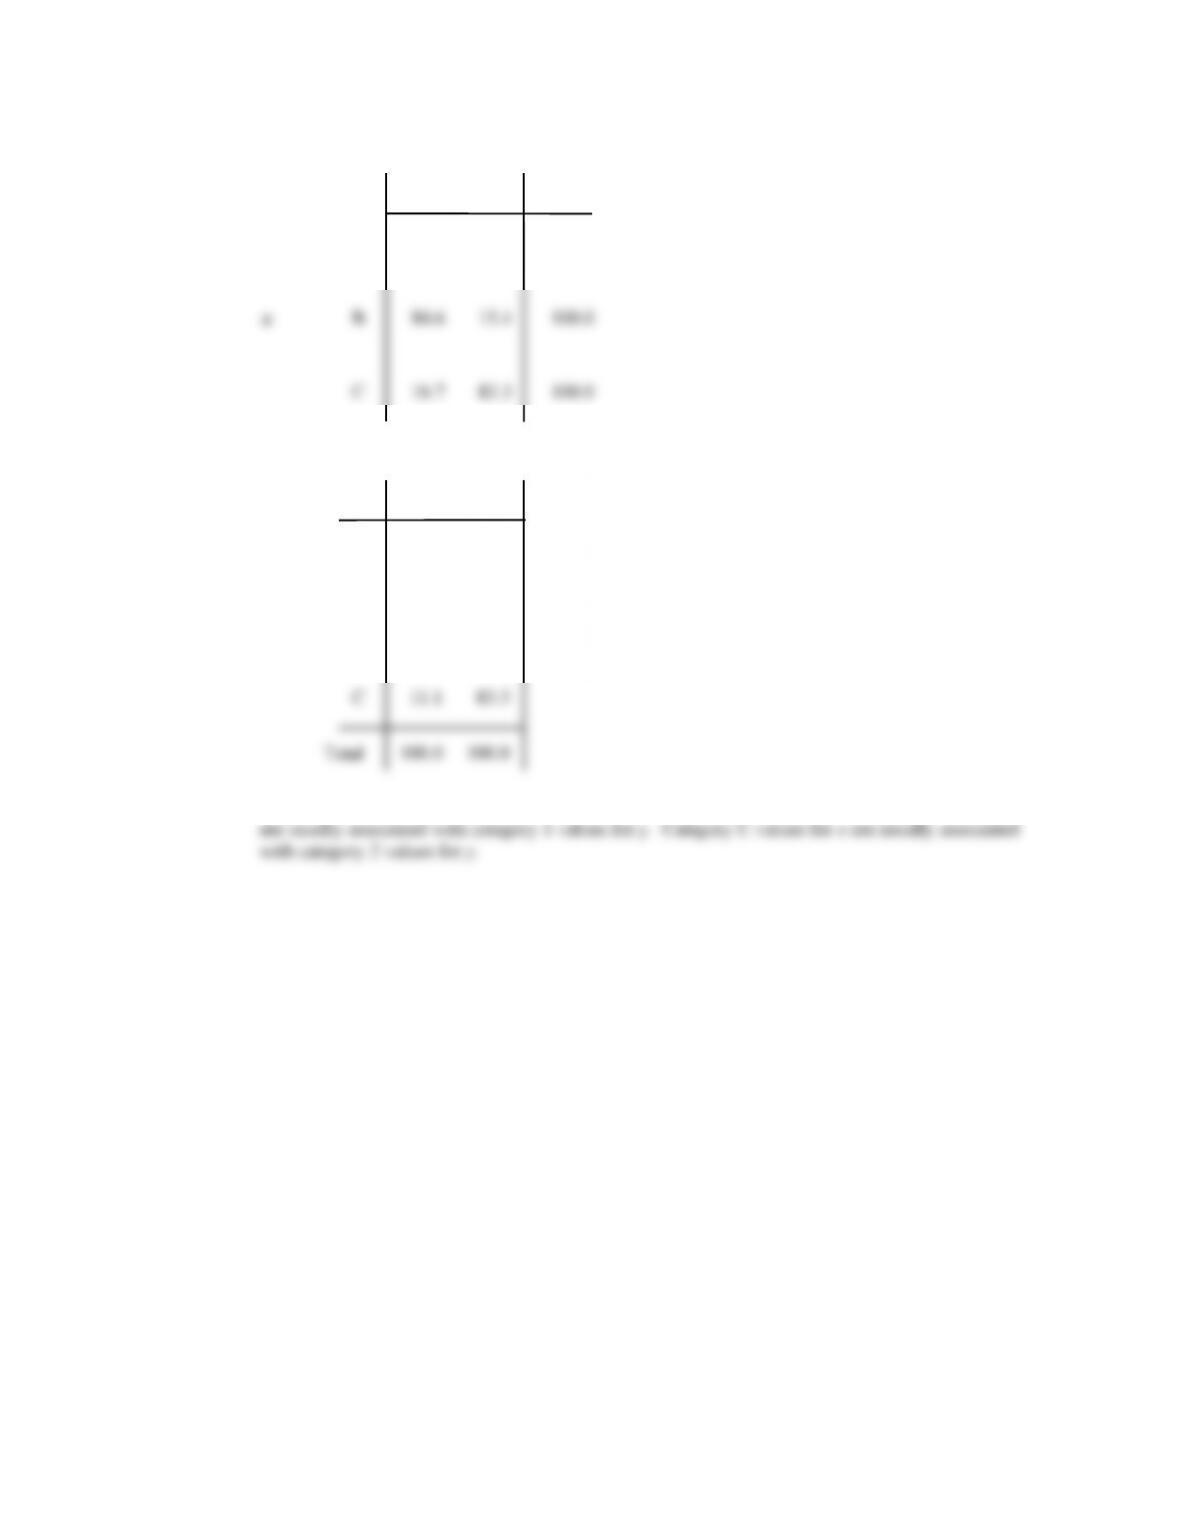
y
x
A
B
C
100.0
84.6
16.7
1
0.0
15.4
83.3
2
100.0
100.0
100.0
Total
c.
y
x
A
B
C
27.8
61.1
11.1
100.0
0.0
16.7
83.3
100.0
1
2
Total
d. Category A values for x are always associated with category 1 values for y. Category B values for x