Chapter 12 – Simple Linear Regression
7
.29
15
POINTS:
1
89. We are interested in determining the relationship between daily supply (y) and the unit price (x) for a particular item.
A sample of ten days supply and associated price resulted in the following data.
∑x = 66
∑x2 = 526
∑y = 71
∑y2= 605
∑xy = 557
a.
Develop the least square estimated regression equation.
b.
Compute the coefficient of determination and fully explain its meaning.
c.
At α = 0.05, perform a t-test and determine if the slope is significantly different from zero.
b.
0.8567; 85.67% of variation in supply is explained by variation in price
POINTS:
1
90. Given below are seven observations collected in a regression study on two variables, x (independent variable) and y
(dependent variable). Use Excel to develop a scatter diagram and to compute the least squares estimated regression
equation and the coefficient of determination.
x
y
2
12
3
9
6
8
7
7
8
6
7
5
9
2
91. Shown below is a portion of a computer output for a regression analysis relating y (dependent variable) and x
(independent variable).
ANOVA
df
SS
Regression
1
50.58
Residual
13
55.42
Total
14
106.00
Coefficients
Standard Error
t Stat
Intercept
16.156
1.42
Variable x
-0.903
0.26
a.
Perform a t test and determine whether or not y and x are related. Use α = 0.05.
b.
Compute the coefficient of determination and fully interpret the meaning. Be very specific.
POINTS:
1
92. Shown below is a portion of a computer output for regression analysis relating y (dependent variable) and x
(independent variable).
ANOVA
df
SS
Regression
1
882
Residual
20
4000
Total
21
4882
Coefficients
Standard Error
t Stat
Intercept
5.00
3.56
Variable x
6.30
3.00
a.
What has been the sample size for the above?
b.
Perform a t-test and determine whether or not x and y are related. Use α = 0.05.
c.
Perform an F-test and determine whether or not x and y are related. Use α = 0.05.
d.
Compute the coefficient of determination.
e.
Interpret the meaning of the value of the coefficient of determination that you found in d. Be
very specific.
a.
22
d.
0.1807
e.
18.07% of the variation in y is due to the variation in x.
POINTS:
1
93. Given below are seven observations collected in a regression study on two variables, x (independent variable) and y
(dependent variable). Use Excel’s Regression Tool to answer the following questions.
x
y
POINTS:
1
Chapter 12 – Simple Linear Regression
2
12
3
9
6
8
7
7
8
6
7
5
9
2
a.
What is the estimated regression equation?
b.
Perform a t test and determine whether or not x and y are related. Use α = 0.05.
c.
Perform an F test and determine whether or not x and y are related. Use α = 0.05.
d.
Find and interpret the coefficient of determination.
2
12
3
9
6
8
7
7
8
6
7
5
9
2
Multiple R
R Square
Adjusted R Sq.
Standard Error
7
1
27
5
6
60
1
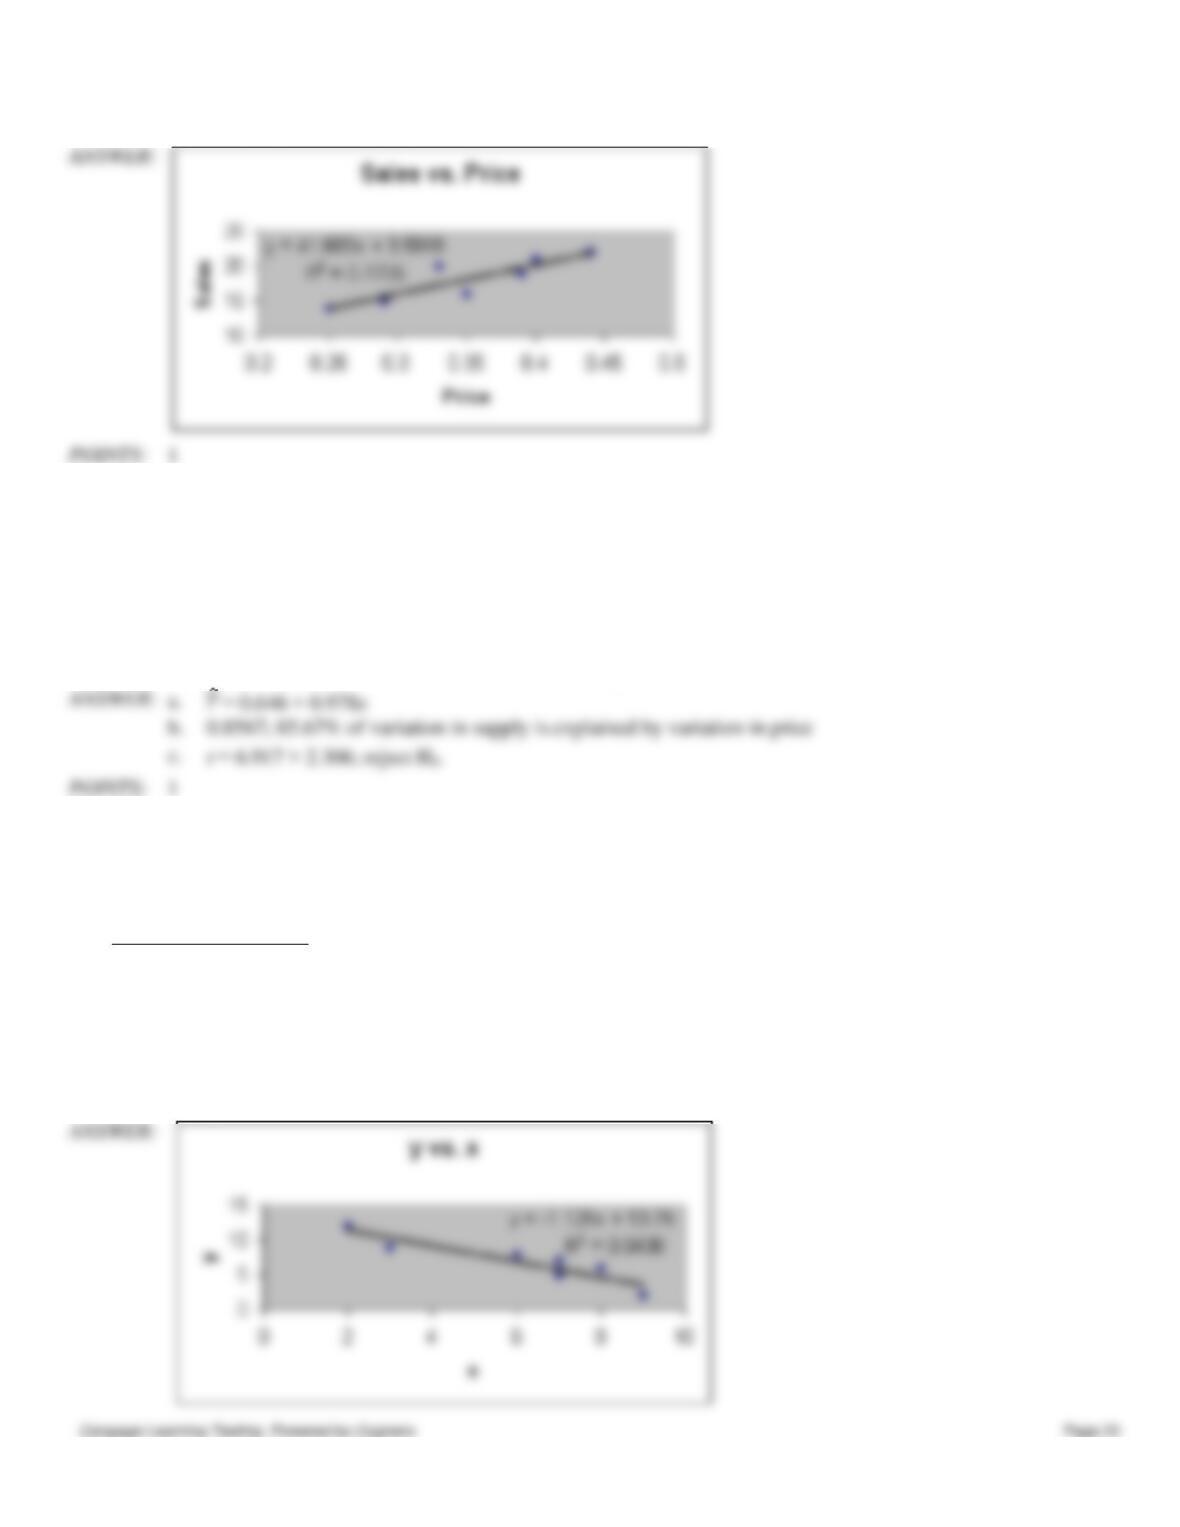
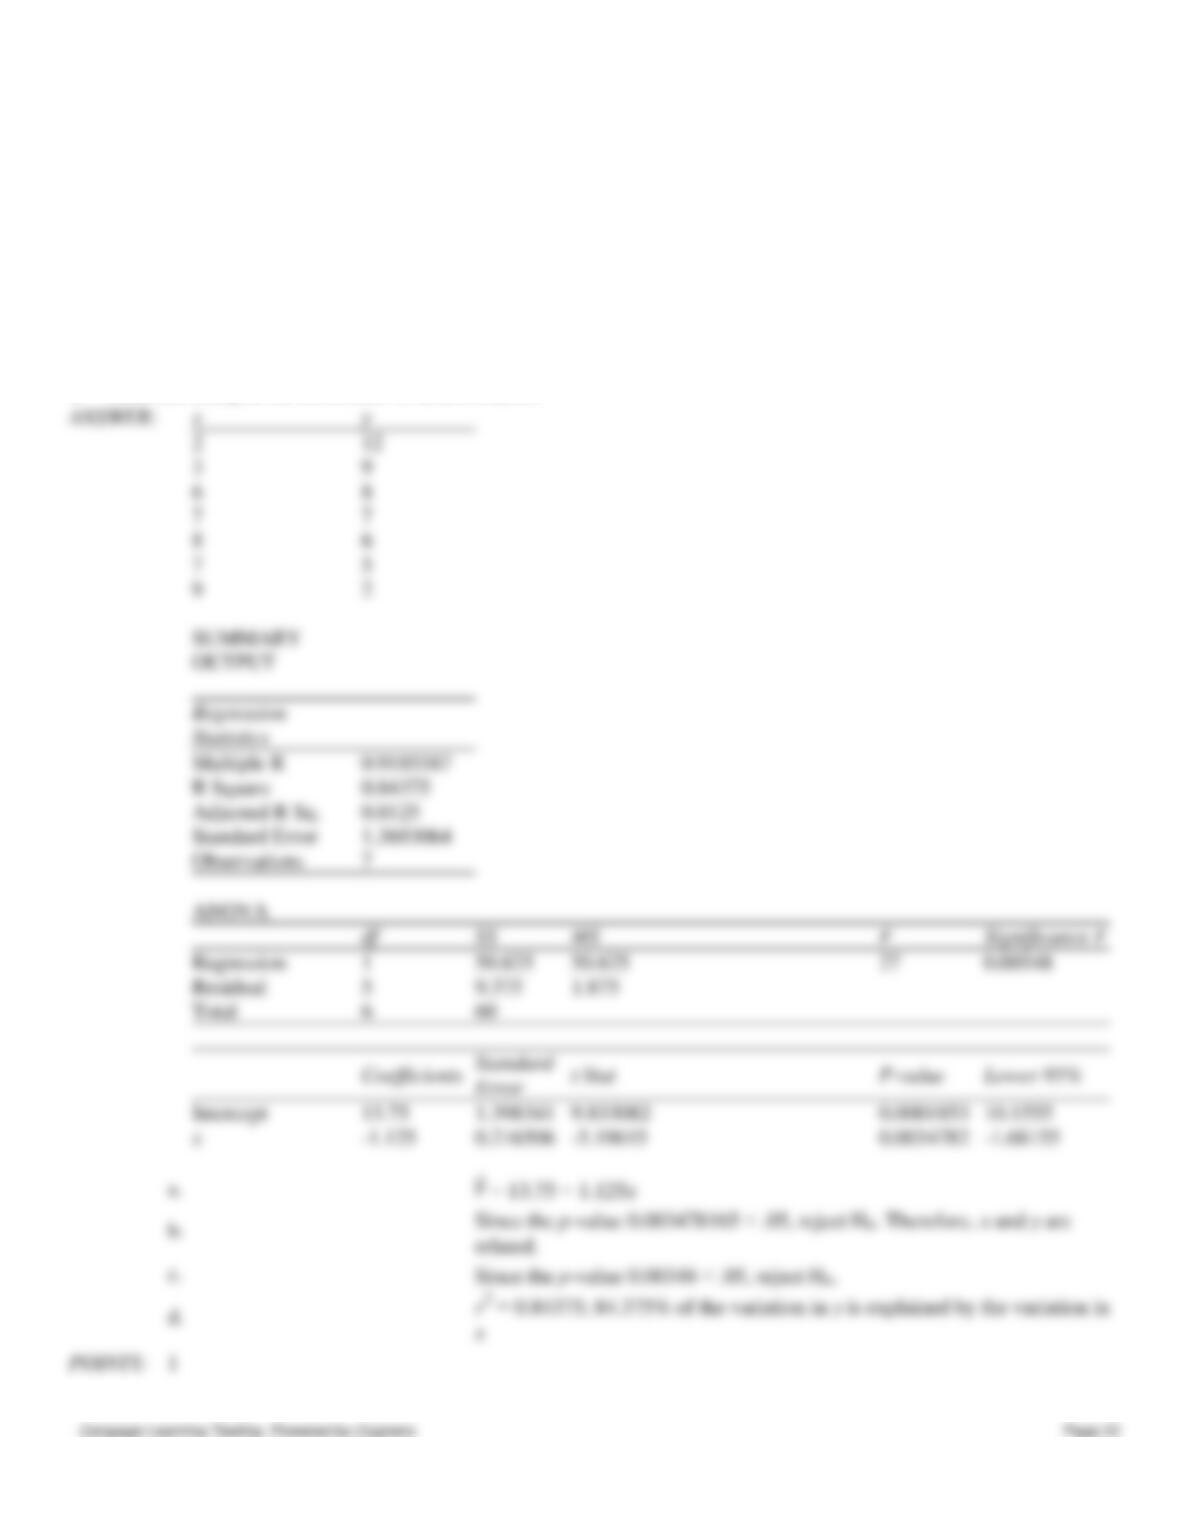
94. A company has recorded data on the weekly sales for its product (y) and the unit price of the competitor’s product (x).
The data resulting from a random sample of 7 weeks follows. Use Excel’s Regression Tool to answer the following
questions.
Week
Price
Sales
1
.33
20
2
.25
14
3
.44
22
4
.40
21
5
.35
16
6
.39
19
7
.29
15
a.
What is the estimated regression equation?
b.
Perform a t test and determine whether or not x and y are related. Use α = 0.05.
c.
Perform an F test and determine whether or not x and y are related. Use α = 0.05.
d.
Find and interpret the coefficient of determination.
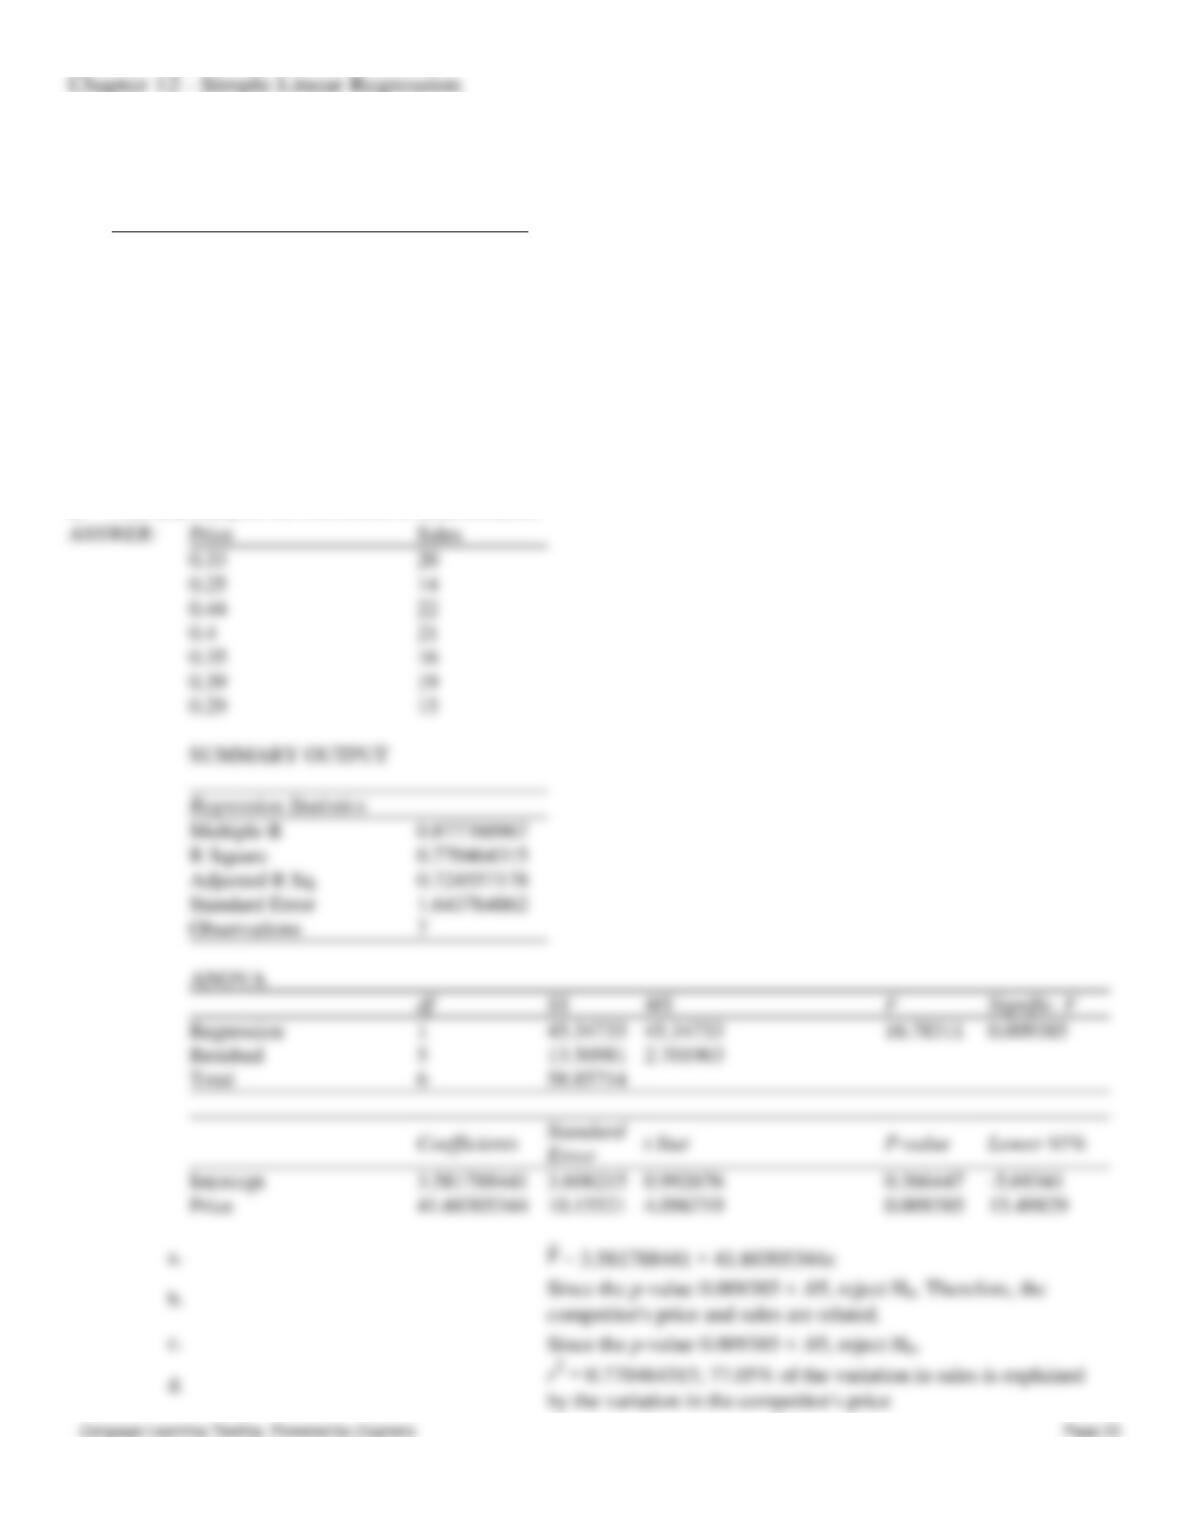
Price
Sales
0.33
20
0.25
14
0.44
22
0.4
21
0.35
16
0.39
19
0.29
15
SUMMARY OUTPUT
Multiple R
0.877760967
R Square
0.770464315
Adjusted R Sq.
0.724557178
Standard Error
1.643764862
Observations
7
ANOVA
Regression
1
45.34733
45.34733
16.78311
0.009385
Residual
5
13.50981
2.701963
Total
6
58.85714
Intercept
3.581788441
3.608215
0.992676
0.366447
-5.69341
Price
41.60305344
10.15521
4.096719
0.009385
15.49829
POINTS:
1
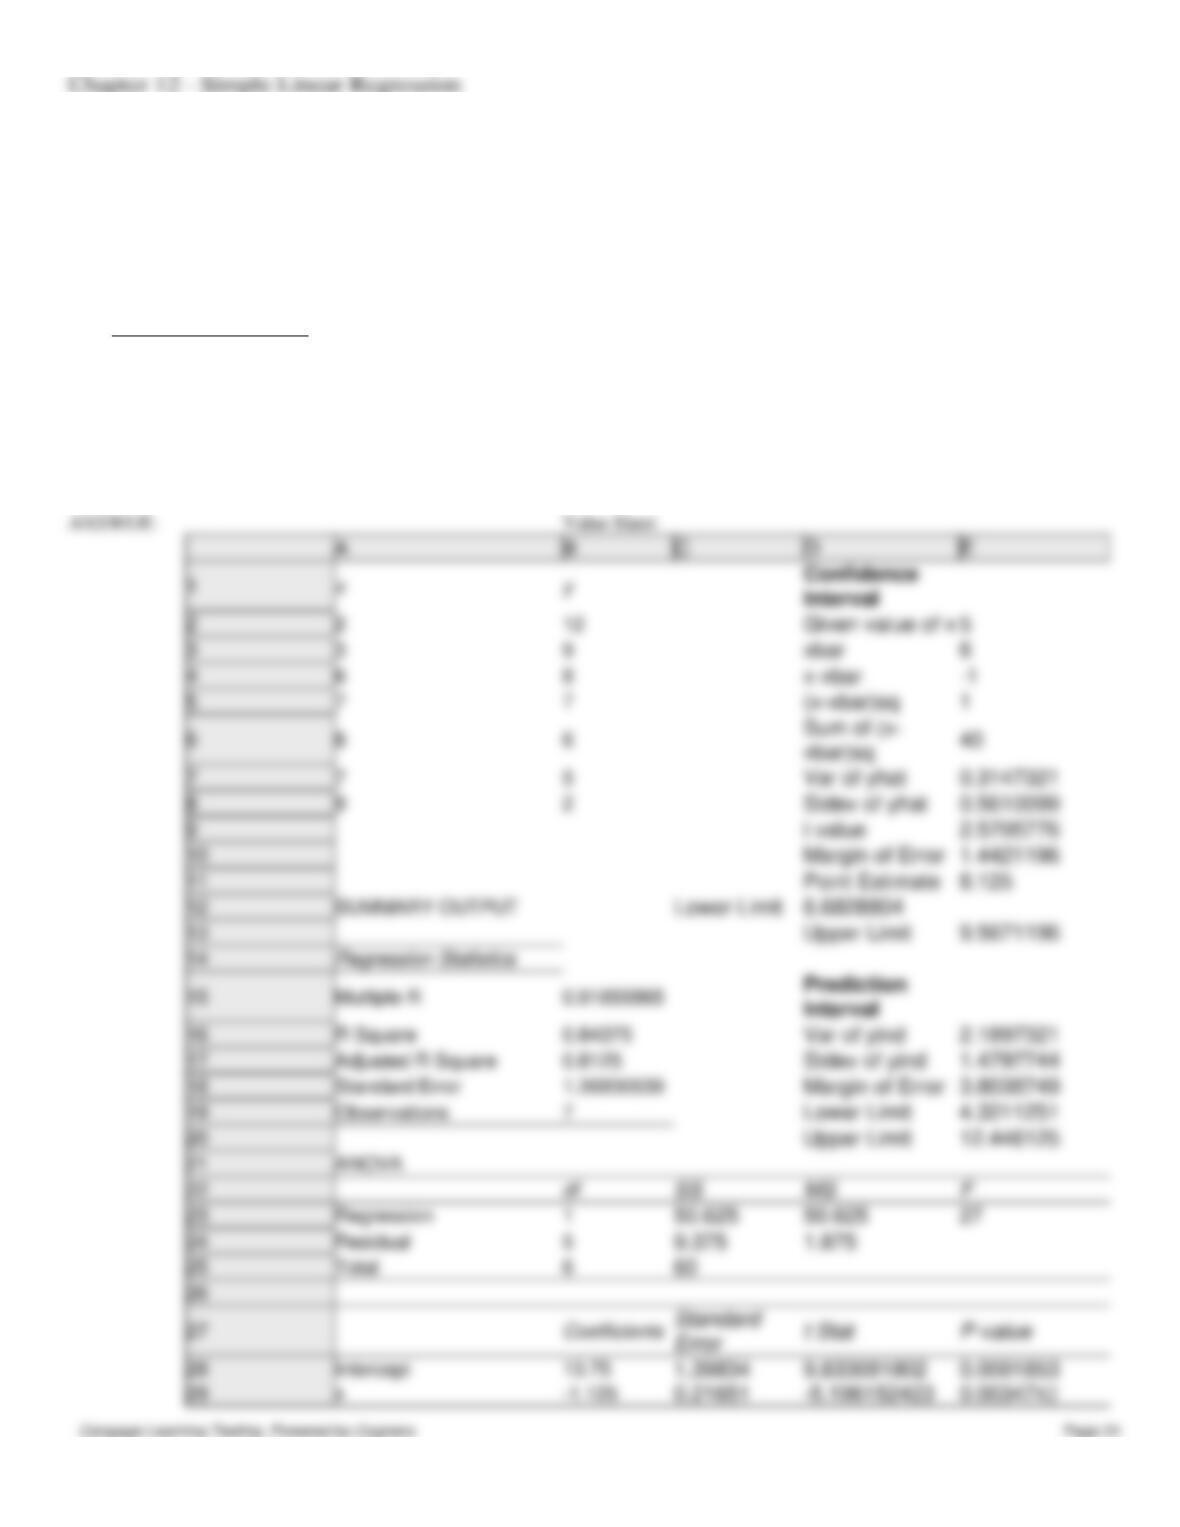
95. Given below are seven observations collected in a regression study on two variables, x (independent variable) and y
(dependent variable). Use Excel to
a.
compute a 95% confidence interval for E(y) when x = 5
b.
compute a 95% prediction interval for y when x = 5.
x
y
2
12
3
9
6
8
7
7
8
6
7
5
9
2
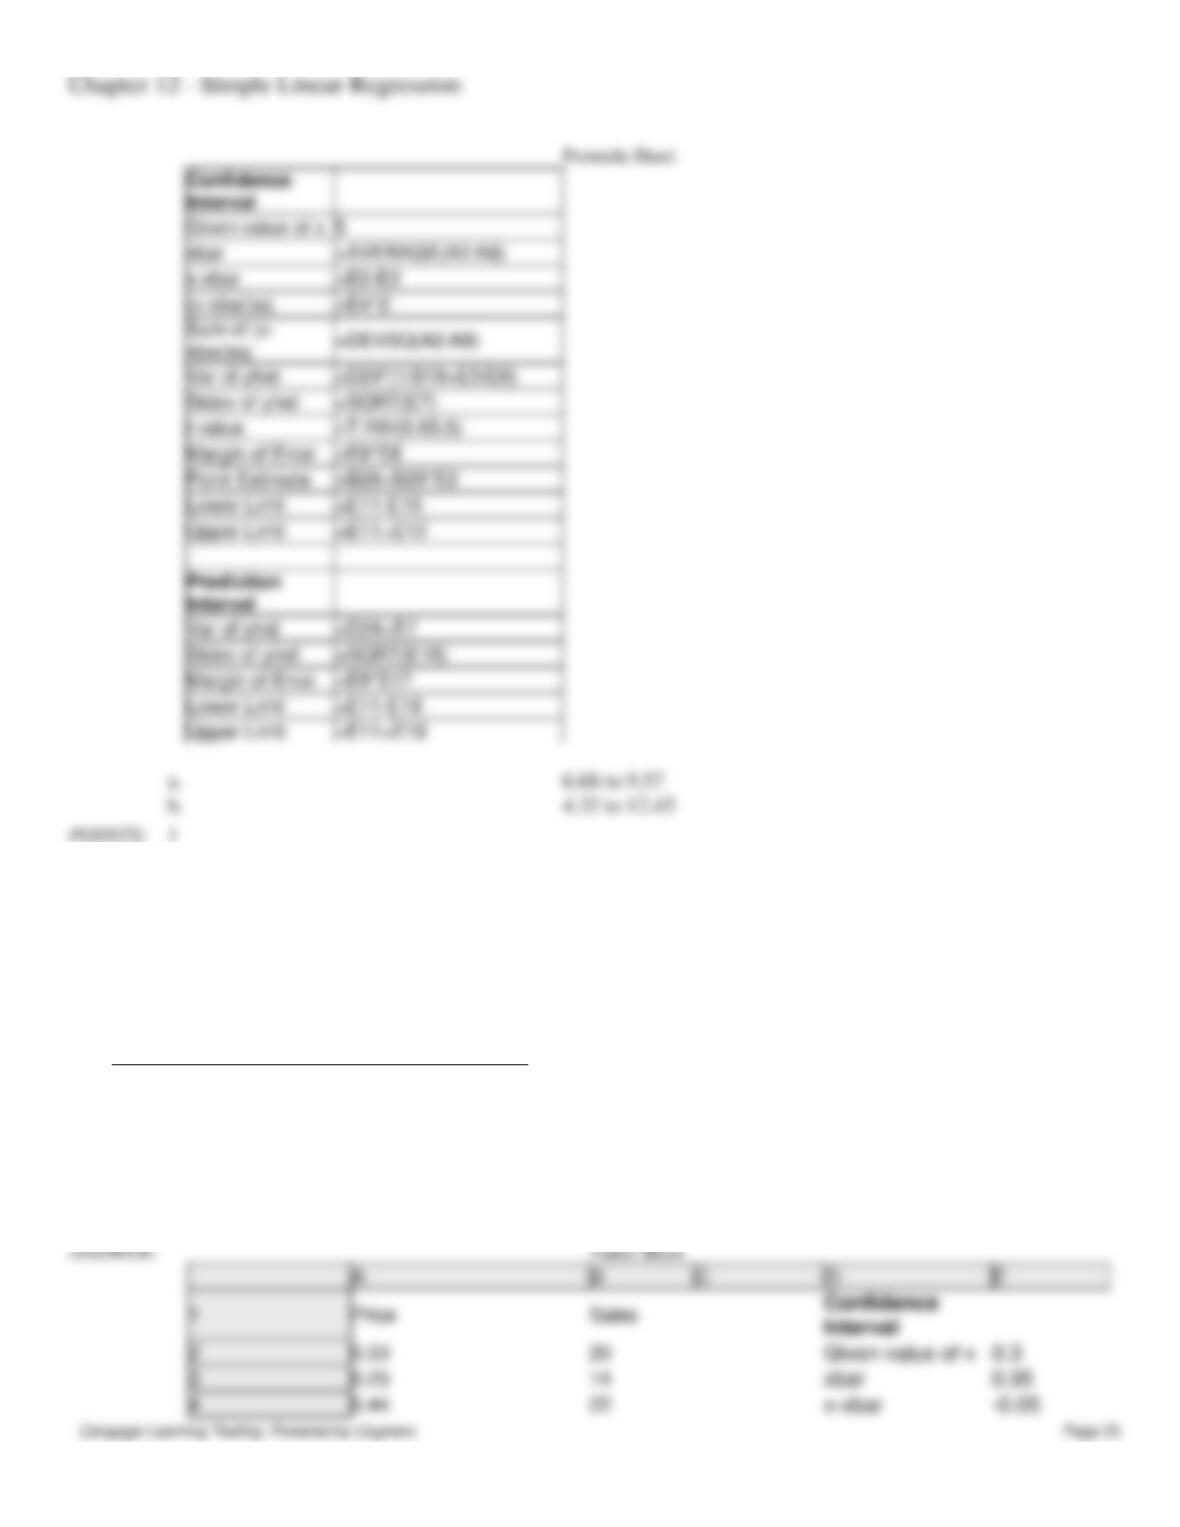
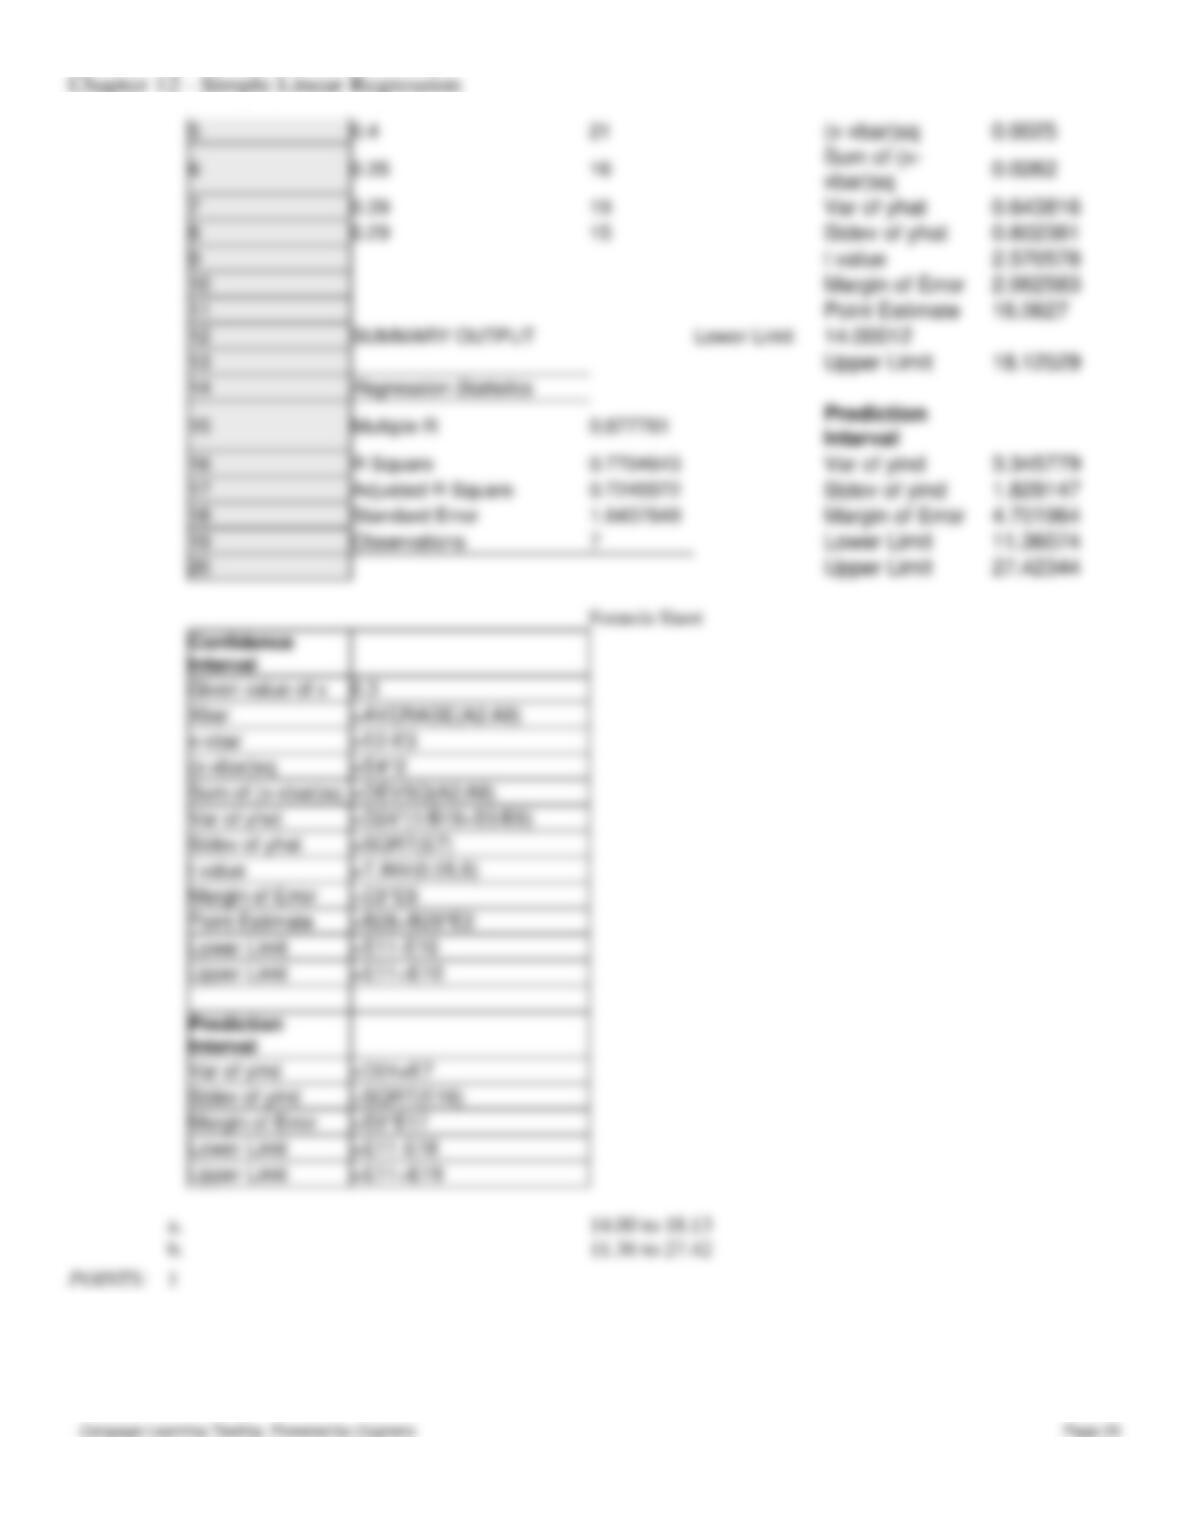
96. A company has recorded data on the weekly sales for its product (y) and the unit price of the competitor’s product (x).
The data resulting from a random sample of 7 weeks follows. Use Excel to:
a.
compute a 95% confidence interval for expected sales for all weeks when the competitor’s
price is .30.
b.
compute a 95% prediction interval for sales for a week when the competitor’s price is .30.
Week
Price
Sales
1
.33
20
2
.25
14
3
.44
22
4
.40
21
5
.35
16
6
.39
19
7
.29
15
6.68 to 9.57
b.
4.32 to 12.45
1
97. Given below are seven observations collected in a regression study on two variables, x (independent variable) and y
(dependent variable). Use Excel’s Regression Tool to construct a residual plot and use it to determine if any model
assumption have been violated.
Chapter 12 – Simple Linear Regression
x
y
2
12
3
9
6
8
7
7
8
6
7
5
9
2
POINTS:
1
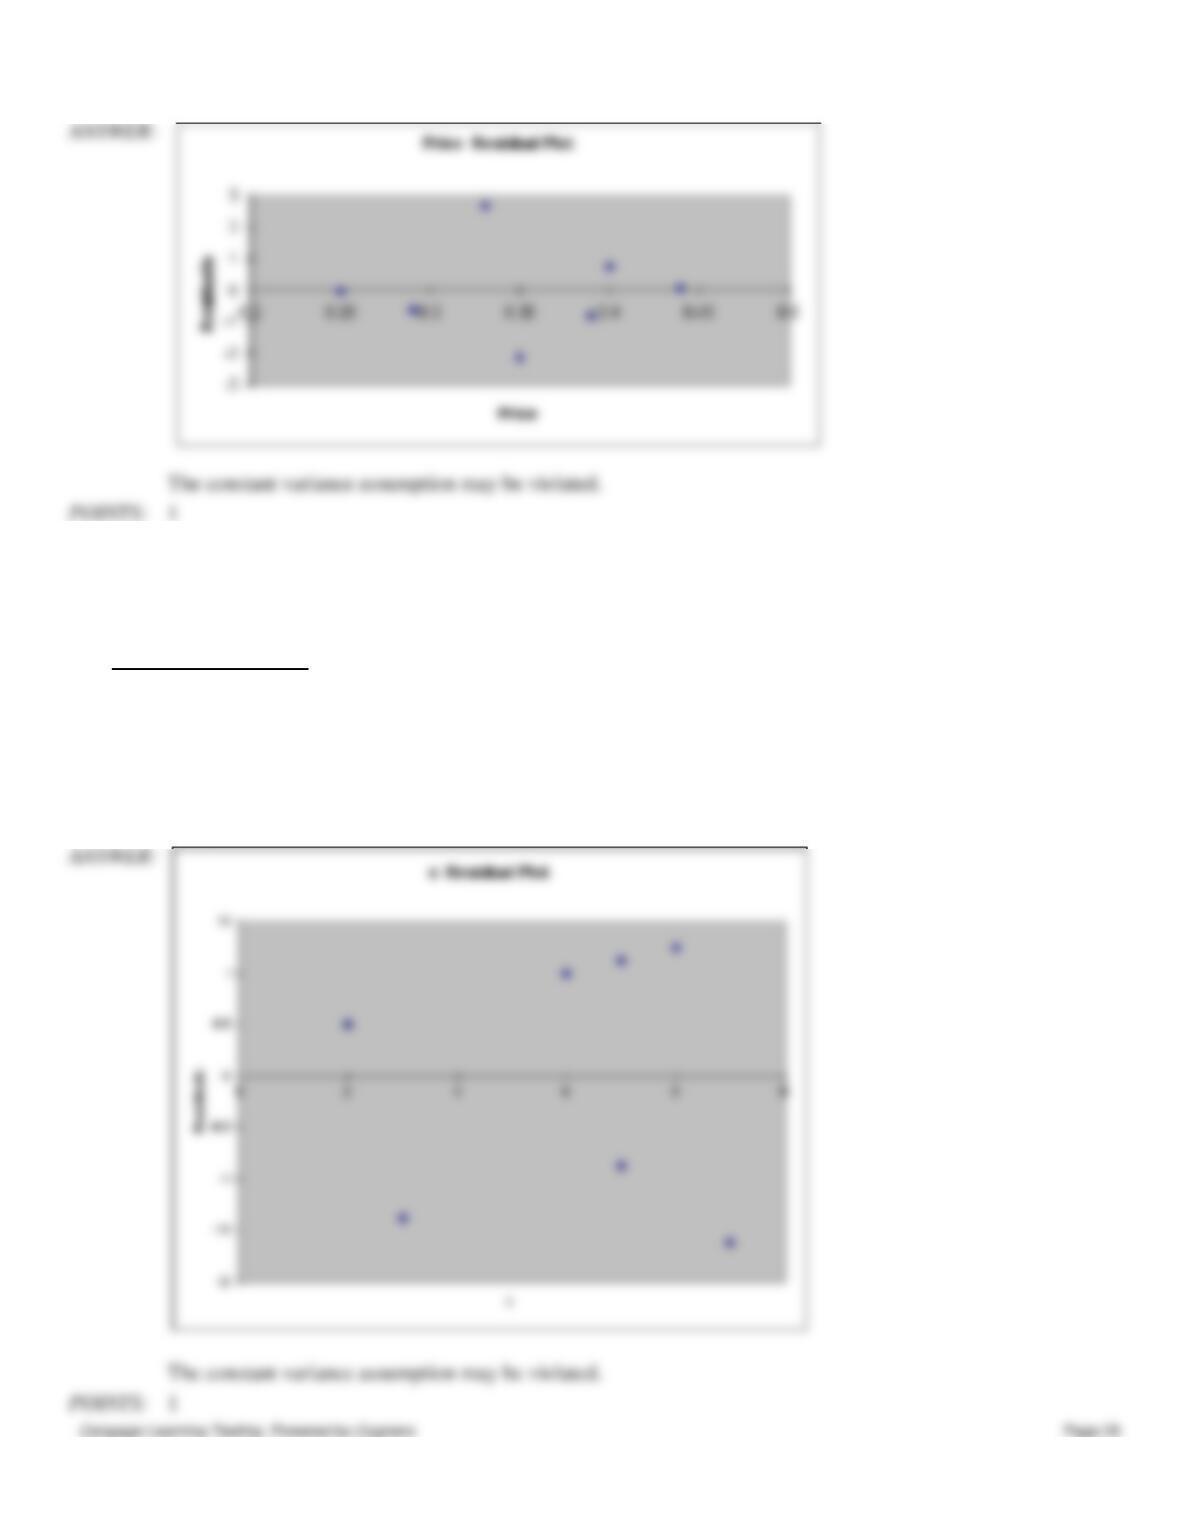
98. A company has recorded data on the weekly sales for its product (y) and the unit price of the competitor’s product (x).
The data resulting from a random sample of 7 weeks follows. Use Excel’s Regression Tool to construct a residual plot and
use it to determine if any model assumption have been violated.
Week
Price
Sales
1
.33
20
2
.25
14
3
.44
22
4
.40
21
5
.35
16
6
.39
19
7
.29
15
Chapter 12 – Simple Linear Regression
POINTS:
1
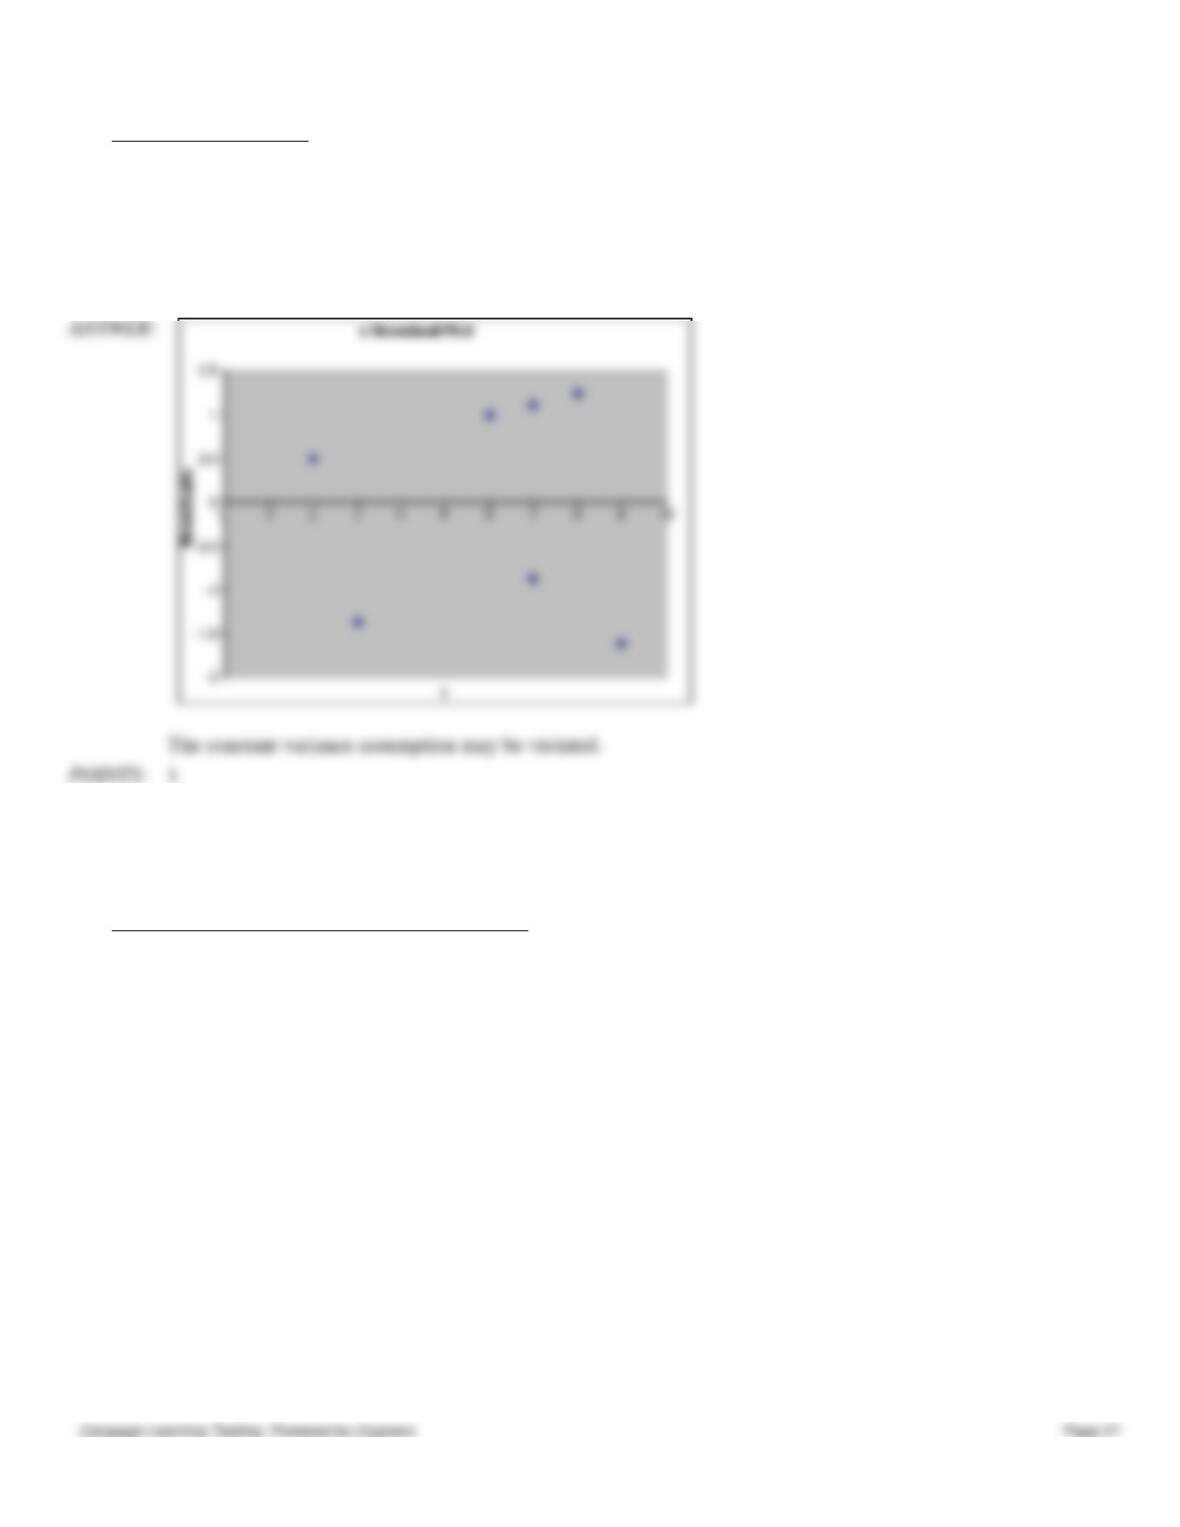
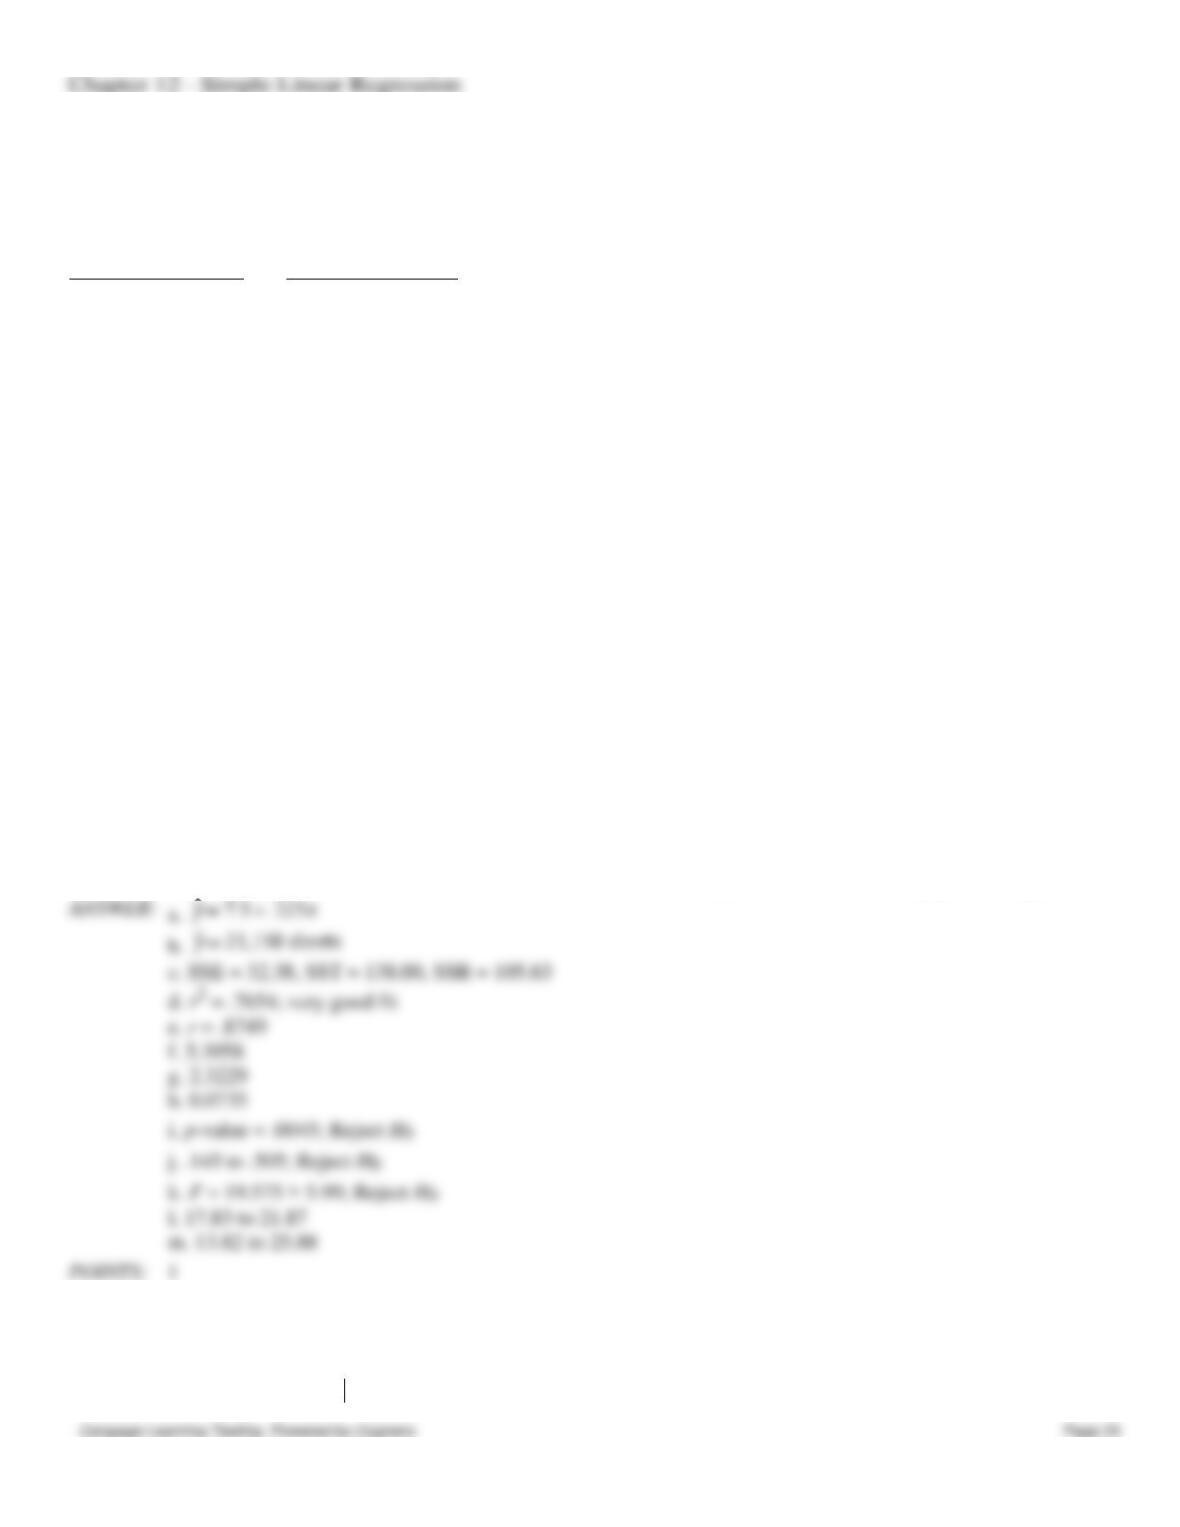
99. Given below are seven observations collected in a regression study on two variables, x (independent variable) and y
(dependent variable). Use Excel’s Regression Tool to construct a residual plot and use it to determine if any model
assumption have been violated.
x
y
2
12
3
9
6
8
7
7
8
6
7
5
9
2
POINTS:
1
100. Connie Harris, in charge of office supplies at First Capital Mortgage Corp., would like to predict the quantity of
paper used in the office photocopying machines per month. She believes that the number of loans originated in a month
influence the volume of photocopying performed. She has compiled the following recent monthly data:
Number of Loans
Originated in Month
Sheets of Photocopy
Paper Used (1000’s)
45
22
25
13
50
24
60
25
40
21
25
16
35
18
40
25
a. Develop the least-squares estimated regression equation that relates sheets of photocopy paper used to loans originated.
b. Use the regression equation developed in part (a) to forecast the amount of paper used in a month when 42 loan
originations are expected.
c. Compute SSE, SST, and SSR.
d. Compute the coefficient of determination r2. Comment on the goodness of fit.
e. Compute the correlation coefficient.
f. Compute the mean square error MSE.
g. Compute the standard error of the estimate.
h. Compute the estimated standard deviation of b1.
i. Use the t test to test the following hypothesis β1 = 0 at α = .05.
j. Develop a 95% confidence interval estimate for β1 to test the hypothesis β1 = 0.
k. Use the F test to test the hypothesis β1 = 0 at a .05 level of significance.
l. Develop a 95% confidence interval estimate of the mean number of sheets of paper used when 38 mortgages are
originated.
m. Develop a 95% prediction interval estimate for the number of sheets of paper used when 38 mortgages are originated.
101. Scott Bell Builders would like to predict the total number of labor hours spent framing a house based on the square
footage of the house. The following data has been compiled on ten houses recently built.
Square
Framing
Square
Framing
Chapter 12 – Simple Linear Regression
Footage
(100s)
Labor
Hours
Footage
(100s)
Labor
Hours
20
195
27
225
21
170
29
240
23
220
31
225
23
200
32
275
26
230
35
260
a. Develop the least-squares estimated regression equation that relates framing labor hours to house square footage.
b. Use the regression equation developed in part (a) to predict framing labor hours when the house size is 3350 square
feet.
1
102. Assume you have noted the following prices for books and the number of pages that each book contains.
Book
Pages (x)
Price (y)
A
500
$7.00
B
700
7.50
C
750
9.00
D
590
6.50
E
540
7.50
F
650
7.00
G
480
4.50
a.
Develop a least-squares estimated regression line.
b.
Compute the coefficient of determination and explain its meaning.
c.
Compute the correlation coefficient between the price and the number of pages. Test to see
if x and y are related. Use α = 0.10.
1
103. Assume you have noted the following prices for books and the number of pages that each book contains.
Book
Pages (x)
Price (y)
A
500
$7.00
B
700
7.50
C
750
9.00
D
590
6.50
E
540
7.50
F
650
7.00
G
480
4.50
a.
Perform an F test and determine if the price and the number of pages of the books are related.
Let α = 0.01.
b.
Perform a t test and determine if the price and the number of pages of the books are related.
Let α = 0.01.
Chapter 12 – Simple Linear Regression
c.
Develop a 90% confidence interval for estimating the average price of books that contain 800
pages.
d.
Develop a 90% confidence interval to estimate the price of a specific book that has 800 pages.
c.
$7.29 to $10.63 (rounded)
d.
$5.62 to $12.31 (rounded)
1
104. The following data represent the number of flash drives sold per day at a local computer shop and their prices.
Price (x)
Units Sold (y)
$34
3
36
4
32
6
35
5
30
9
38
2
40
1
a.
Develop a least-squares regression line and explain what the slope of the line indicates.
b.
Compute the coefficient of determination and comment on the strength of relationship
between x and y.
c.
Compute the sample correlation coefficient between the price and the number of flash drives
sold. Use α= 0.01 to test the relationship between x and y.
0.7286 units.
1
105. The following data represent the number of flash drives sold per day at a local computer shop and their prices.
Price (x)
Units Sold (y)
$34
3
36
4
32
6
35
5
30
9
38
2
40
1
a.
Perform an F test and determine if the price and the number of flash drives sold are related.
Let α = 0.01.
b.
Perform a t test and determine if the price and the number of flash drives sold are related.
Let α = 0.01.
Chapter 12 – Simple Linear Regression
1
106. Shown below is a portion of an Excel output for regression analysis relating Y (dependent variable) and X
(independent variable).
ANOVA
df
SS
Regression
1
110
Residual
8
74
Total
9
184
Intercept
39.222
5.943
x
-0.5556
0.1611
a.
What has been the sample size for the above?
b.
Perform a t test and determine whether or not X and Y are related. Let α = 0.05.
c.
Perform an F test and determine whether or not X and Y are related. Let α = 0.05.
d.
Compute the coefficient of determination.
e.
Interpret the meaning of the value of the coefficient of determination that you found in d. Be
very specific.
Multiple R
0.7732
R Square
0.5978
Adjusted R Square
0.5476
Standard Error
3.0414
Observations
10
ANOVA
df
SS
Regression
1
110
110
11.892
0.009
Residual
8
Total
9
184
Intercept
39.222
5.942
6.600
0.000
x
-0.556
0.161
-3.448
0.009
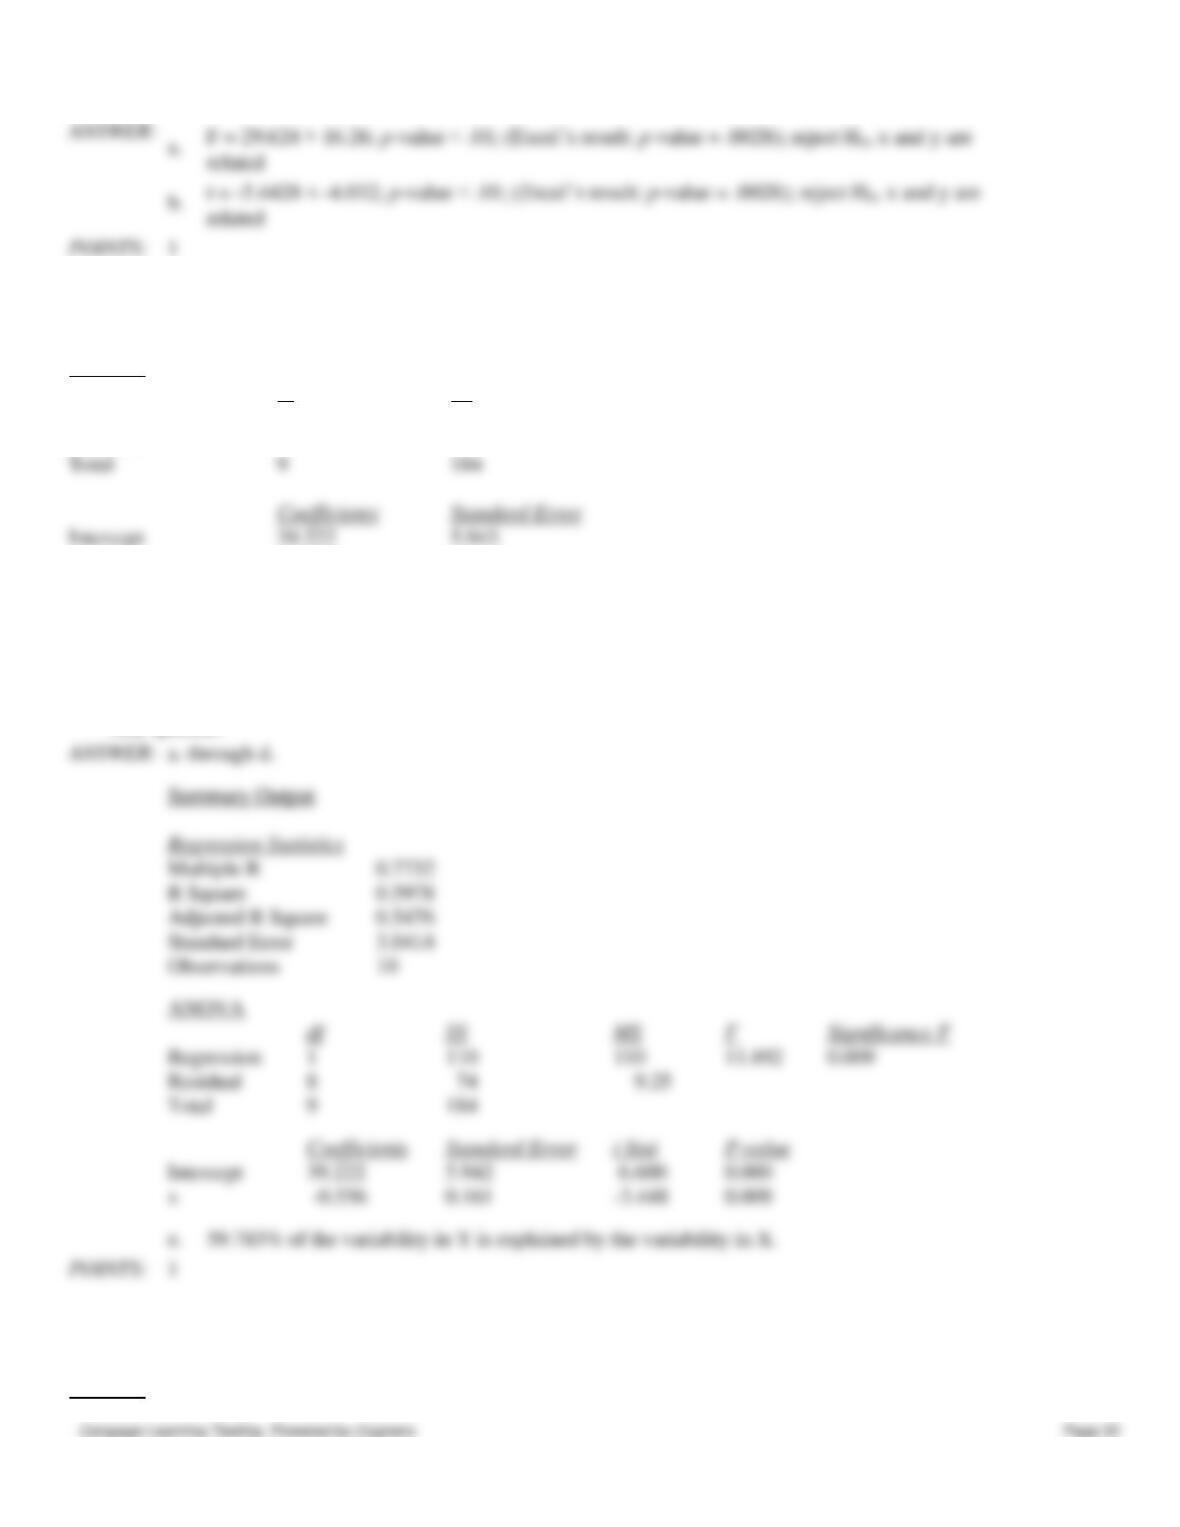
e.
59.783% of the variability in Y is explained by the variability in X.
1
107. Shown below is a portion of a computer output for regression analysis relating Y (dependent variable) and X
(independent variable).
ANOVA
Chapter 12 – Simple Linear Regression
df
SS
Regression
1
24.011
Residual
8
67.989
Coefficients
Standard Error
Intercept
11.065
2.043
x
-0.511
0.304
a.
What has been the sample size for the above?
b.
Perform a t test and determine whether or not X and Y are related. Let α = 0.05.
c.
Perform an F test and determine whether or not X and Y are related. Let α = 0.05.
d.
Compute the coefficient of determination.
e.
Interpret the meaning of the value of the coefficient of determination that you found in d. Be
very specific.
Summary Output
Regression Statistics
Multiple R
0.511
R Square
0.261
Adjusted R Square
0.169
Standard Error
2.915
Observations
10
ANOVA
df
SS
MS
F
Significance F
Regression
1
24.011
24.011
2.825
0.131
Residual
8
67.989
Total
9
92
Coefficients
Standard Error
t Stat
P-value
Intercept
11.065
2.043
5.415
0.001
x
-0.511
0.304
-1.681
0.131
e.
26.1% of the variability in Y is explained by the variability in X.
POINTS:
1
108. Part of an Excel output relating X (independent variable) and Y (dependent variable) is shown below. Fill in all the
blanks marked with “?”.
Summary Output
Regression Statistics
Multiple R
0.1347
R Square
?
Adjusted R Square
?
Standard Error
3.3838
Observations
?
ANOVA
df
SS
MS
F
Significance F
Regression
?
2.7500
?
?
0.632
Residual
?
?
11.45
Chapter 12 – Simple Linear Regression
Total
14
?
Coefficients
Standard Error
t Stat
P-value
Intercept
8.6
2.2197
?
0.0019
x
0.25
0.5101
?
0.632
Regression Statistics
Multiple R
0.1347
R Square
0.0181
Adjusted R Square
-0.0574
Standard Error
3.384
Observations
15
df
SS
F
Significance F
Regression
1
2.750
2.75
0.2402
0.6322
Residual
13
148.850
11.45
Total
14
151.600
Coefficients
Standard Error
t Stat
p-value
Intercept
8.6
2.2197
3.8744
0.0019
x
0.25
0.5101
0.4901
0.6322
POINTS:
1
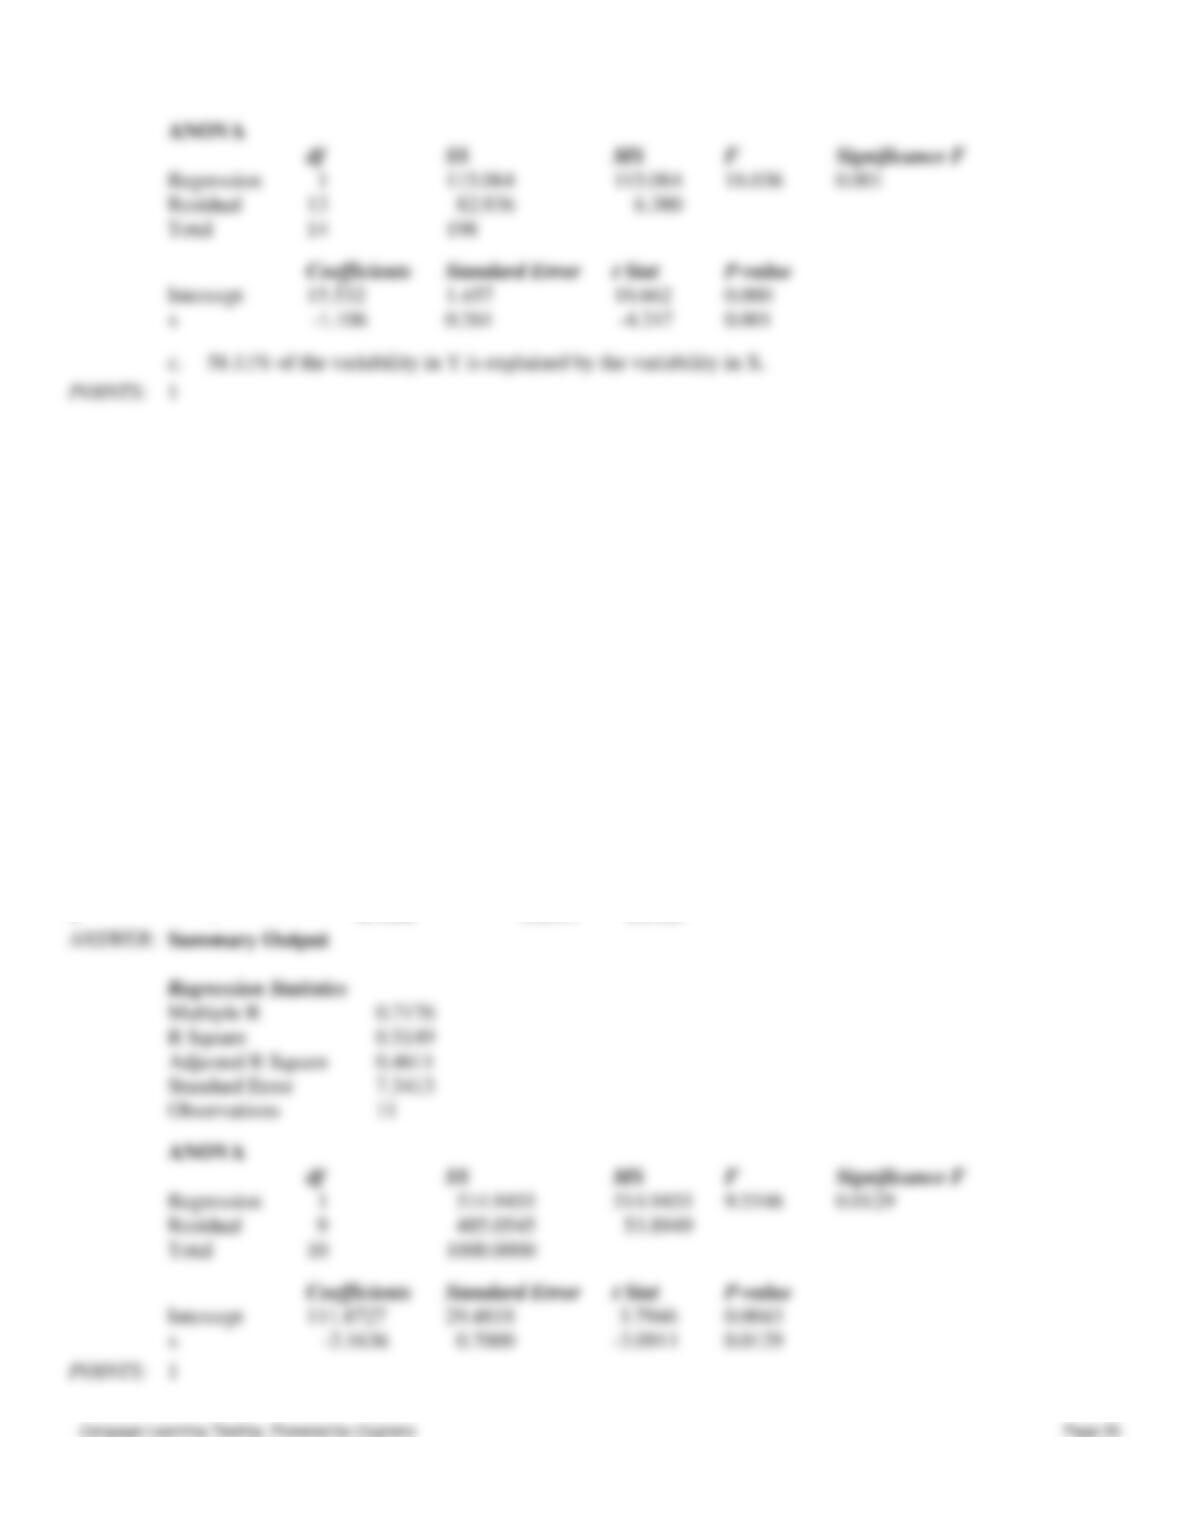
109. Shown below is a portion of a computer output for a regression analysis relating Y (dependent variable) and X
(independent variable).
ANOVA
df
SS
Regression
1
115.064
Residual
13
82.936
Total
Coefficients
Standard Error
Intercept
15.532
1.457
x
-1.106
0.261
a.
Perform a t test using the p-value approach and determine whether or not Y and X are related.
Let α = 0.05.
b.
Using the p-value approach, perform an F test and determine whether or not X and Y are
related.
c.
Compute the coefficient of determination and fully interpret its meaning. Be very specific.
Regression Statistics
Multiple R
0.7623
R Square
0.5811
Standard Error
2.5258
Observations
15
Chapter 12 – Simple Linear Regression
110. Part of an Excel output relating X (independent variable) and Y (dependent variable) is shown below. Fill in all the
blanks marked with “?”.
Summary Output
Regression Statistics
Multiple R
?
R Square
0.5149
Adjusted R Square
?
Standard Error
7.3413
Observations
11
ANOVA
df
SS
MS
F
Significance F
Regression
?
?
?
?
0.0129
Residual
?
?
?
Total
?
1000.0000
Coefficients
Standard Error
t Stat
P-value
Intercept
?
29.4818
3.7946
0.0043
x
?
0.7000
-3.0911
0.0129
Summary Output
Regression Statistics
Multiple R
0.7176
R Square
0.5149
Adjusted R Square
0.4611
Standard Error
7.3413
Observations
11
ANOVA
df
SS
MS
F
Significance F
Regression
1
514.9455
514.9455
9.5546
0.0129
Residual
9
485.0545
53.8949
Total
10
1000.0000
Coefficients
Standard Error
t Stat
P-value
Intercept
111.8727
29.4818
3.7946
0.0043
x
-2.1636
0.7000
-3.0911
0.0129
1
ANOVA
df
SS
MS
F
Significance F
Regression
1
115.064
115.064
18.036
0.001
Residual
13
82.936
6.380
Total
14
198
Coefficients
Standard Error
t Stat
P-value
Intercept
15.532
1.457
10.662
0.000
x
-1.106
0.261
-4.247
0.001
58.11% of the variability in Y is explained by the variability in X.
1
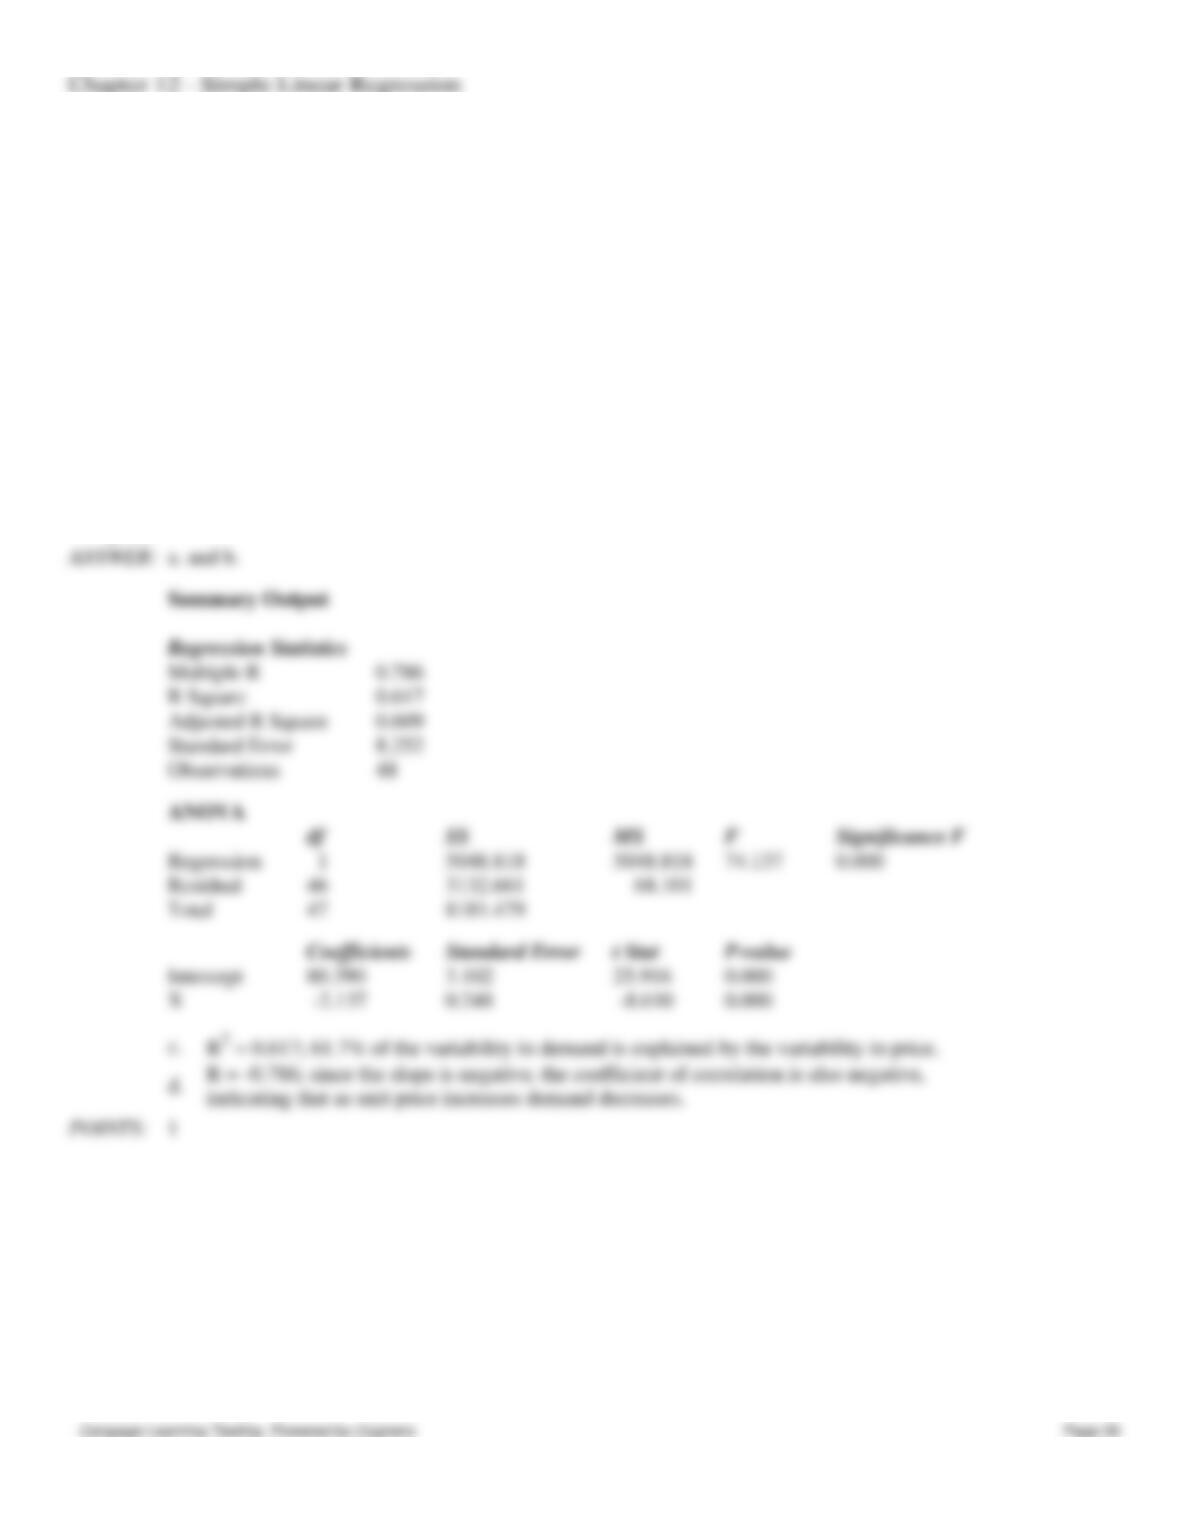
111. Shown below is a portion of a computer output for a regression analysis relating Y (demand) and X (unit price).
ANOVA
df
SS
Regression
1
5048.818
Residual
46
3132.661
Total
47
8181.479
Coefficients
Standard Error
Intercept
80.390
3.102
X
-2.137
0.248
a.
Perform a t test and determine whether or not demand and unit price are related. Let α = 0.05.
b.
Perform an F test and determine whether or not demand and unit price are related. Let α =
0.05.
c.
Compute the coefficient of determination and fully interpret its meaning. Be very specific.
d.
Compute the coefficient of correlation and explain the relationship between demand and unit
price.
Regression Statistics
Multiple R
0.786
R Square
0.617
Adjusted R Square
0.609
Standard Error
8.252
Observations
48
ANOVA
df
SS
F
Significance F
Regression
1
5048.818
5048.818
74.137
0.000
Residual
46
3132.661
68.101
Total
47
8181.479
Coefficients
Standard Error
t Stat
P-value
Intercept
80.390
3.102
25.916
0.000
X
-2.137
0.248
-8.610
0.000
d.
R = -0.786; since the slope is negative, the coefficient of correlation is also negative,
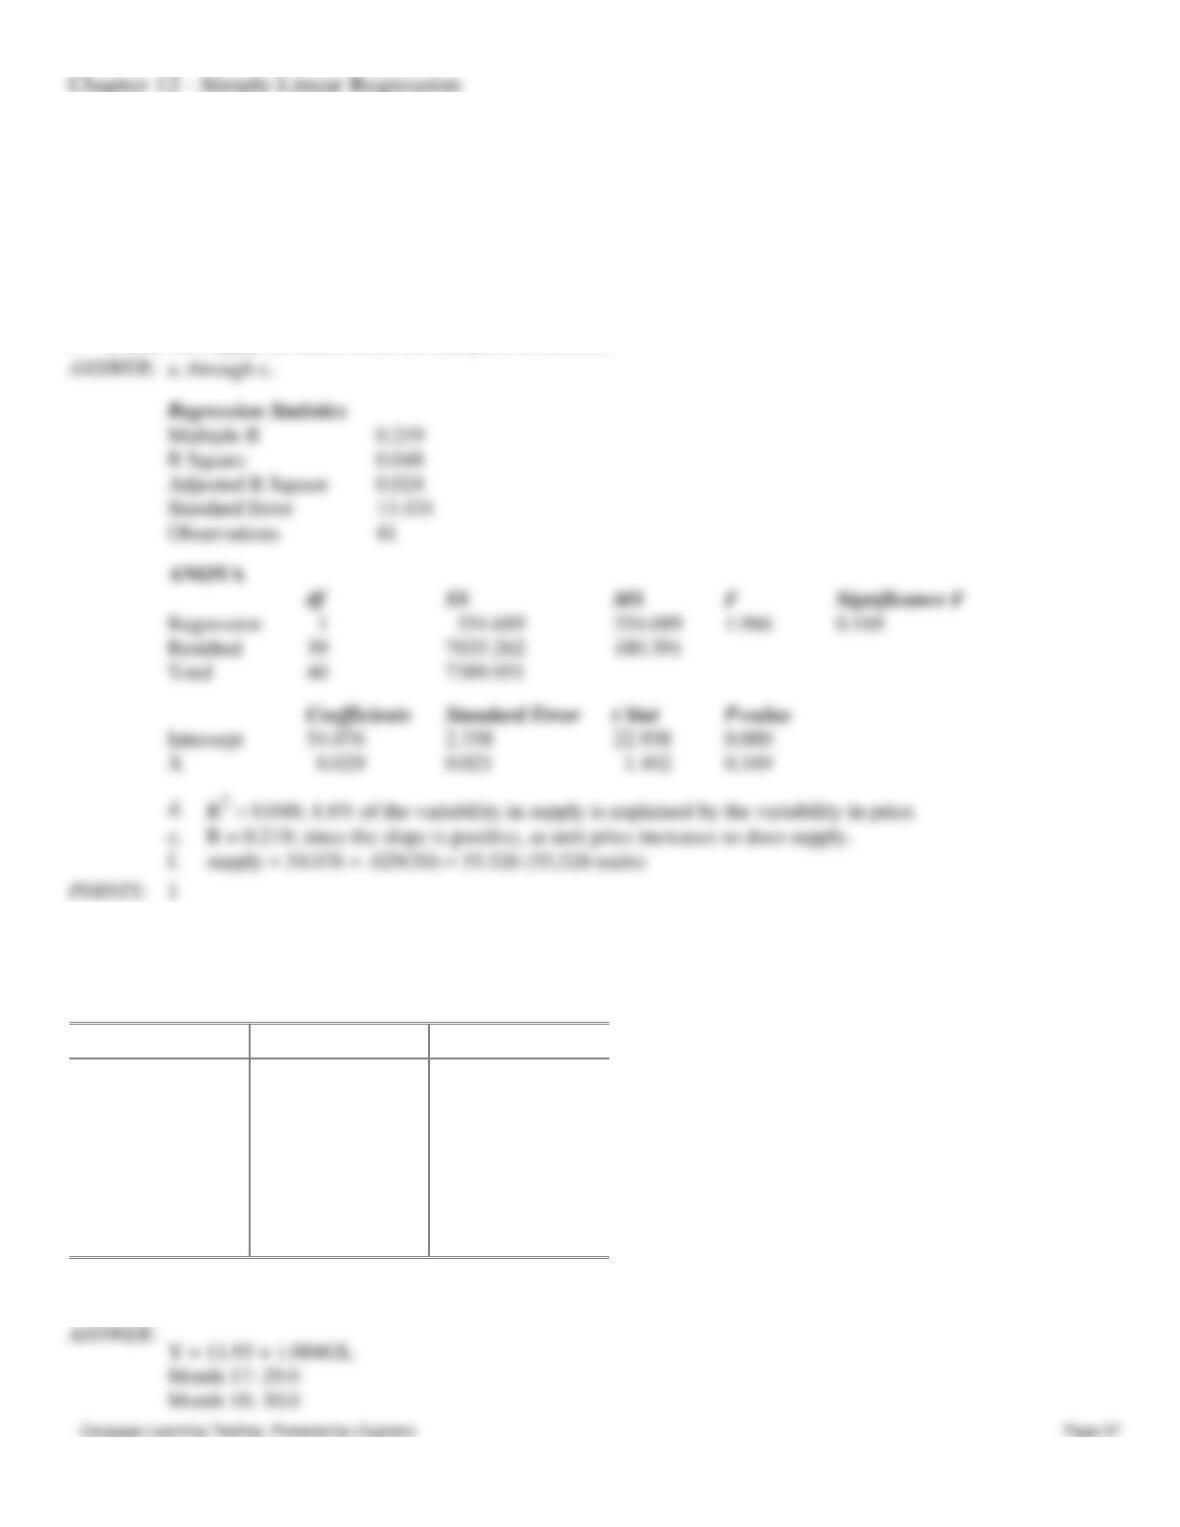
112. Shown below is a portion of a computer output for a regression analysis relating supply (Y in thousands of units) and
unit price (X in thousands of dollars).
ANOVA
df
SS
Regression
1
354.689
Residual
39
7035.262
Coefficients
Standard Error
Intercept
54.076
2.358
X
0.029
0.021
a.
What has been the sample size for this problem?
b.
Perform a t test and determine whether or not supply and unit price are related. Let α = 0.05.
c.
Perform and F test and determine whether or not supply and unit price are related. Let α =
0.05.
d.
Compute the coefficient of determination and fully interpret its meaning. Be very specific.
e.
Compute the coefficient of correlation and explain the relationship between supply and unit
price.
f.
Predict the supply (in units) when the unit price is $50,000.
Multiple R
0.219
R Square
0.048
Adjusted R Square
0.024
Standard Error
13.431
Observations
41
Regression
1
354.689
354.689
1.966
0.169
Residual
39
7035.262
180.391
Total
40
7389.951
Intercept
54.076
2.358
22.938
0.000
X
0.029
0.021
1.402
0.169
e.
R = 0.219; since the slope is positive, as unit price increases so does supply.
f.
supply = 54.076 + .029(50) = 55.526 (55,526 units)
1
113. Coyote Cable has been experiencing an increase in cable service subscribers in recent months due to increased
advertising and an influx of new residents to the region. The number of subscribers (in 1000’s) for the last 16 months are
as follows:
Month
Sales
Month
Sales
Month
Sales
1
12.8
7
20.6
12
23.8
2
14.6
8
18.5
13
25.1
3
15.2
9
19.9
14
24.7
4
16.1
10
23.6
15
26.5
5
15.8
11
24.2
16
28.9
6
17.2
Using simple linear regression, forecast the number of subscribers for months 17, 18, 19, and 20.
Month 18: 30.0