
Chapter 14 – Time Series Analysis and Forecasting
Multiple Choice
1. Common types of data patterns that can be identified when examining a time series plot include all of the following
except
a.
horizontal
b.
vertical
c.
seasonal
d.
cyclical
b
1
2. Given an actual demand of 61, forecast of 58, and an α of .3, what would the forecast for the next period be using
simple exponential smoothing?
a.
57.1
b.
58.9
c.
61.0
d.
65.5
b
1
3. Which of the following smoothing constants would make an exponential smoothing forecast equivalent to a naive
forecast?
a.
0
b.
1 divided by the number of periods
c.
0.5
d.
1.0
d
1
4. The time series pattern showing an alternating sequence of points below and above the trend line lasting more than one
year is the
a.
trend pattern
b.
seasonal patern
c.
trend and seasonal pattern
d.
cyclical pattern
d
1
5. The time series pattern that reflects repeating variability within a single year is called the
a.
trend pattern
b.
seasonal pattern
c.
trend and seasonal pattern
d.
cyclical pattern
b
1

6. The time series pattern that exists when the data fluctuate around a constant mean is the
a.
horizontal pattern
b.
trend pattern
c.
seasonal pattern
d.
cyclical pattern
a
1
7. The time series pattern that reflects a gradual shift or movement to a relatively higher or lower level over a longer time
period is called the
a.
trend pattern
b.
seasonal pattern
c.
cyclical pattern
d.
trend and seasonal pattern
a
1
8. The trend pattern is easy to identify by using
a.
moving averages
b.
exponential smoothing
c.
regression analysis
d.
the Delphi approach
c
1
9. The forecasting method that is appropriate when the time series has no significant trend, cyclical, or seasonal effect is
a.
moving averages
b.
mean squared error
c.
mean average deviation
d.
qualitative forecasting methods
a
1
10. If data for a time series analysis is collected on an annual basis only, which pattern can be ignored?
a.
trend
b.
seasonal
c.
cyclical
d.
horizontal
b
1
11. For the following time series, you are given the moving average forecast.
Time Period
Time Series Value
Moving Average Forecast
1
23
—
2
17
—

Chapter 14 – Time Series Analysis and Forecasting
3
17
—
4
26
19
5
11
20
6
23
18
7
17
20
The mean squared error equals
a.
6
b.
36
c.
41
d.
144
c
1
12. Below you are given the first four values of a time series.
Time Period
Time Series Value
1
18
2
20
3
25
4
17
Using a 4-period moving average, the forecast value for period 5 is
a.
2.5
b.
17
c.
20
d.
10
c
1
13. Below you are given the first two values of a time series. You are also given the first two values of the exponential
smoothing forecast.
Time Period (t)
Time Series Value (Yt)
Exponential Smoothing
Forecast (Ft)
1
18
18
2
22
18
If the smoothing constant equals .3, then the exponential smoothing forecast for time period three is
a.
18
b.
19.2
c.
20
d.
40
b
1
14. The following linear trend expression was estimated using a time series with 17 time periods.
Tt = 129.2 + 3.8t
The trend projection for time period 18 is

Chapter 14 – Time Series Analysis and Forecasting
a.
68.4
b.
193.8
c.
197.6
d.
6.84
c
1
15. Below you are given some values of a time series consisting of 26 time periods.
Time Period
Time Series Value
1
37
2
48
3
50
4
63
.
.
.
23
105
24
107
25
112
26
114
The estimated regression equation for these data is
Yt = 16.23 + .52Yt-1 + .37Yt-2
The forecasted value for time period 27 is
a.
53.23
b.
109.5
c.
116.65
d.
116.95
d
1
16. A group of observations measured at successive time intervals is known as
a.
a trend component
b.
a time series
c.
a forecast
d.
an additive time series model
b
1
17. A component of the time series model that results in the multi-period above-trend and below-trend behavior of a time
series is
a.
a trend component
b.
a cyclical component
c.
a seasonal component
d.
an irregular component
b
18. The model that assumes that the actual time series value is the product of its components is the
a.
linear trend regression model
b.
multiplicative decomposition model
c.
additive time series model
d.
weighted moving average model
19. A method of removing the combined seasonal and irregular effects, leaving a time series containing only trend is
a.
moving average
b.
seasonal indexing
c.
exponential smoothing
d.
additive decomposition
a
20. A method that uses a weighted average of past values for arriving at smoothed time series values is known as
a.
regression analysis
b.
deseasonalization
c.
decomposition
d.
exponential smoothing
21. In the linear trend equation Tt = b0 + b1t, b1 represents the
a.
trend value in period t
b.
intercept of the trend line
c.
slope of the trend line
d.
point in time
c
22. In the linear trend equation, T = b0 + b1t, b0 represents the
a.
time
b.
slope of the trend line
c.
trend value in period 1
d.
the Y intercept
23. A parameter of the exponential smoothing model which provides the weight given to the most recent time series value
in the calculation of the forecast value is known as the
a.
mean square error

Chapter 14 – Time Series Analysis and Forecasting
b.
mean absolute deviation
c.
smoothing constant
d.
None of these alternatives is correct.
24. One measure of the accuracy of a forecasting model is
a.
the smoothing constant
b.
a deseasonalized time series
c.
the mean squared error
d.
None of these alternatives is correct.
25. All of the following are true about qualitative forecasting methods except
a.
they generally involve the use of expert judgment to develop forecasts
b.
they assume the pattern of the past will continue into the future
c.
they are appropriate when past data on the variable being forecast are not applicable
d.
they are appropriate when past data on the variable being forecast are not available
26. The forecasting method that is appropriate when the time series has no significant trend, cyclical, or seasonal effect is
a.
moving averages
b.
mean squared error
c.
mean average deviation
d.
qualitative forecasting methods
27. One measure of the accuracy of a forecasting model is the
a.
smoothing constant
b.
trend pattern
c.
mean absolute error
d.
seasonal index
28. Which of the following forecasting methods puts the least weight on the most recent time series value?
a.
exponential smoothing with α = .3
b.
exponential smoothing with α = .2
c.
moving average using the most recent 4 periods
d.
moving average using the most recent 3 periods

29. Using exponential smoothing, the demand forecast for time period 10 equals the demand forecast for time period 9
plus
a.
α times (the demand forecast for time period 8)
b.
α times (the error in the demand forecast for time period 9)
c.
α times (the observed demand in time period 9)
d.
α times (the demand forecast for time period 9)
b
1
30. Gradual shifting or movement of a time series to relatively higher or lower values over a longer period of time is
called
a.
periodicity
b.
elasticity
c.
regression
d.
trend
d
1
Exhibit 14-1
Below you are given the first five values of a quarterly time series. The multiplicative model is appropriate and a four–
quarter centered moving average will be used.
Year
Quarter
Time Series Value Yt
1
1
36
2
24
3
16
2
4
20
1
44
31. Refer to Exhibit 14–1. An estimate of the trend component for Quarter 3 of Year 1 is
a.
24
b.
25
c.
26
d.
28
b
1
32. Refer to Exhibit 14–1. An estimate of the seasonal component for Quarter 3 of Year 1 is
a.
.64
b.
1.5625
c.
5.333
d.
30
a
1

Chapter 14 – Time Series Analysis and Forecasting
Exhibit 14-2
Consider the following time series.
t
1
2
3
4
Yi
4
7
9
10
33. Refer to Exhibit 14–2. The slope of linear trend equation, b1, is
a.
2.5
b.
2.0
c.
1.0
d.
1.25
b
1
34. Refer to Exhibit 14–2. The intercept, b0, is
a.
2.5
b.
2.0
c.
1.0
d.
1.25
a
1
35. Refer to Exhibit 14–2. The forecast for period 5 is
a.
10.0
b.
2.5
c.
12.5
d.
4.5
c
1
36. Refer to Exhibit 14–2. The forecast for period 10 is
a.
10.0
b.
25.0
c.
30.0
d.
22.5
d
1
Exhibit 14-3
Consider the following time series.
Year (t)
Yi
1
7
2
5
3
4
4
2

Chapter 14 – Time Series Analysis and Forecasting
5
1
37. Refer to Exhibit 14–3. The slope of linear trend equation, b1, is
a.
-1.5
b.
+1.5
c.
8.3
d.
-8.3
a
1
38. Refer to Exhibit 14–3. The intercept, b0, is
a.
-1.5
b.
+1.5
c.
8.3
d.
-8.3
c
1
39. Refer to Exhibit 14–3. In which time period does the value of Yi reach zero?
a.
0.000
b.
0.181
c.
5.53
d.
4.21
c
1
40. Refer to Exhibit 14–3. The forecast for period 10 is
a.
6.7
b.
-6.7
c.
23.3
d.
15
b
1
41. A seasonal pattern
a.
can occur within a day
b.
can take more than a year to repeat itself
c.
is a multi-year run of observations above and below the trend line
d.
reflects a shift in the time series over time
a
1
42. The objective of smoothing methods is to smooth out
a.
long range forecasts
b.
wide seasonal variations

Chapter 14 – Time Series Analysis and Forecasting
c.
significant trend effects
d.
random fluctuations
43. All of the following are true about time series methods except
a.
they discover a pattern in historical data and project it into the future
b.
they identify a set of related independent, or explanatory, variables
c.
they assume that the pattern of the past will continue into the future
d.
their forecasts are based solely on past values of the variable or past forecast errors
44. All of the following are true about a cyclical pattern except
a.
it is often due to multi-year business cycles
b.
it is often combined with long-term trend patterns and called trend-cycle patterns
c.
it is an alternating sequence of data points above and below the trend line
d.
it is usually easier to forecast than a seasonal pattern due to less variability
45. All of the following are true about a stationary time series except
a.
its statistical properties are independent of time
b.
a plot of the time series will always exhibit a horizontal pattern
c.
the process generating the data has a constant mean
d.
there is no variability in the time series over time
46. In situations where you need to compare forecasting methods for different time periods, the most appropriate accuracy
measure is
a.
mean error
b.
mean absolute error
c.
mean squared error
d.
mean absolute percentage error
Exhibit 14-4
The Espresso Cart has had the following pattern of espresso sales over the last two weeks:
Week 1 Week 2
Monday 873 Monday 912
Tuesday 904 Tuesday 859
Wednesday 911 Wednesday 906
Thursday 887 Thursday 900
Friday 899 Friday ?
47. Refer to Exhibit 14–4. What is the forecast for Friday’s sales using a three-day moving average?
a.
876.33
b.
888.33
c.
892.33
d.
893.33
48. Refer to Exhibit 14–4. What is the forecast for Friday’s sales using a 3-day weighted moving average with weights of
.5 (for newest), .3, and .2 (for oldest)?
a.
881.3
b.
889.4
c.
893.6
d.
894.7
c
Exhibit 14-5
State Division of Motor Vehicles (DMV) statistics show the rate of new driver’s license applications to be as shown
below:
Month Week Applications
April 1 238
2 199
3 215
4 212
May 1 207
2 211
3 196
4 206
49. Refer to Exhibit 14–5. Using a 3-week moving average, what is the forecast for the 1st week in April?
a.
201.00
b.
204.33
c.
206.00
d.
217.33
50. Refer to Exhibit 14–5. Using a 5-week moving average, what is the forecast for the first week in April?
a.
198.45
b.
200.20
c.
202.83
d.
206.40

51. Refer to Exhibit 14–5. Using weights of .4, .3, .2, and .1, what is the 4-week weighted moving average forecast for
April, week 1?
a.
204.1
b.
210.8
c.
208.4
d.
206.4
a
52. Refer to Exhibit 14–5. Using weights of .6, .3, and .1, what is the 3-week weighted moving average forecast for April,
week 1
a.
203.5
b.
207.2
c.
209.3
d.
212.9
a
53. The term exponential smoothing comes from
a.
its emphasis on minimizing mean squared error
b.
the exponential nature of the weighting scheme used
c.
its use in fitting exponential trend lines
d.
the nonlinear noise it attempts to remove
54. The forecasting model that makes use of the “least squares” method is
a.
weighted moving average
b.
exponential smoothing
c.
moving average
d.
regression
55. Regarding a regression model, all of the following can be negative except the
a.
coefficient of determination
b.
correlation coefficient
c.
coefficient of “x” in the regression equation
d.
y-intercept in the regression equation
a
56. To calculate an exponential smoothing forecast of demand, what values are required?
a.
alpha, number of periods, last actual demand
Chapter 14 – Time Series Analysis and Forecasting
b.
alpha, last forecast, number of periods
c.
alpha, last forecast, last actual demand
d.
last forecast, number of periods, averaging period
c
57. You are given the following information on the seasonal-irregular component values for a quarterly time series.
Seasonal-Irregular
Quarter Component Values (StIt)
1 1.23, 1.15, 1.16
2 0.86, 0.89, 0.83
3 0.77, 0.72, 0.79
4 1.20, 1.13, 1.17
The seasonal index for Quarter 1 is
a.
1.02
b.
1.18
c.
3.54
d.
4.06
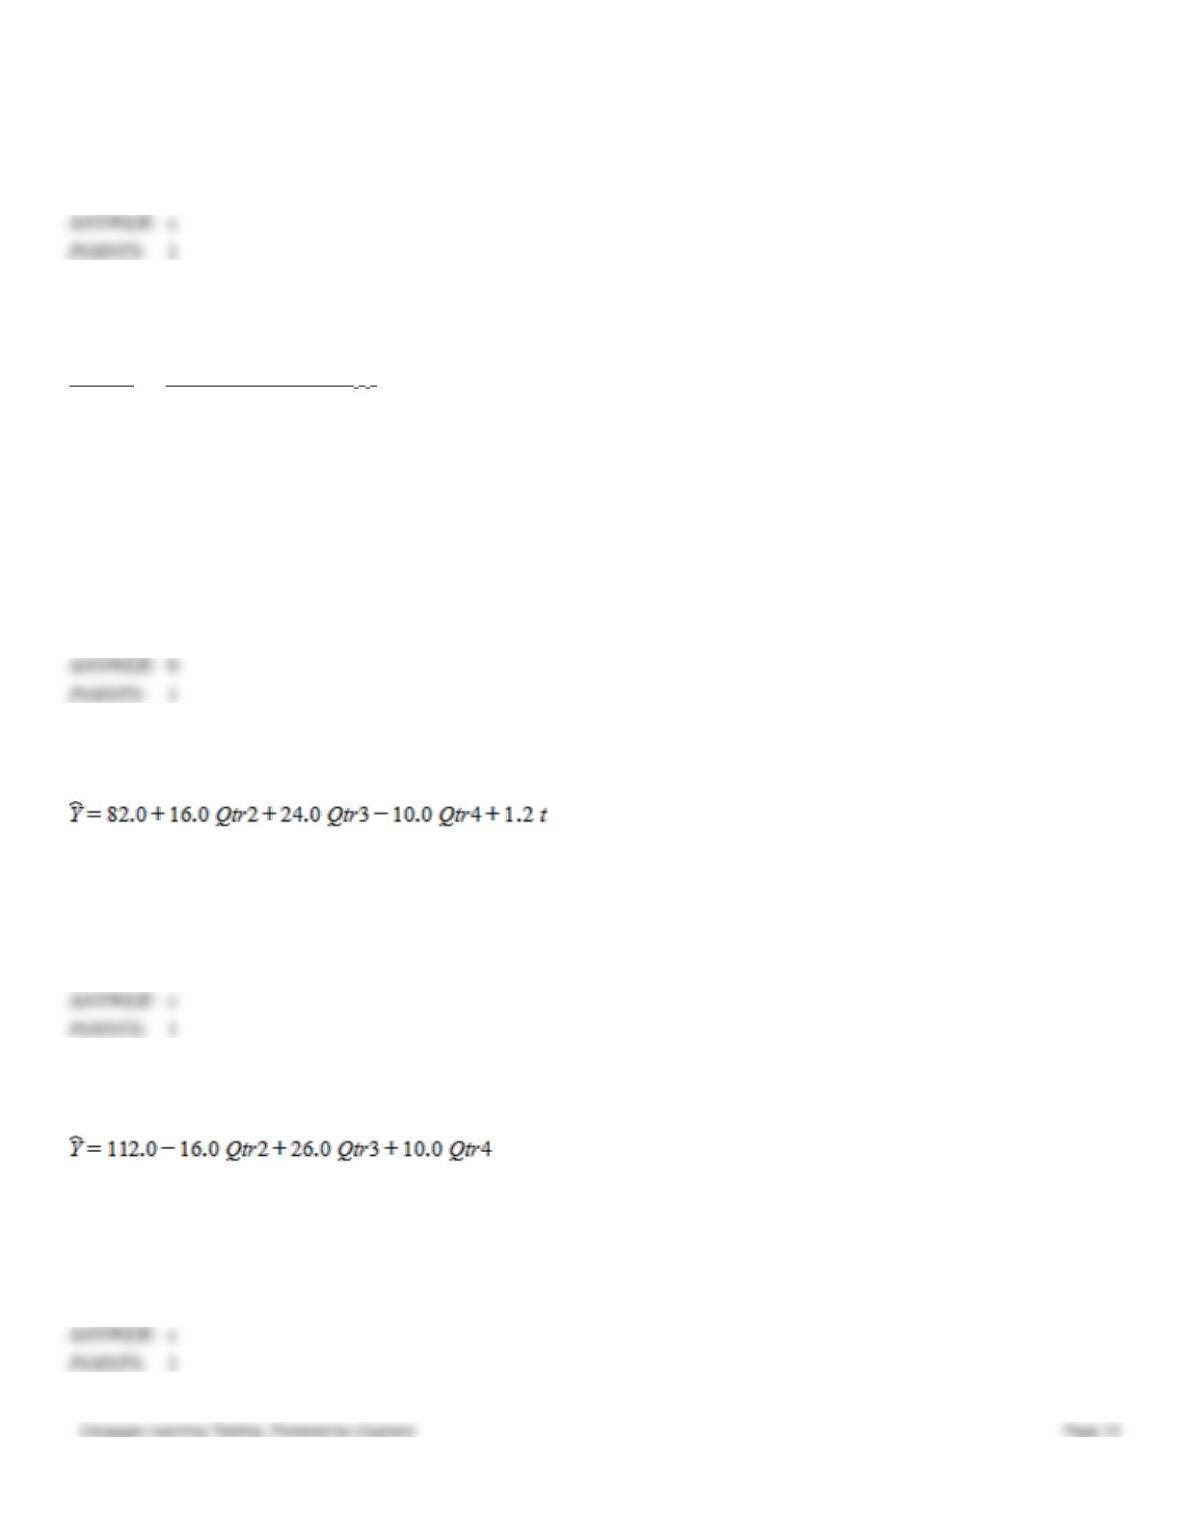
58. Regression analysis was performed on a time series containing 5 years of quarterly sales. The sales data contains both
trend and seasonal effects. The following estimated regression equation was obtained.
The sales forecast for Quarter 2 of Year 6 is
a.
100.4
b.
116.4
c.
124.4
d.
140.0
c
59. Regression analysis was performed on a time series containing 4 years of quarterly sales. The sales data contains a
seasonal effect, but no trend. The following estimated regression equation was obtained.
The sales forecasts for Quarters 1 and 2 of Year 5 are
a.
96, 80
b.
112, 80
c.
112, 96
d.
132, 116