Unlock document.
This document is partially blurred.
Unlock all pages and 1 million more documents.
Get Access
Chapter 15
Statistical Methods for Quality Control
Learning Objectives
1. Learn about the importance of total quality, quality control, and how statistical methods can assist in
the quality control process.
2. Be able to construct quality control charts and understand how they are used for statistical process
control.
3. Learn about acceptance sampling procedures.
4. Know the difference between consumer’s risk and producer’s risk.
5. Know what is meant by multiple sampling plans.
6. Know the definitions of the following terms:
total quality
Six Sigma
assignable causes
common causes
control charts
upper control limit (UCL)
lower control limit (LCL)
x
chart
R chart
p chart
np chart
lot
acceptance sampling
producer’s risk
consumer’s risk
acceptance criterion
operating characteristic (OC) curve
multiple sampling plan
1. a. For n = 4
UCL =
+ 3(
/
n
) = 12.5 + 3(.8 /
4
) = 13.7
LCL =
- 3(
/
n
) = 12.5 - 3(.8 /
4
) = 11.3
b. For n = 8
UCL =
+ 3(.8 /
8
) = 13.35
LCL =
- 3(.8 /
8
) = 11.65
c. UCL and LCL become closer together as n increases. If the process is in control, the larger samples
should have less variance and should fall closer to 12.5.
2. a.
= =
6775
25 5542
.
( ) .
b. UCL =
+ 3(
/
n
) = 5.42 + 3(.5 /
5
) = 6.09
3. a.
p= =
135
25 100 00540
( ) .
b.
p
p p
n
=−= =
( ) . ( . ) .
1 00540 09460
100 00226
UCL =
RD4
= 1.6(1.864) = 2.98
LCL =
RD3
= 1.6(0.136) = 0.22
x
Chart:
b.
x x n
i
= = = /..
772 4
612873
in control
774 3
6129 05
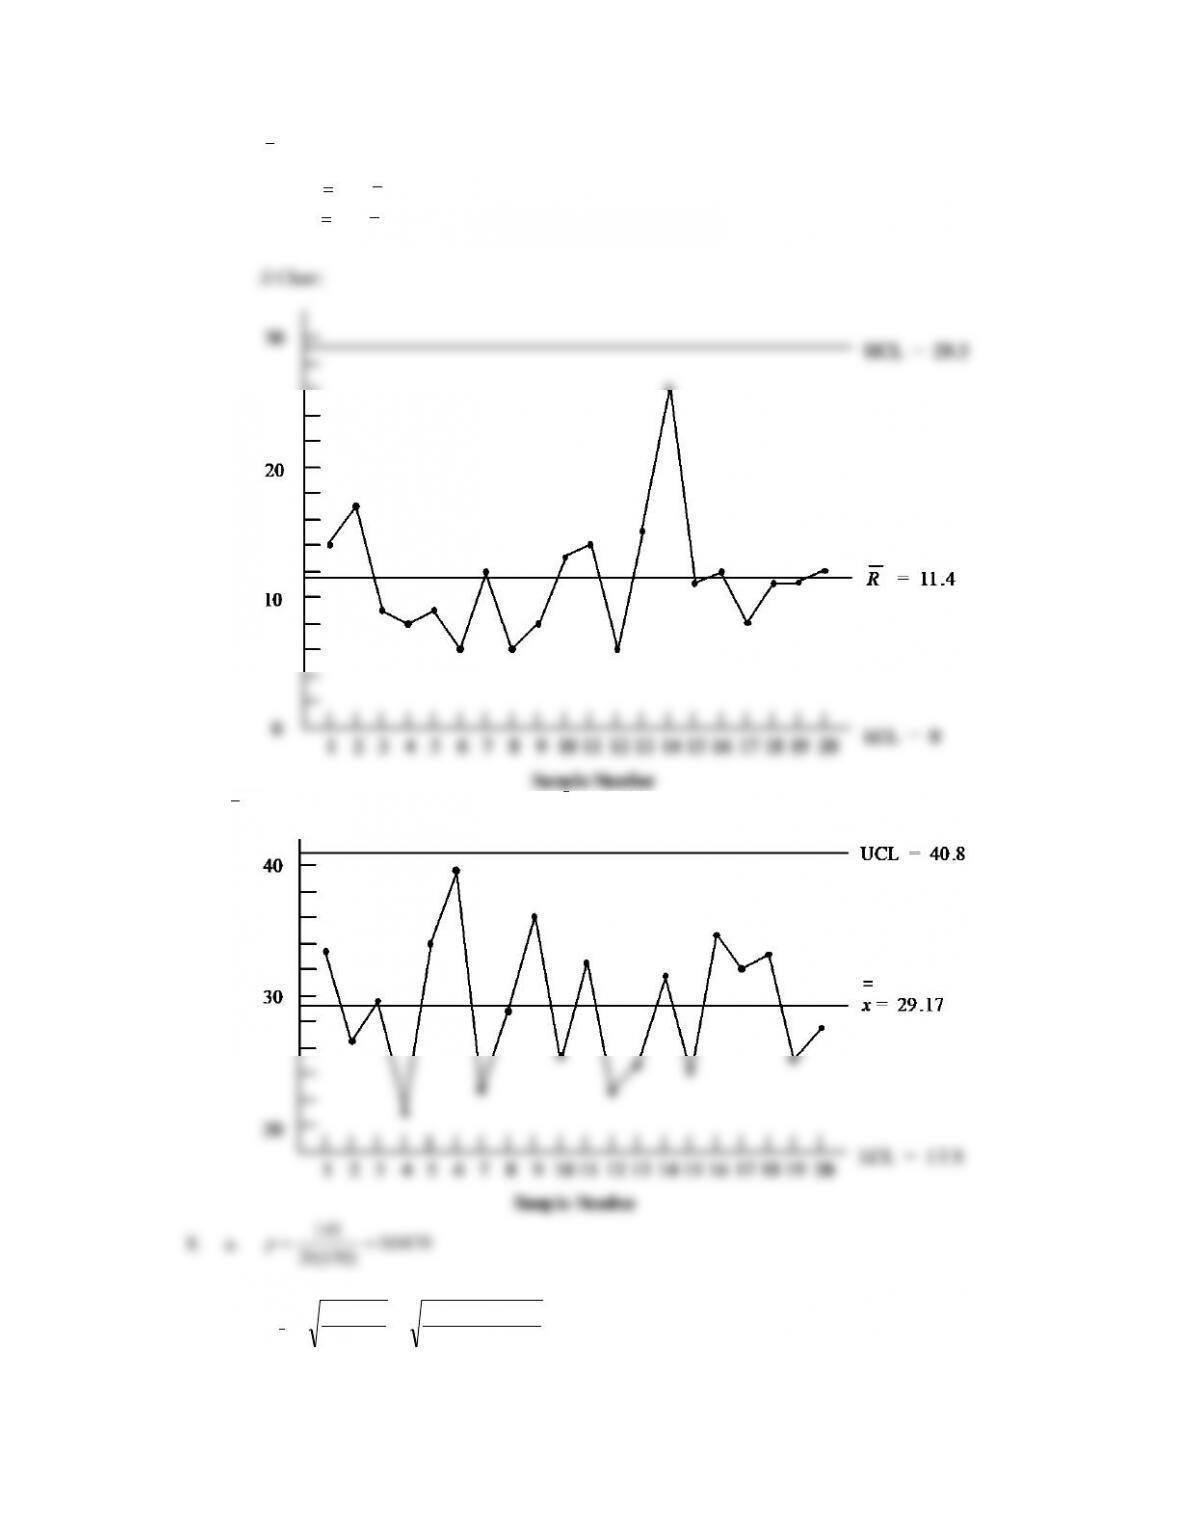
6. Process Mean =
2012 19 90
22001
. . .
+=
UCL =
+ 3(
/
n
) = 20.01 + 3(
/
5
) = 20.12
Solve for
:
=−=
( . . ) .
2012 2001 5
30082
x
Chart:
UCL =
2
x A R+
= 29.17 + 1.023(11.4) = 40.8
LCL =
2
x A R−
= 29.17 - 1.023(11.4) = 17.5
x
Chart:
20 150 00470
( ) .
b.
p
p p
n
=−= =
( ) . ( . ) .
1 00470 09530
150 00173
UCL = p + 3
p
= 0.0470 + 3(0.0173) = 0.0989
LCL = p - 3
p
= 0.0470 -3(0.0173) = -0.0049
Use LCL = 0
c.
p= =
12
150 008.
Thus, the process is out of control if more than 14 defective packages are found in a sample of 150.
e. Process should be considered to be in control since 12 defective packages were found.
f. The np chart may be preferred because a decision can be made by simply counting the number of
defective packages.
41 41 .041
10(100) 1000
b.
(1 ) .041(.959) .0198
100
p
pp
n
−
= = =
UCL 3 .041 3(.0198) .1004
LCL 3 .041 3(.0198) .0184
p
p
p
p
= + = + =
= − = − = −
Use LCL = 0.
12 .12
100
Since .12 > UCL, the system is out of control.
d. p = .041 n = 100
UCL 3 (1 ) 100(.041) 3 100(.041)(.959) 10.049
LCL 3 (1 ) 100(.041) 3 100(.041)(.959) 1.849
np np p
np np p
= + − = + =
= − − = − = −
Use LCL = 0.
e. The process is out of control since 12 > UCL.
x n x
)!( . ) ( . ) .0 25
0!(25 0002 1 002 06035
When p = .06, the probability of accepting the lot is
f( ) !
)!( . ) ( . ) .0 25
0!(25 0006 1 006 02129
025
=−− =
Producer’s risk:
= 1 - .2901 = .7099
12. At p0 = .02, the n = 20 and c = 1 plan provides
P (Accept lot) = f (0) + f (1) = .6676 + .2725 = .9401
Producer’s risk:
= 1 - .9401 = .0599
P (Accept lot) = f (0) + f (1) = .2901 + .3703 = .6604
Producer’s risk:
= 1 - .6604 = .3396
For a given sample size, the producer’s risk decreases as the acceptance number c is increased.
13. a. Using binomial probabilities with n = 20 and p0 = .03.
P(Accept lot) = f (0) + f (1)
= .0388 + .1368 = .1756
Consumer’s risk:
= .1756
LCL = 350 - 3(15 /
20
) = 339.94
For n = 30
UCL = 350 + 3(15 /
30
) = 358.22
LCL = 350 - 3(15 /
30
) = 343.78
b. Both control limits come closer to the process mean as the sample size is increased.
probability of making a Type II error.
18. R Chart:
UCL =
RD4
= 2(2.115) = 4.23
LCL =
2
x A R−
= 5.42 - 0.577(2) = 4.27
Estimate of Standard Deviation:
..
= = =
R
d2
2
2326 086
19.
R
= 0.665
x
= 95.398
LCL =
RD3
= 0.665(0) = 0
The R chart indicated the process variability is in control. All sample ranges are within the control
limits. However, the process mean is out of control. Sample 11 (
x
= 95.80) and Sample 17 (
x
=94.82) fall outside the control limits.
20.
R
= .053
x
= 3.082
UCL =
RD4
= 0.053(2.115) = 0.1121
LCL =
RD3
= 0.053(0) = 0
All sample averages and sample ranges are within the control limits for both charts.
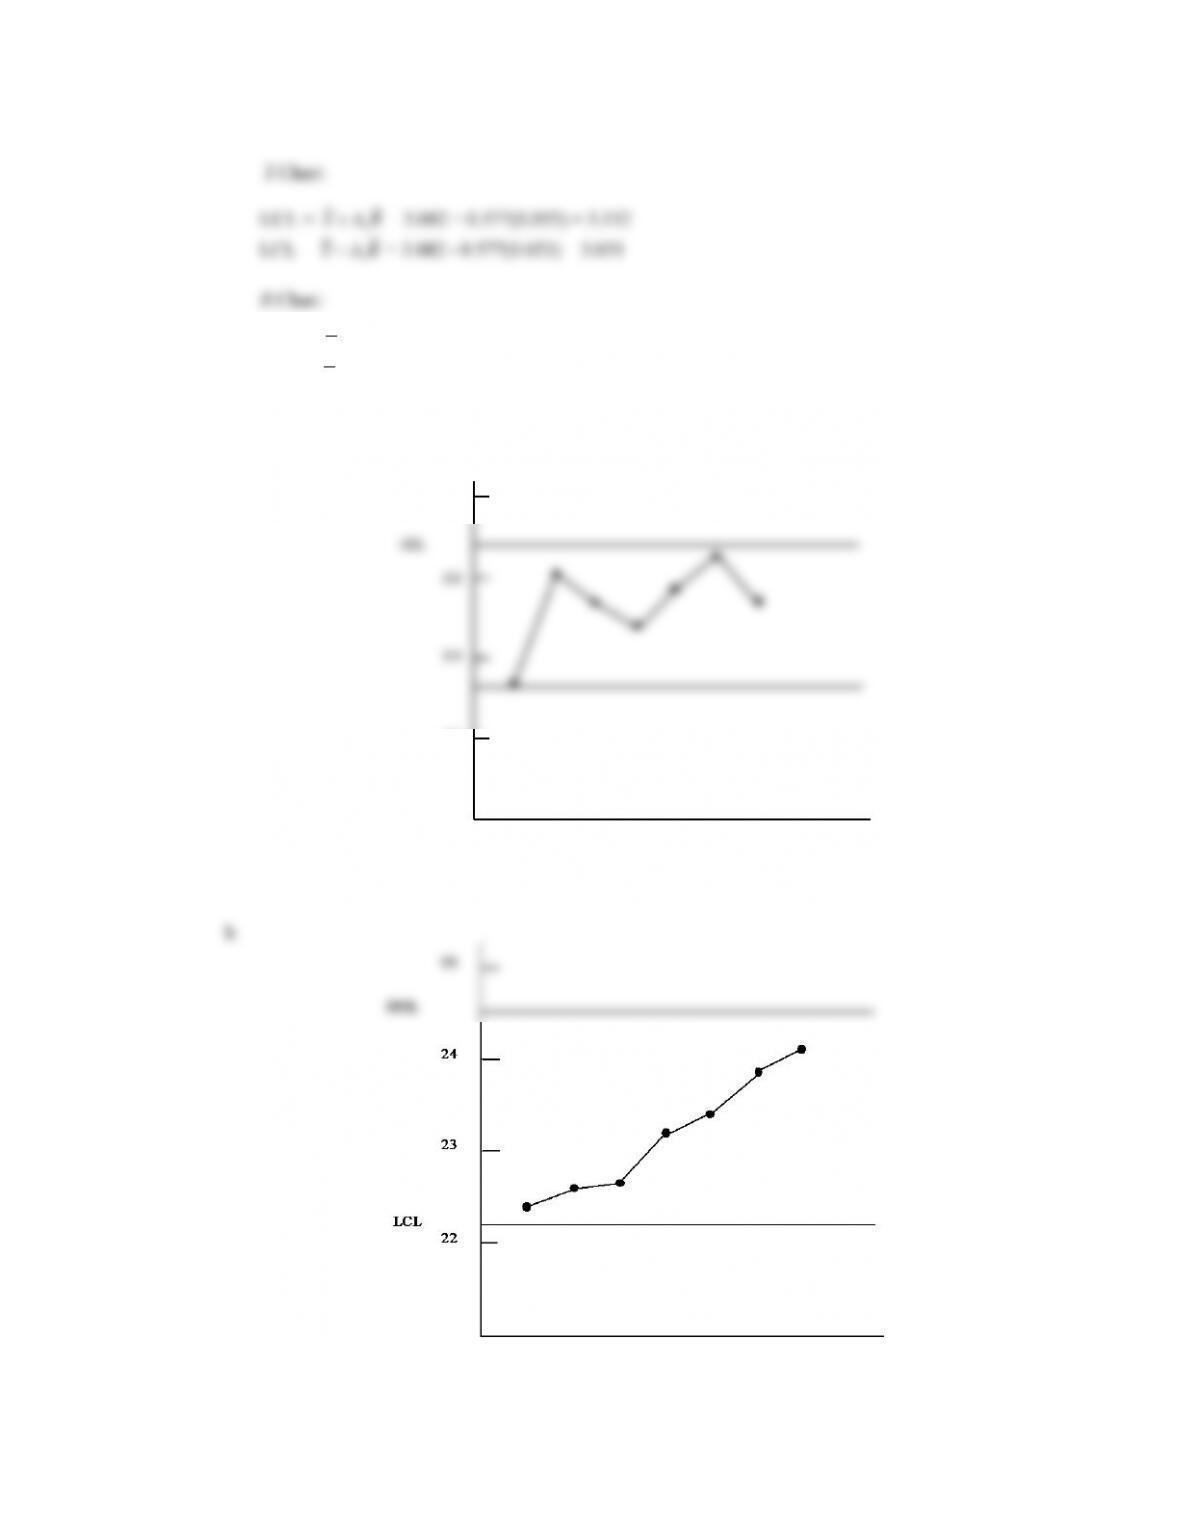
21. a.
Warning: Process should be checked. All points are within control limits; however, all points are also
greater than the process proportion defective.
LCL
UCL
0
.0 2
.0 4
.0 6
.0 8
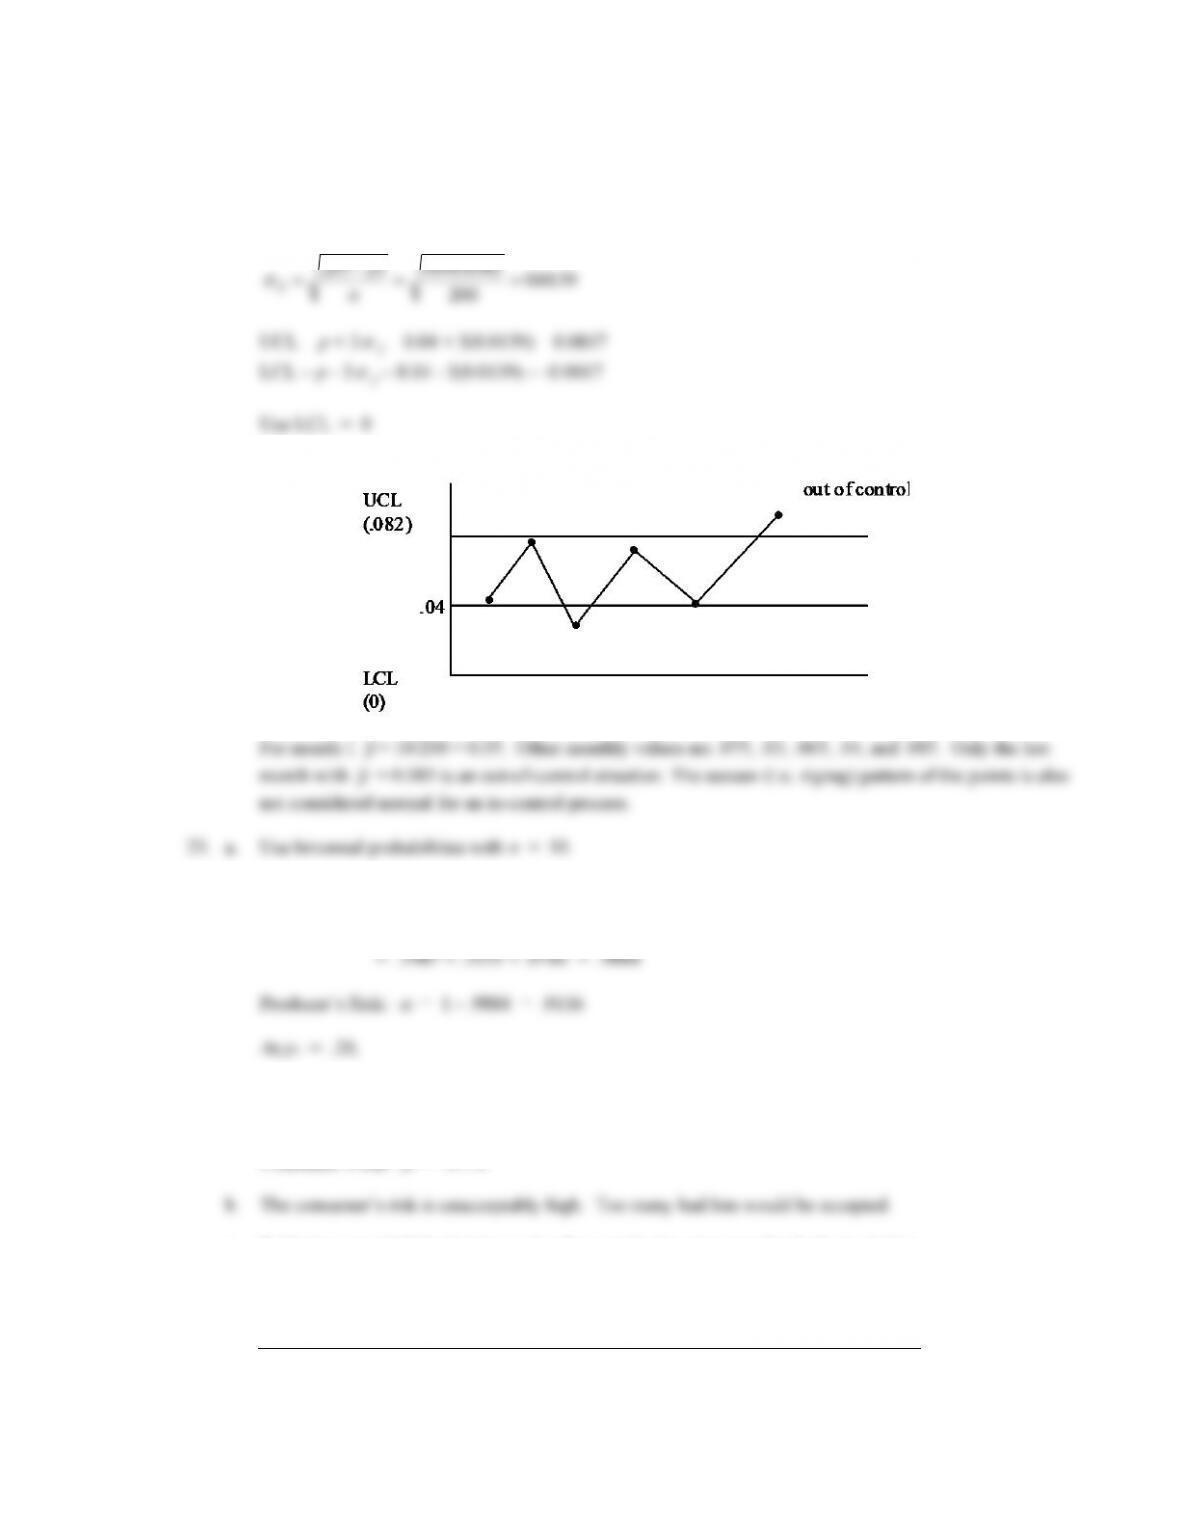
Warning: Process should be checked. All points are within control limits yet the trend in points show a
movement or shift toward UCL out–of–control point.
22. a. p = .04
p p
( ) . ( . ) .
1 004 096
b.
At p0 = .05,
P(Accept lot) = f (0) + f (1) + f (2)
P(Accept lot) = f (0) + f (1) + f (2)
= .1074 + .2684 + .3020 = .6778
Consumer’s risk:
= .6778
c. Reducing c would help, but increasing the sample size appears to be the best solution.
24. a. P (Accept) are shown below: (Using n = 15)
p = .01
p = .02
p = .03
p = .04
p = .05
f (0)
.8601
.7386
.6333
.5421
.4633
f (1)
.1303
.2261
.2938
.3388
.3658
.9904
.9647
.9271
.8809
.8291
= 1 - P (Accept)
.0096
.0353
.0729
.1191
.1709
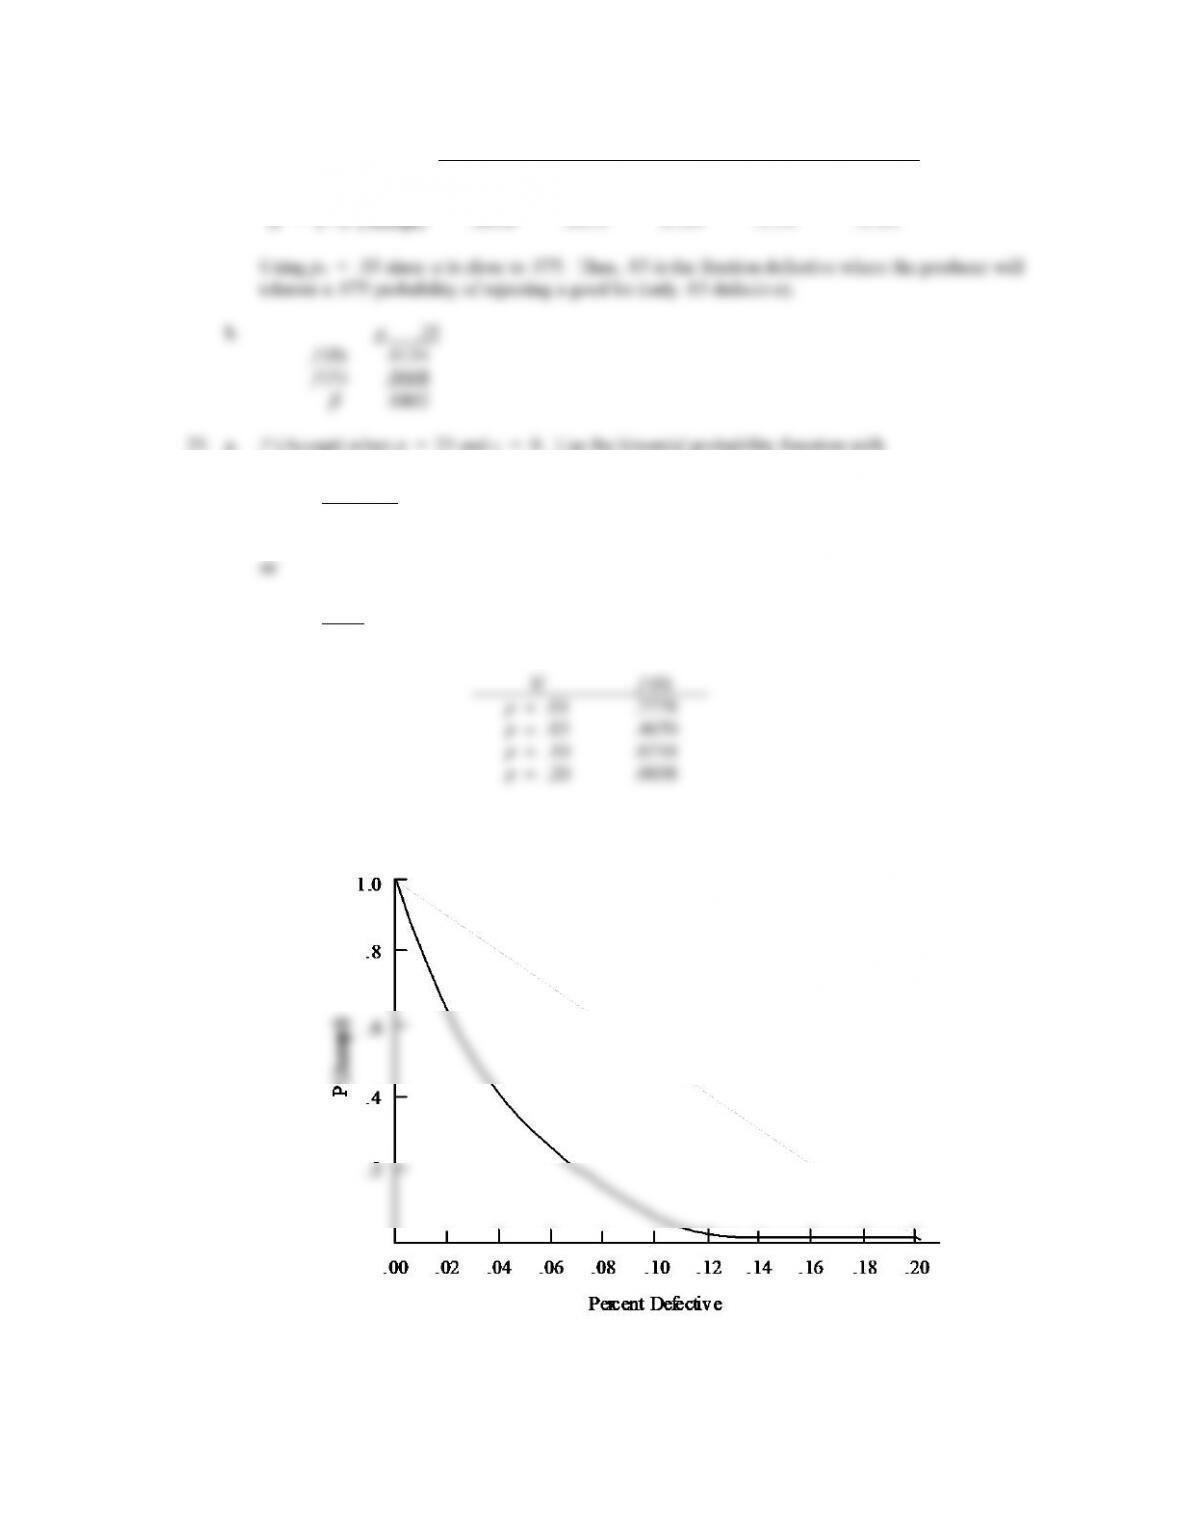
25. a. P (Accept) when n = 25 and c = 0. Use the binomial probability function with
f x n
x n x p p
x n x
( ) !
!( )! ( )=−−−
1
f p p p( ) !
!( ) ( )0 25
0!25 1 1
025 25
= − = −
If
f (0)
p = .01
.7778
p = .03
.4670
p = .10
.0718
p = .20
.0038
b.
c. 1 - f (0) = 1 - .778 = .222


