Chapter 10 – Comparisons Involving Means, Experimental Design, and Analysis of Variance
Between Treatments
_____?
_____?
_____?
3.0
Within Treatments (Error)
_____?
_____?
6
Total
_____?
_____?
a.
Fill in all the blanks in the above ANOVA table.
b.
At a 5% level of significance, test to see if there is a significant difference among the means.
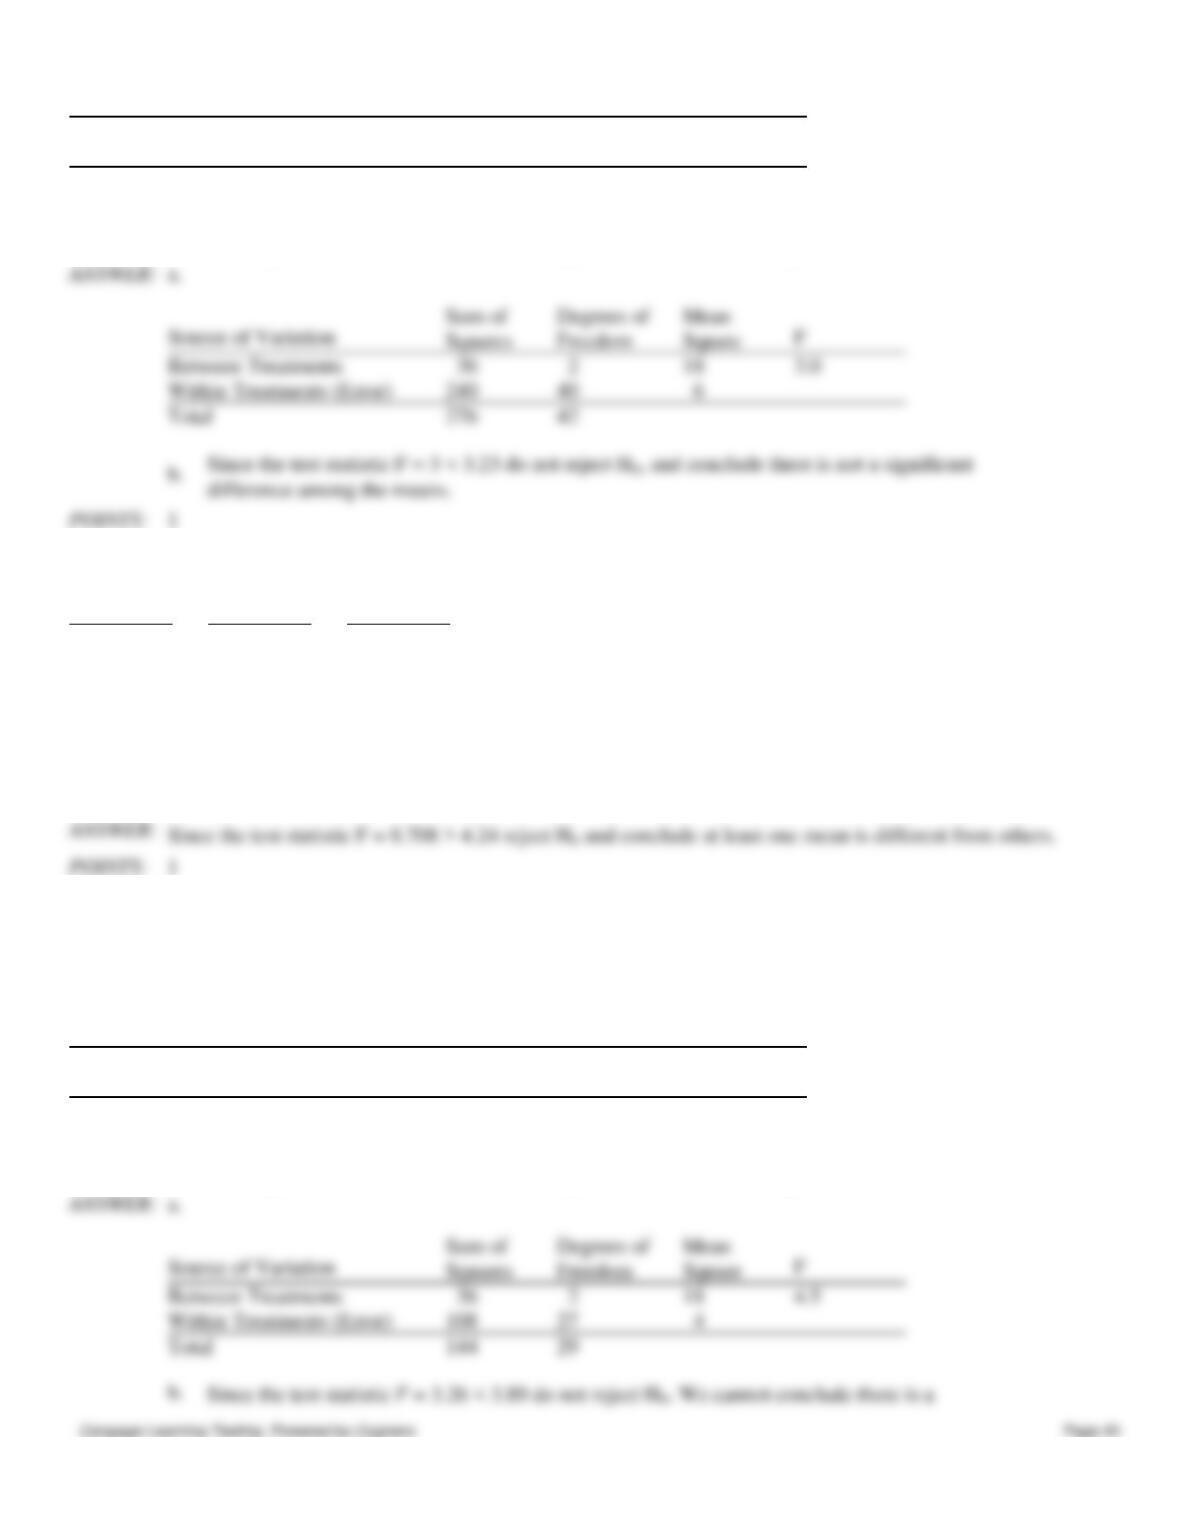
Between Treatments
18
3.0
Within Treatments (Error)
240
40
Total
276
42
1
158. Random samples were selected from three populations. The data obtained are shown below.
Treatment 1
Treatment 2
Treatment 3
37
43
28
33
39
32
36
35
33
38
38
40
At a 5% level of significance, test to see if there is a significant difference in the means of the three populations. (Please
note that the sample sizes are not equal.)
1
159. In a completely randomized experimental design, 7 experimental units were used for the first treatment, 9
experimental units for the second treatment, and 14 experimental units for the third treatment. Part of the ANOVA table
for this experiment is shown below.
Source of Variation
Sum of
Squares
Degrees of
Freedom
Mean
Square
F
Between Treatments
_____?
_____?
_____?
4.5
Within Treatments (Error)
_____?
_____?
4
Total
_____?
_____?
a.
Fill in all the blanks in the above ANOVA table.
b.
At a 5% level of significance, test to see if there is a significant difference among the means.
Between Treatments
18
4.5
Within Treatments (Error)
108
27
Total
144
29
160. Random samples were selected from three populations. The data obtained are shown below.
Treatment 1
Treatment 2
Treatment 3
45
30
39
41
34
35
37
35
38
40
40
42
At a 5% level of significance, test to see if there is a significant difference in the means of the three populations. (Please
note that the sample sizes are not equal.)
161. The manager of Young Corporation, wants to determine whether or not the type of work schedule for her employees
has any effect on their productivity. She has selected 15 production employees at random and then randomly assigned 5
employees to each of the 3 proposed work schedules. The following table shows the units of production (per week) under
each of the work schedules.
Work Schedule (Treatments)
Work Schedule 1
Work Schedule 2
Work Schedule 3
50
60
70
60
65
75
70
66
55
40
54
40
45
57
55
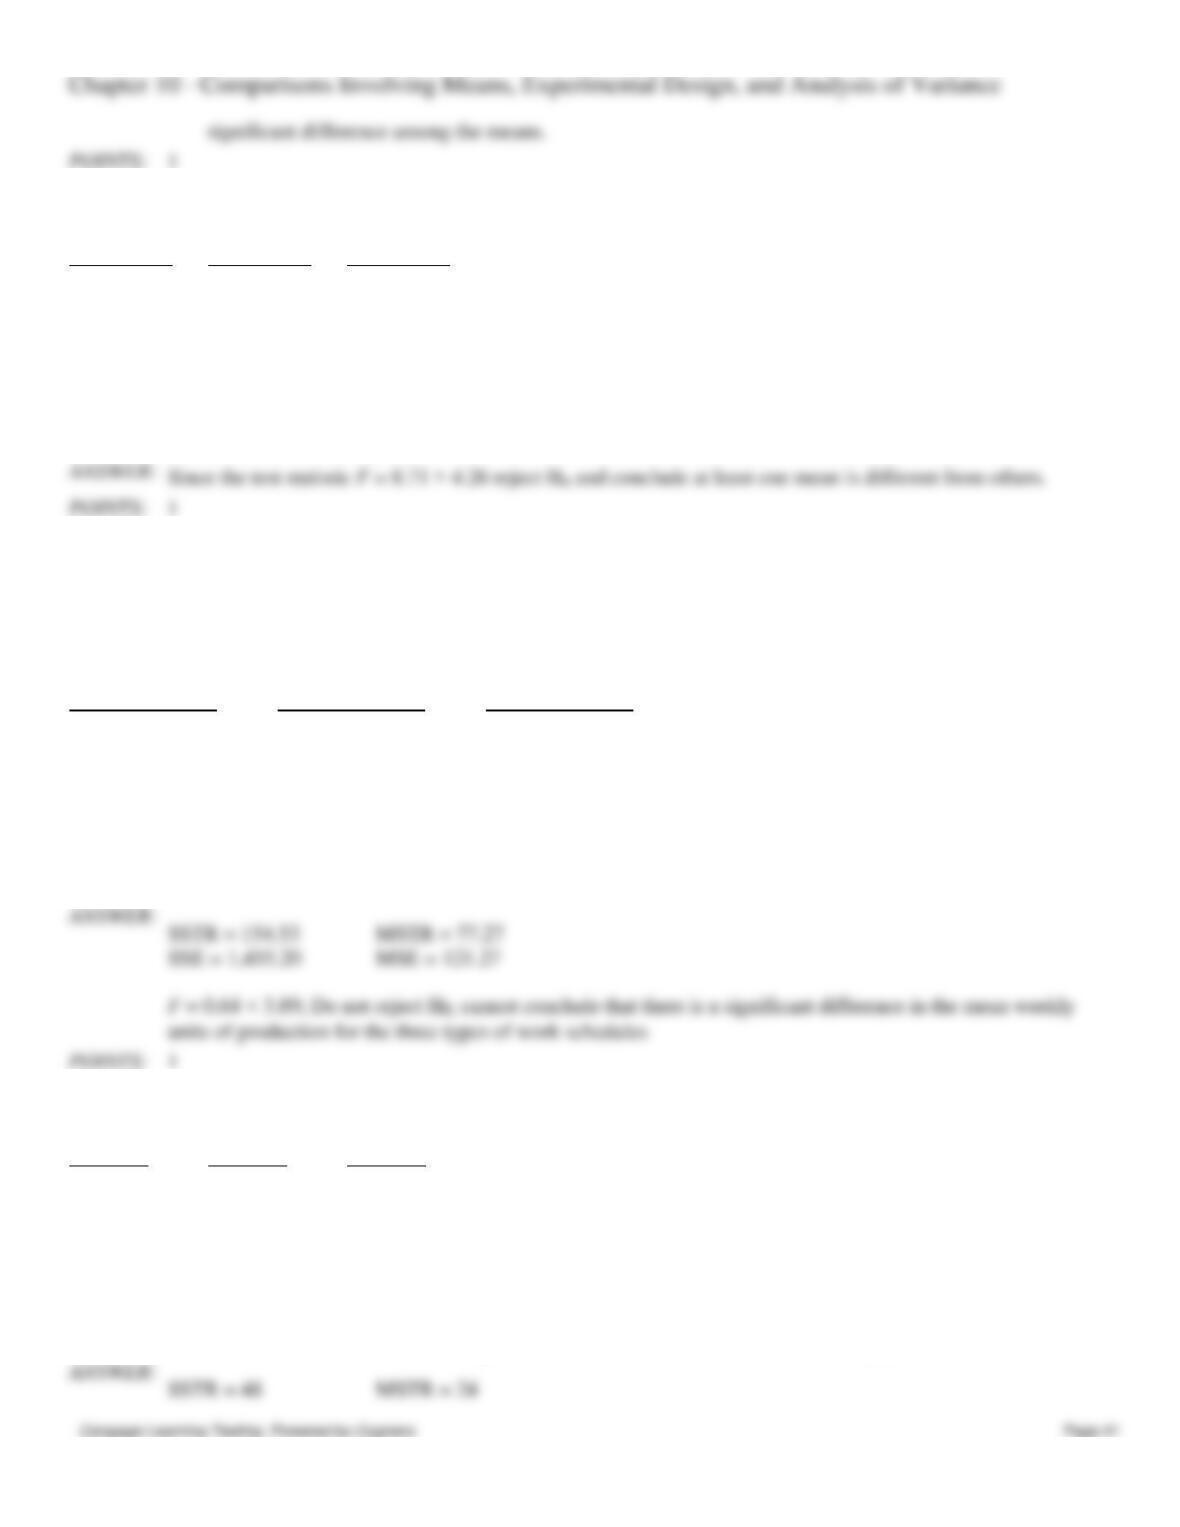
At a 5% level of significance determine if there is a significant difference in the mean weekly units of production for the
three types of work schedules.
units of production for the three types of work schedules
162. Six observations were selected from each of three populations. The data obtained is shown below:
Sample 1
Sample 2
Sample 3
31
37
37
28
32
31
34
34
32
32
24
39
26
32
30
29
33
35
Test at α = 0.05 level to determine if there is a significant difference in the means of the three populations.
significant difference among the means.
163. The test scores for selected samples of sociology students who took the course from three different instructors are
shown below.
Instructor A
Instructor B
Instructor C
83
90
85
60
55
90
80
84
90
85
91
95
71
85
80
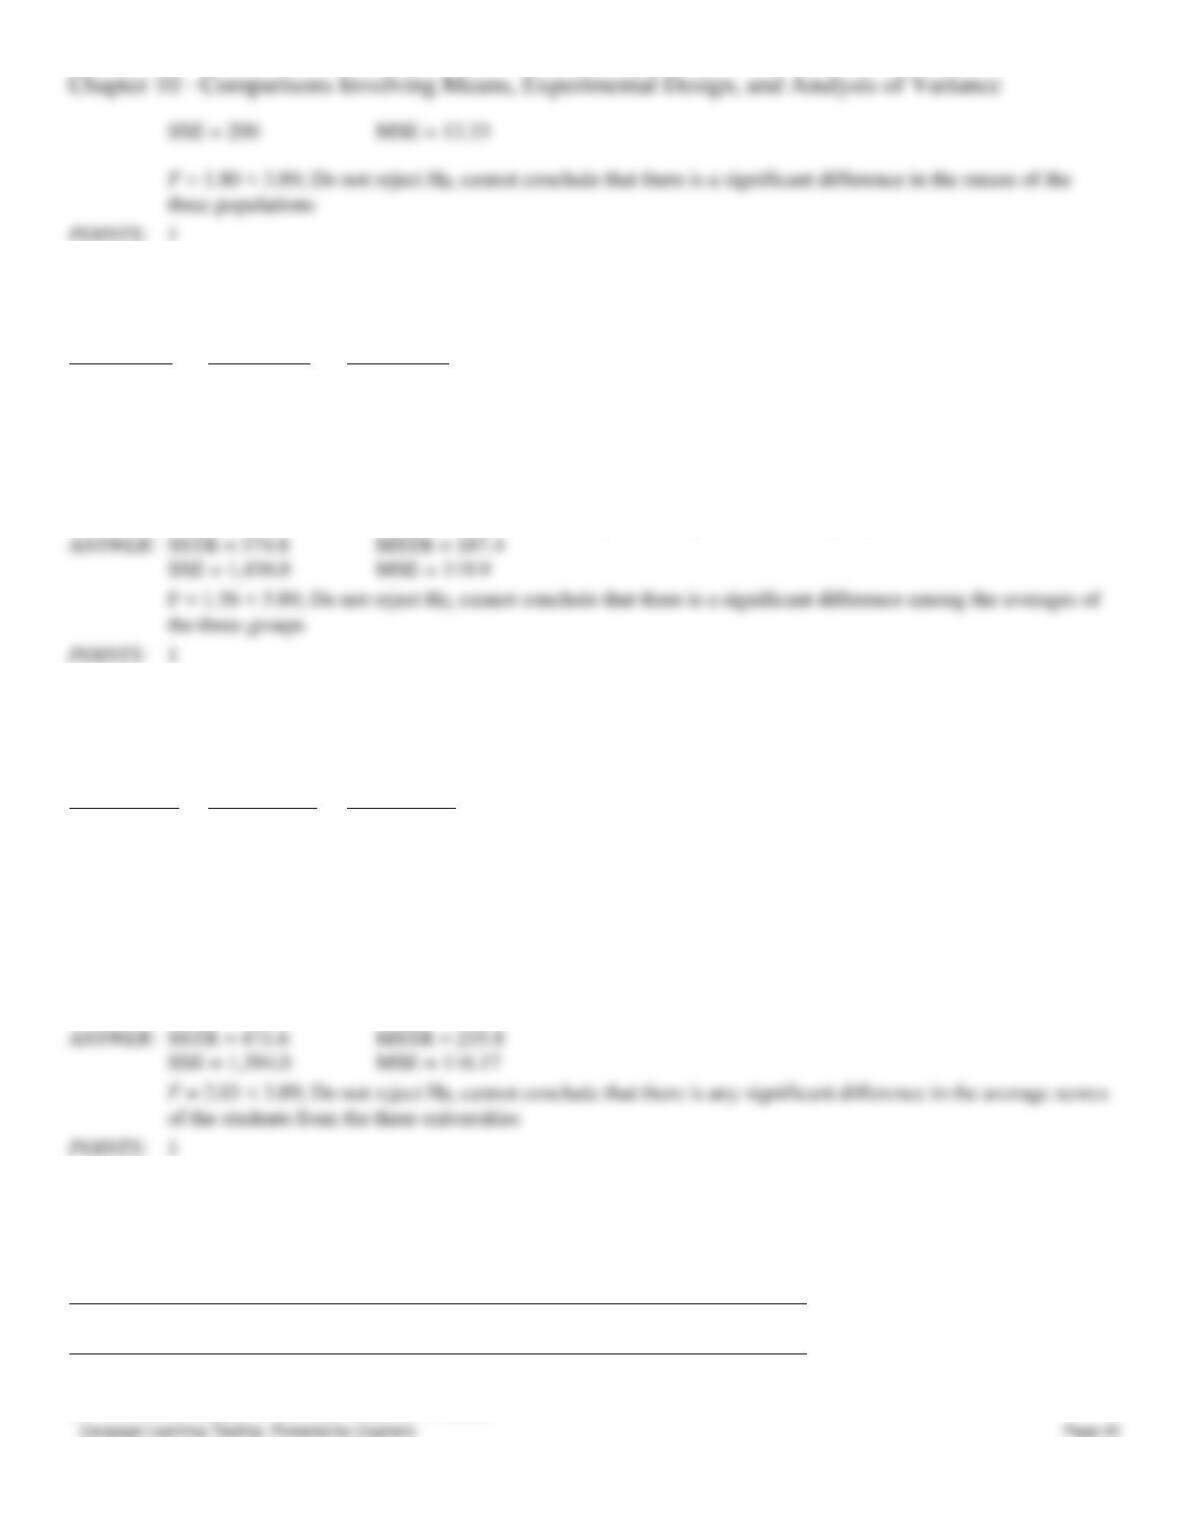
At α = 0.05, test to see if there is a significant difference among the averages of the three groups.
SSTR = 374.8
SSE = 1,438.8
164. Three universities administer the same comprehensive examination to the recipients of MS degrees in psychology.
From each institution, a random sample of MS recipients was selected, and these recipients were then given the exam. The
following table shows the scores of the students from each university.
University A
University B
University C
89
60
81
95
95
70
75
89
90
92
80
78
99
66
77
At α = 0.01, test to see if there is any significant difference in the average scores of the students from the three
universities. (Note that the sample sizes are not equal.)
SSTR = 471.6
SSE = 1,394.0
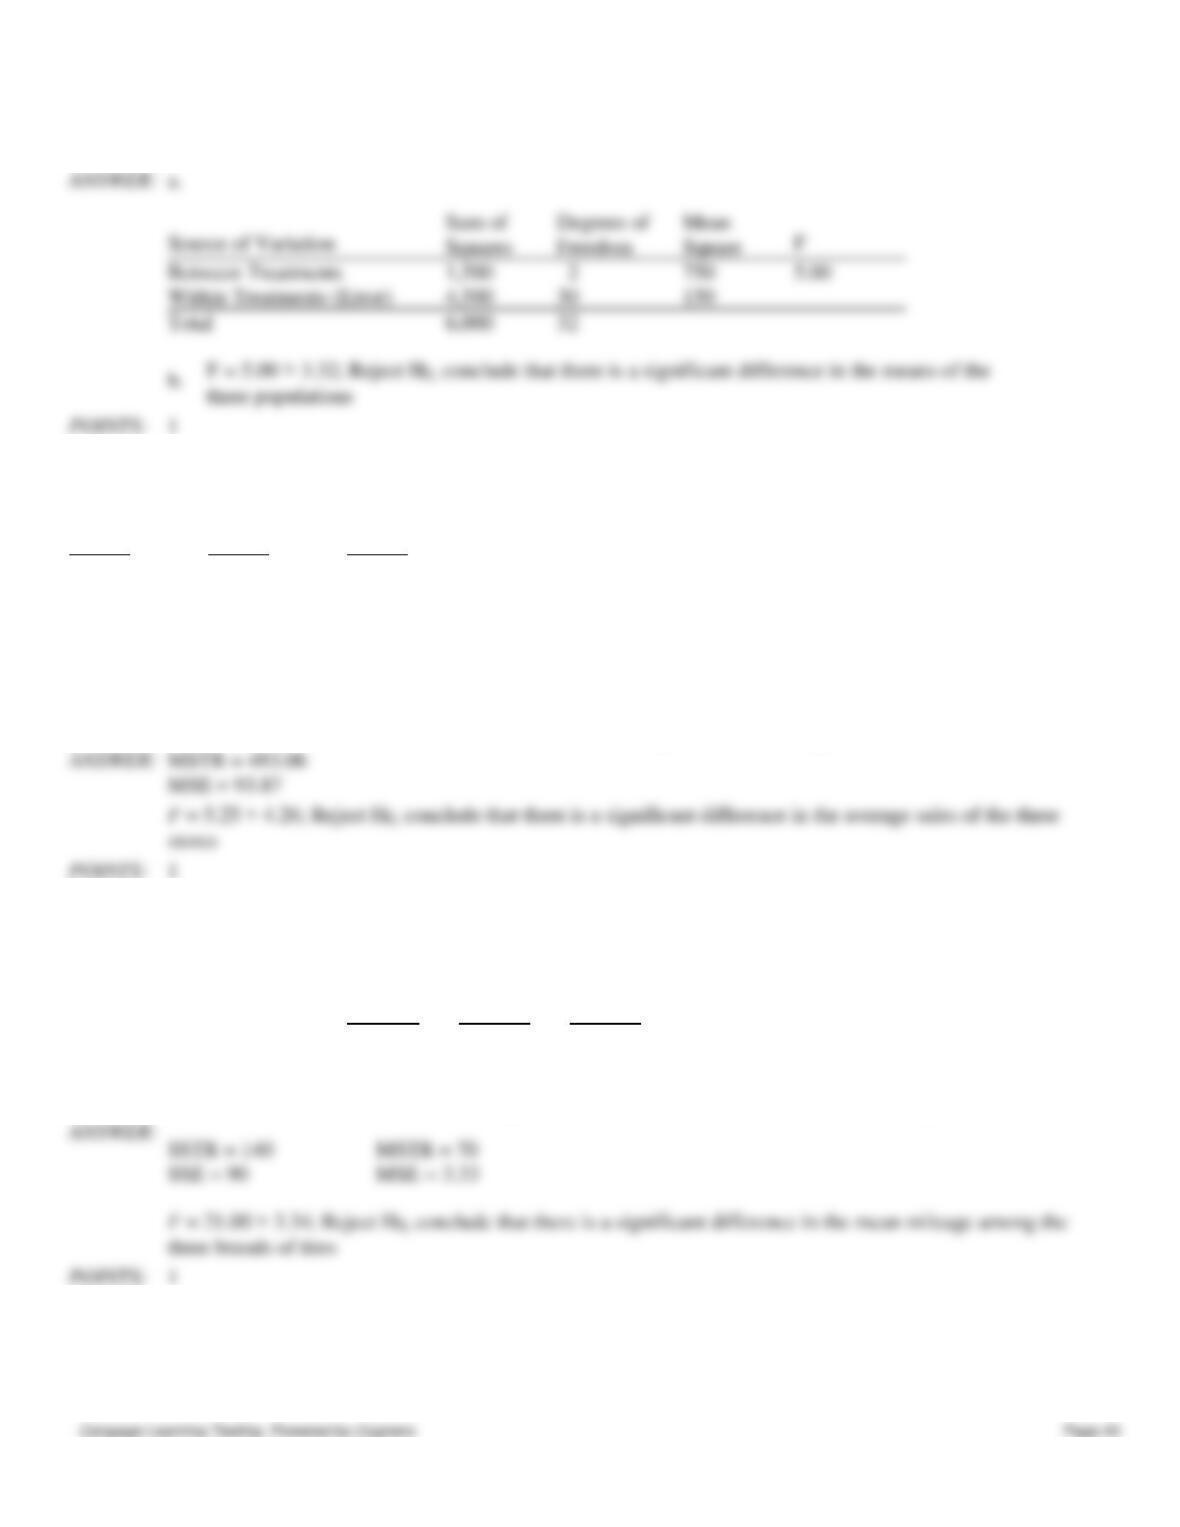
165. In a completely randomized experimental design, 11 experimental units were used for each of the 3 treatments. Part
of the ANOVA table is shown below.
Source of Variation
Sum of
Squares
Degrees of
Freedom
Mean
Square
F
Between Treatments
1,500
_____?
_____?
_____?
Within Treatments (Error)
_____?
_____?
_____?
Total
6,000
_____?
a.
Fill in the blanks in the above ANOVA table.
SSE = 200
Chapter 10 – Comparisons Involving Means, Experimental Design, and Analysis of Variance
b.
At a 5% level of significance, test to determine whether or not the means of the 3 populations
are equal.
Between Treatments
750
Within Treatments (Error)
30
150
32
1
166. MNM, Inc. has three stores located in three different areas. Random samples of the sales of the three stores (in
$1,000) are shown below.
Store 1
Store 2
Store 3
88
76
85
84
78
67
88
60
55
82
58
92
At a 5% level of significance, test to see if there is a significant difference in the average sales of the three stores. Show
your complete work and the ANOVA table. (Please note that the sample sizes are not equal.)
1
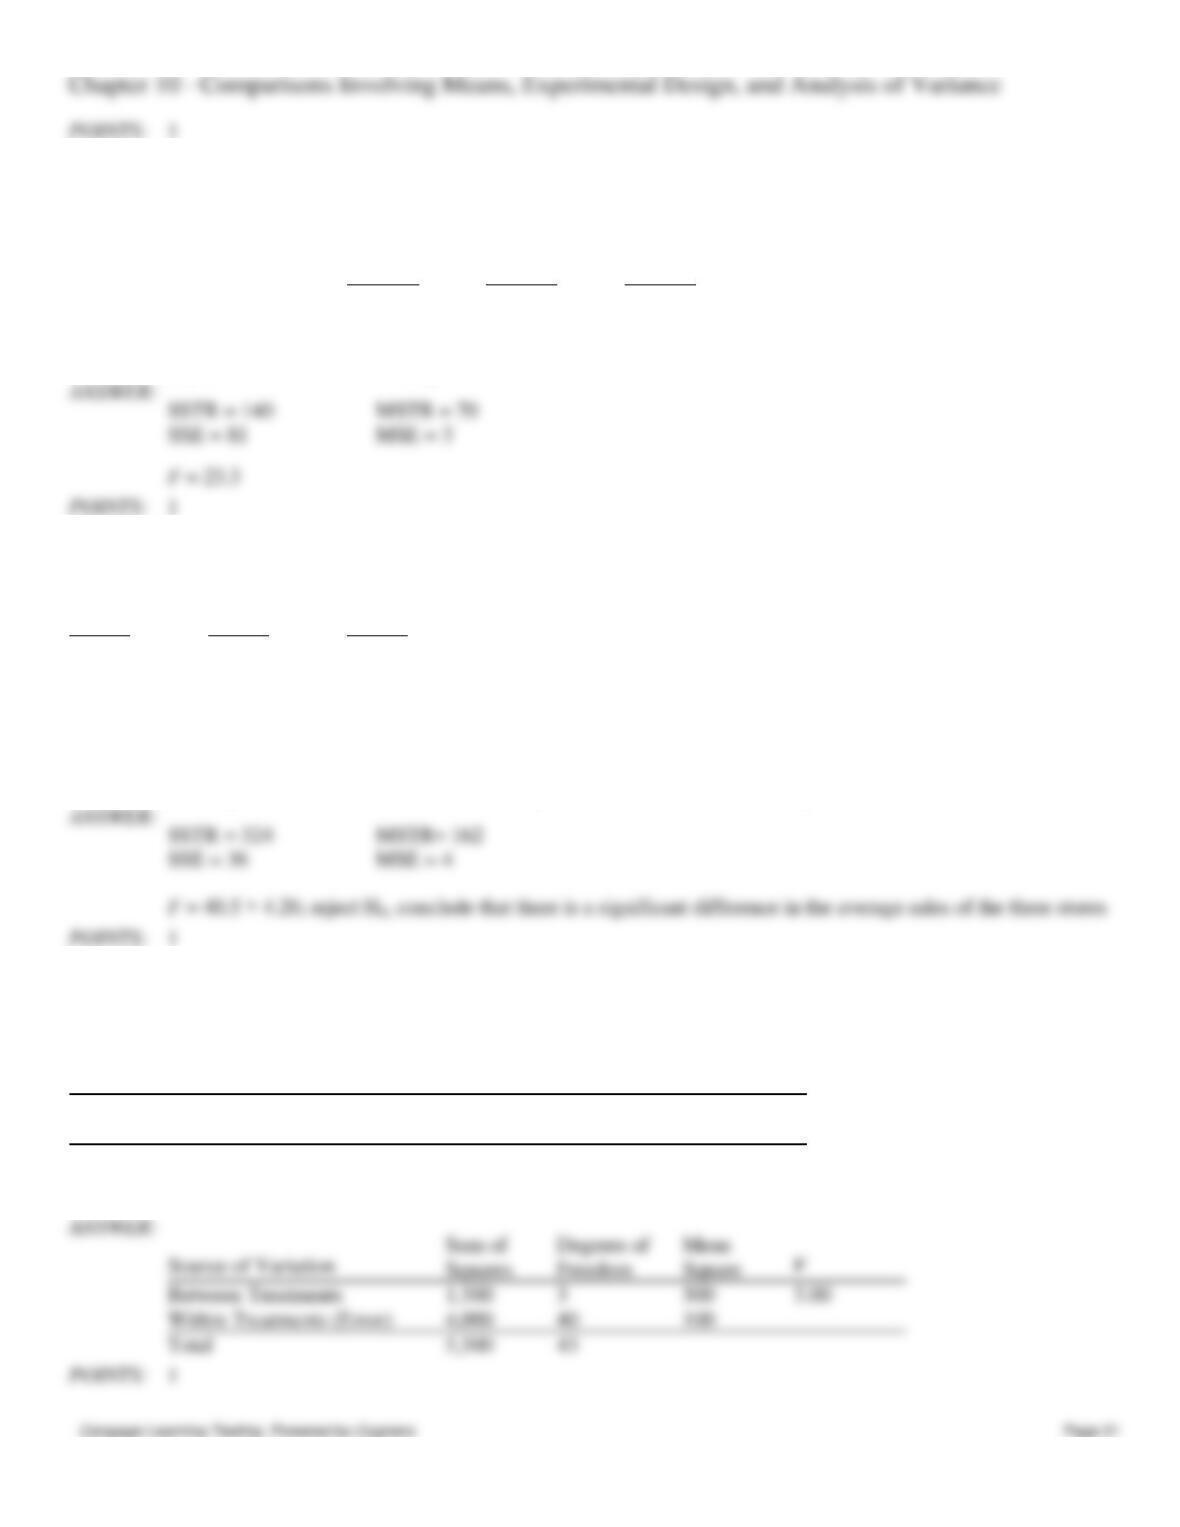
167. Three different brands of tires were compared for wear characteristics. For each brand of tire, ten tires were randomly
selected and subjected to standard wear testing procedures. The average mileage obtained for each brand of tire and
sample standard deviations (both in 1000 miles) are shown below.
Brand A
Brand B
Brand C
Average mileage
37
38
33
Sample variance
3
4
2
Use the above data and test to see if the mean mileage for all three brands of tires is the same. Let Alpha = 0.05.
three brands of tires
1
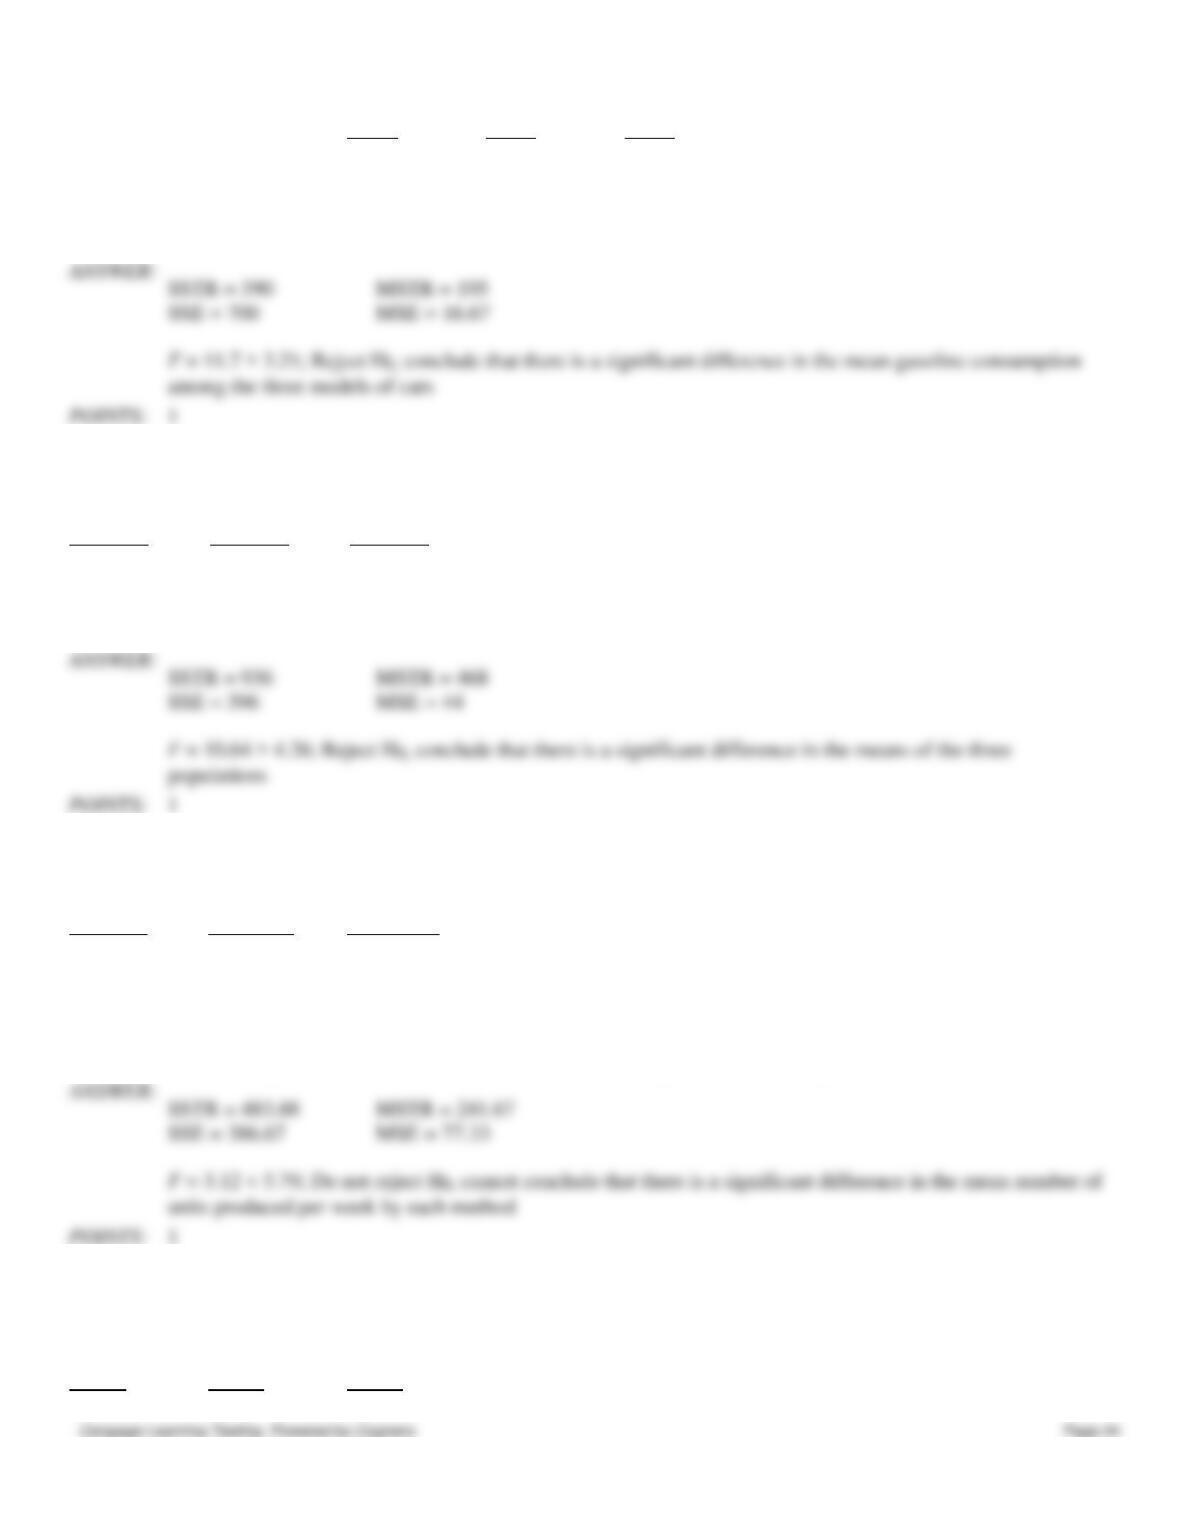
168. Three different models of automobiles (A, B, and C) were compared for gasoline consumption. For each model of
car, fifteen cars were randomly selected and subjected to standard driving procedures. The average miles/gallon obtained
for each model of car and sample standard deviations are shown below.
Chapter 10 – Comparisons Involving Means, Experimental Design, and Analysis of Variance
Car A
Car B
Car C
Average Mile Per Gallon
42
49
44
Sample Standard Deviation
4
5
3
Use the above data and test to see if the mean gasoline consumption for all three models of cars is the same. Let Alpha =
0.05.
among the three models of cars
1
169. At α = 0.05, test to determine if the means of the three populations (from which the following samples are selected)
are equal.
Sample 1
Sample 2
Sample 3
60
84
60
78
78
57
72
93
69
66
81
66
1
170. In order to test to see if there is any significant difference in the mean number of units produced per week by each of
three production methods, the following data were collected:
Method I
Method II
Method III
182
170
162
170
192
166
180
190
At the Alpha = 0.05 level of significance, is there any difference in the mean number of units produced per week by each
method? Show the complete ANOVA table. (Please note that the sample sizes are not equal.)
1
171. A dietician wants to see if there is any difference in the effectiveness of three diets. Eighteen people, comprising a
sample, were randomly assigned to the three diets. Below you are given the total amount of weight lost in a month by
each person.
Diet A
Diet B
Diet C
14
12
25
Chapter 10 – Comparisons Involving Means, Experimental Design, and Analysis of Variance
18
10
32
20
22
18
12
12
14
20
16
17
18
12
14
a.
State the null and alternative hypotheses.
b.
Calculate the test statistic.
c.
What would you advise the dietician about the effectiveness of the three diets? Use a .05 level
of significance.
b.
2.005
c.
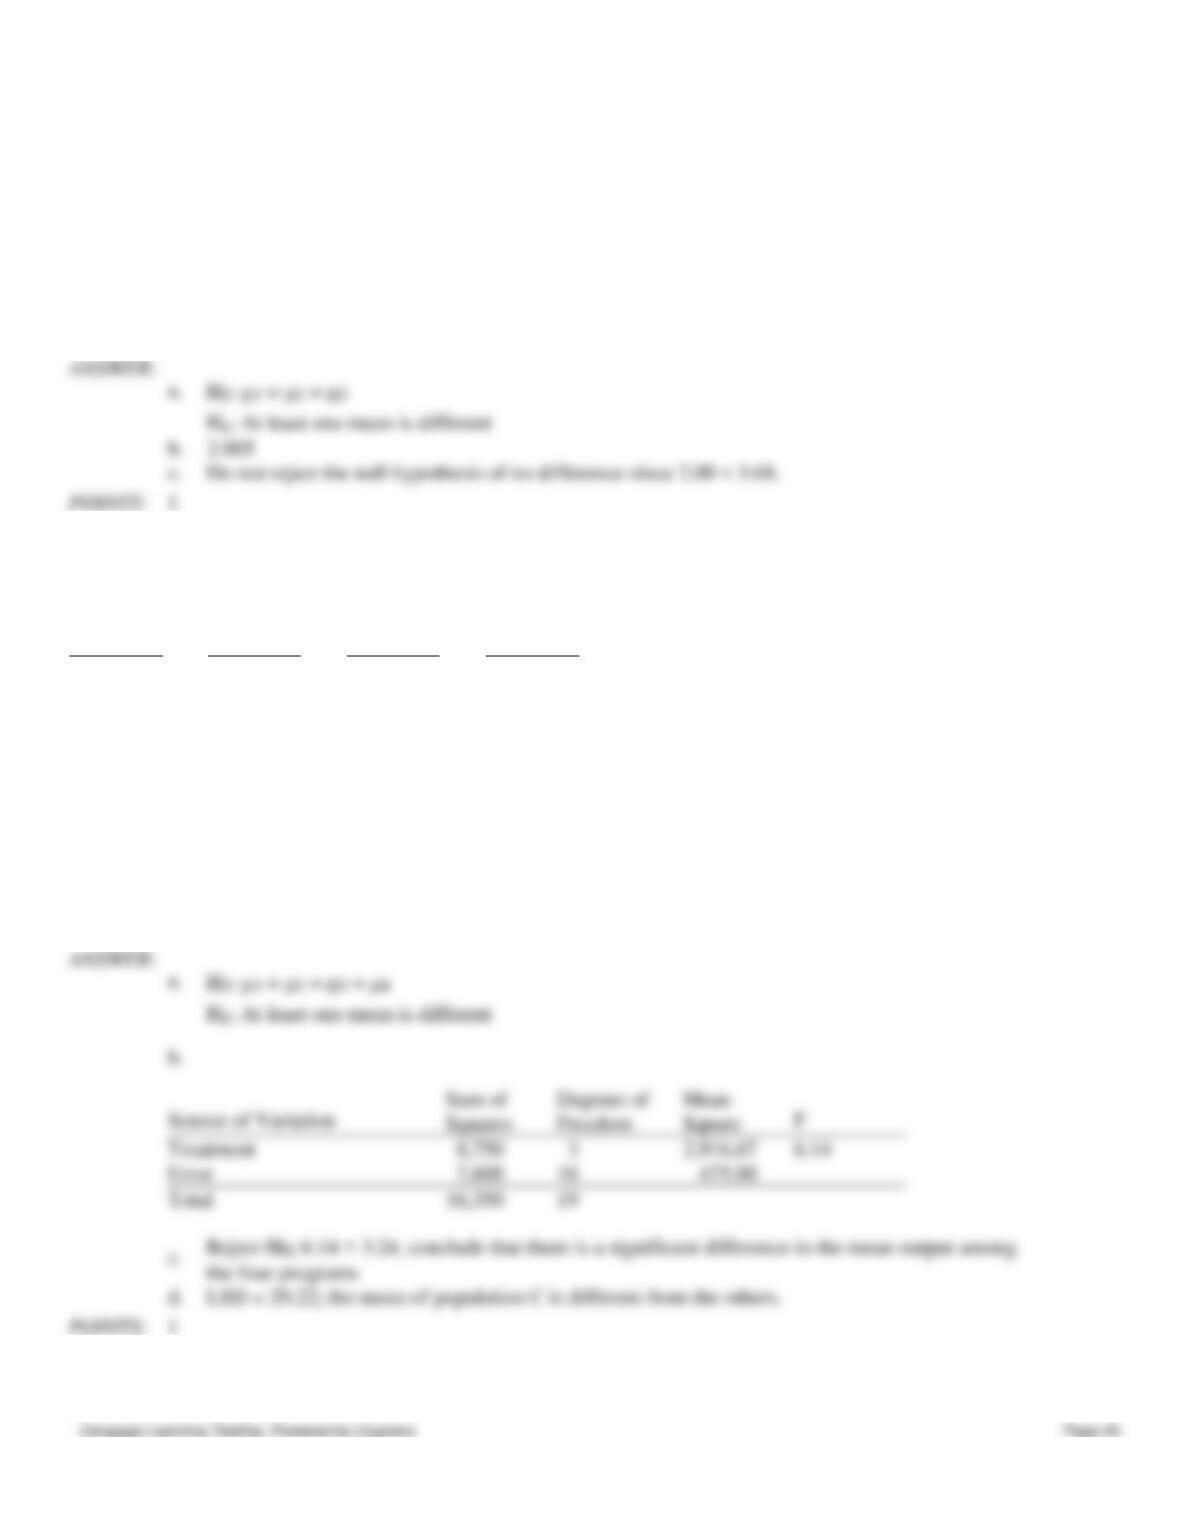
172. Allied Corporation wants to increase the productivity of its line workers. Four different programs have been
suggested to help increase productivity. Twenty employees, making up a sample, have been randomly assigned to one of
the four programs and their output for a day’s work has been recorded. You are given the results below.
Program A
Program B
Program C
Program D
150
150
185
175
130
120
220
150
120
135
190
120
180
160
180
130
145
110
175
175
a.
State the null and alternative hypotheses.
b.
Construct an ANOVA table.
c.
As the statistical consultant to Allied, what would you advise them? Use a .05 level of
significance.
d.
Use Fisher’s LSD procedure and determine which population mean (if any) is different from
the others. Let α = .05.
Sum of
Degrees of
Mean
Treatment
2,916.67
6.14
Error
16
Total
16,350
19
d.
173. For four populations, the population variances are assumed to be equal. Random samples from each population
provide the following data.
Chapter 10 – Comparisons Involving Means, Experimental Design, and Analysis of Variance
Population
Sample Size
Sample Mean
Sample Variance
1
11
40
23.4
2
11
35
21.6
3
11
39
25.2
4
11
37
24.6
Using a .05 level of significance, test to see if the means for all four populations are the same.
1
174. The final examination grades of random samples of students from three different classes are shown below.
Class A
Class B
Class C
92
91
85
85
85
93
96
90
82
95
86
84
At the α = .05 level of significance, is there any difference in the mean grades of the three classes?
the three classes
1
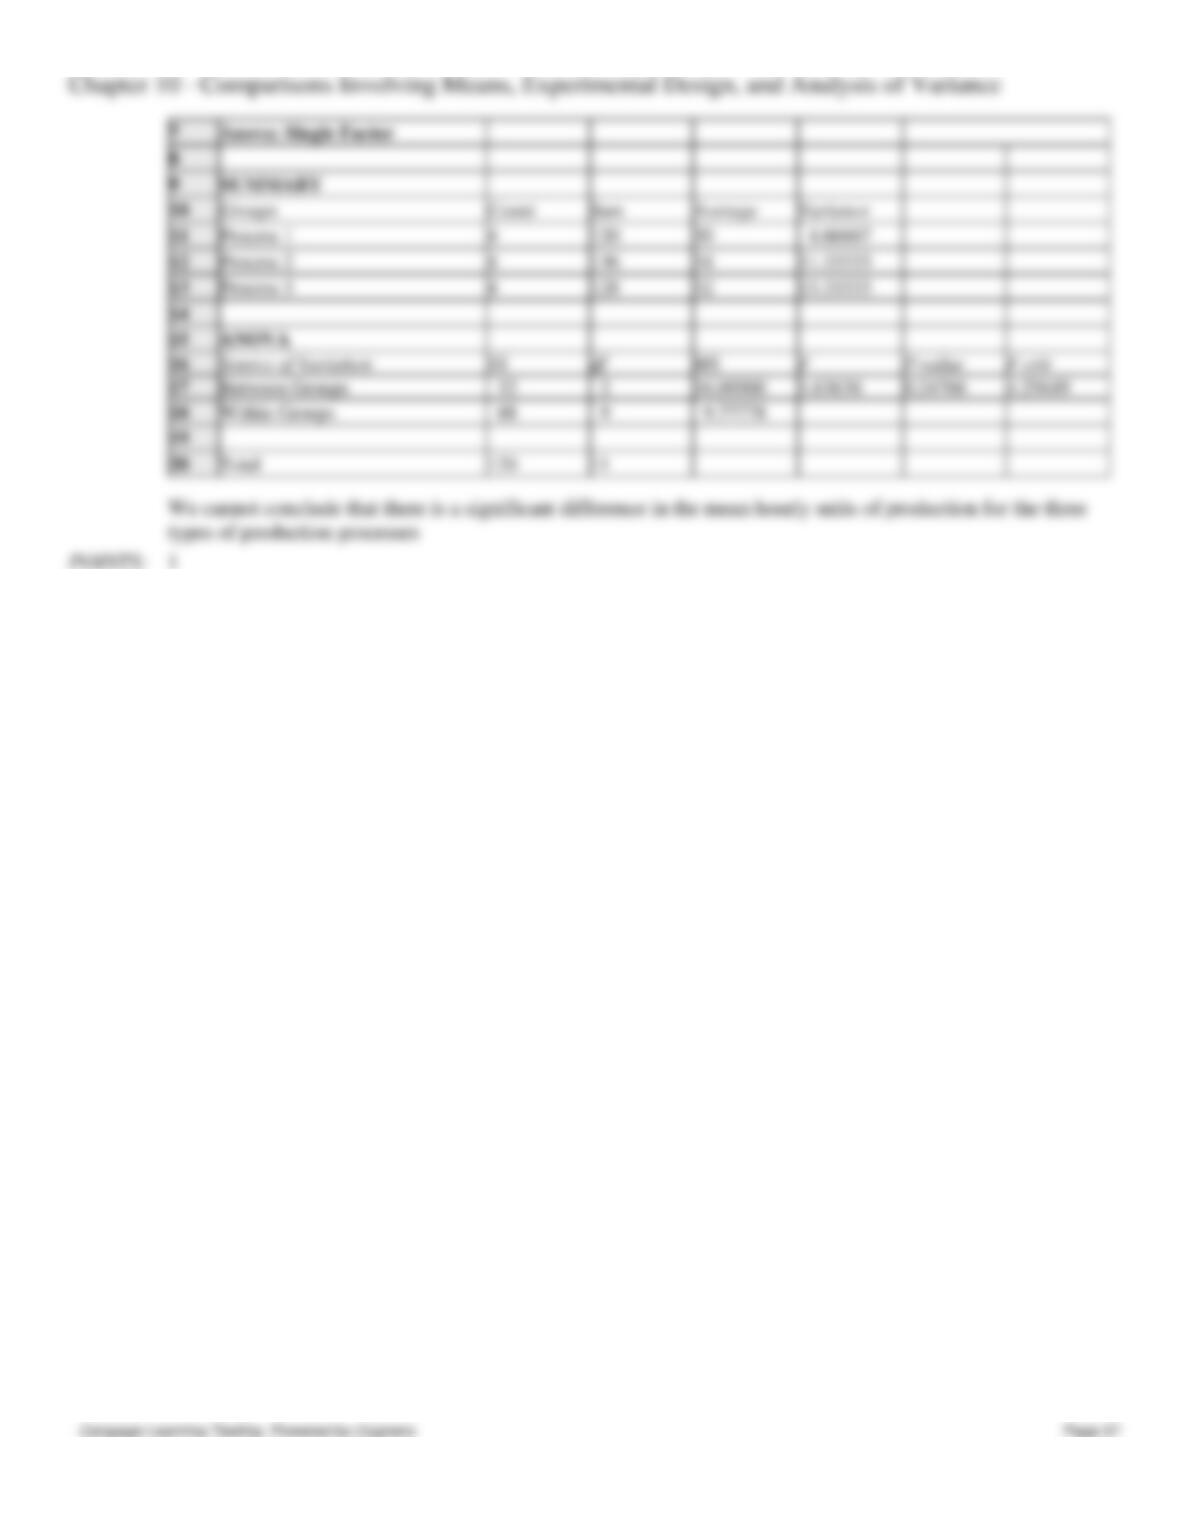
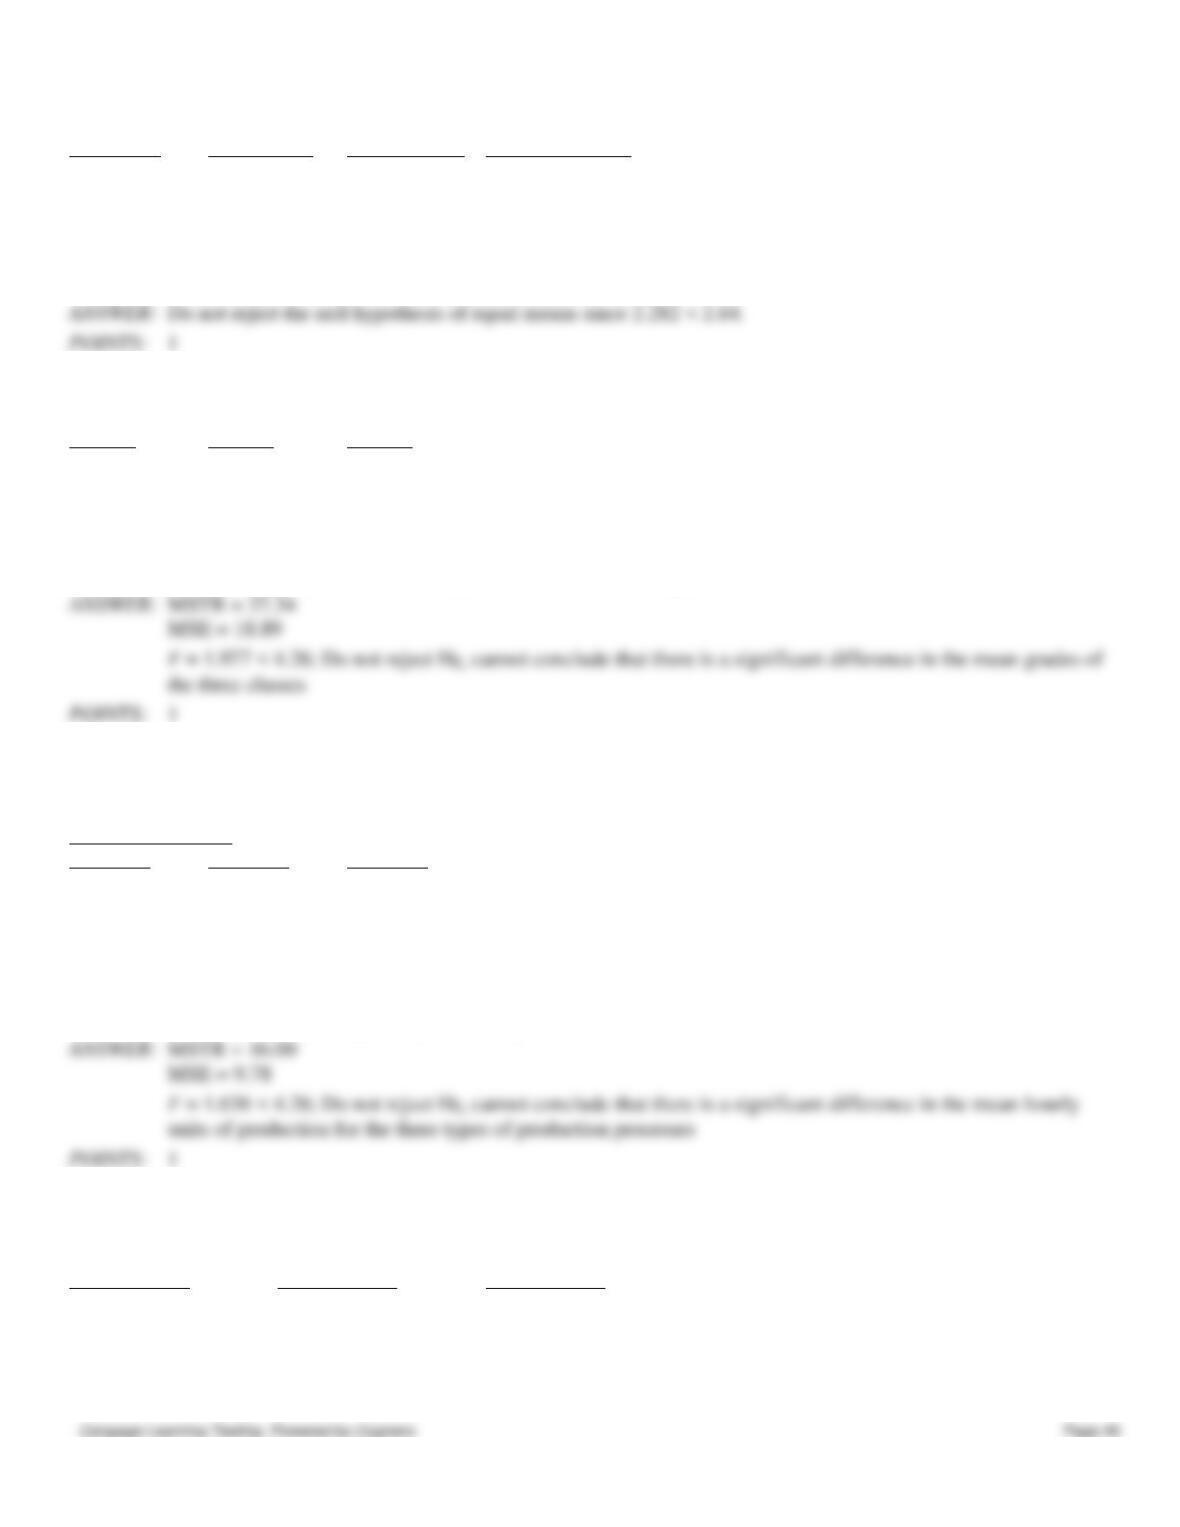
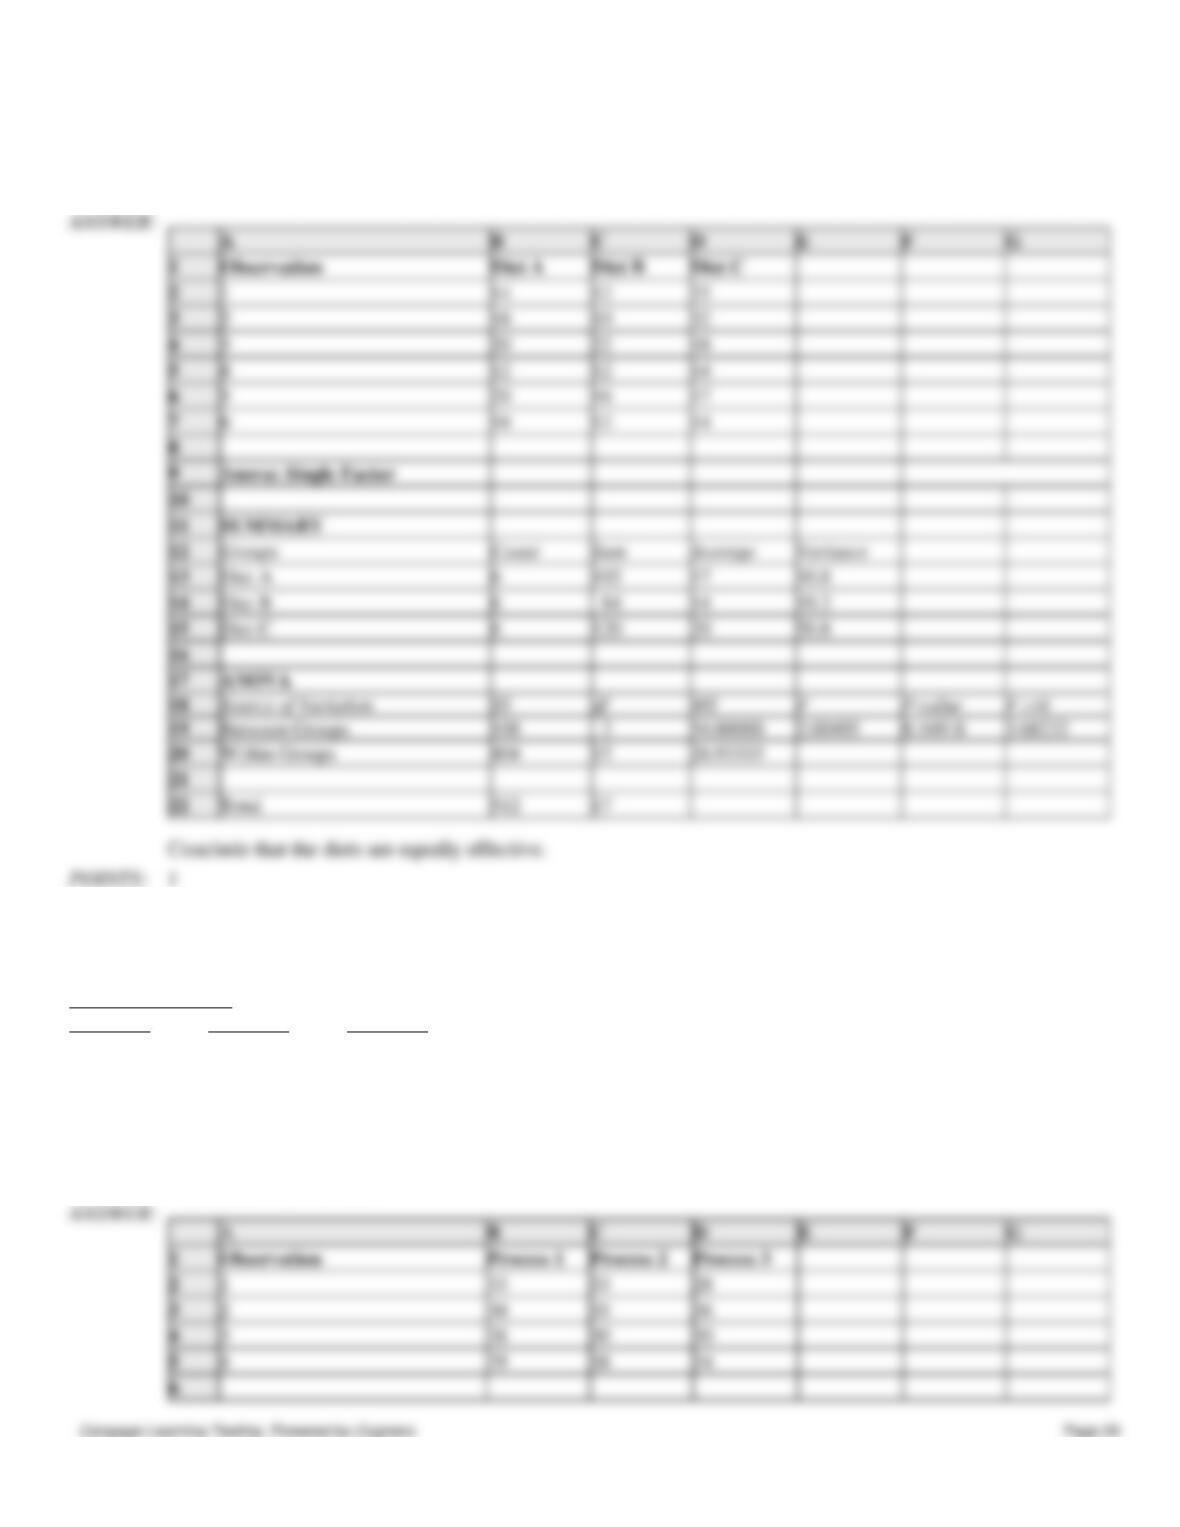
175. Individuals were randomly assigned to three different production processes. The hourly units of production for the
three processes are shown below.
Production Process
Process 1
Process 2
Process 3
33
33
28
30
35
36
28
30
30
29
38
34
Use the analysis of variance procedure with α = 0.05 to determine if there is a significant difference in the mean hourly
units of production for the three types of production processes.
1
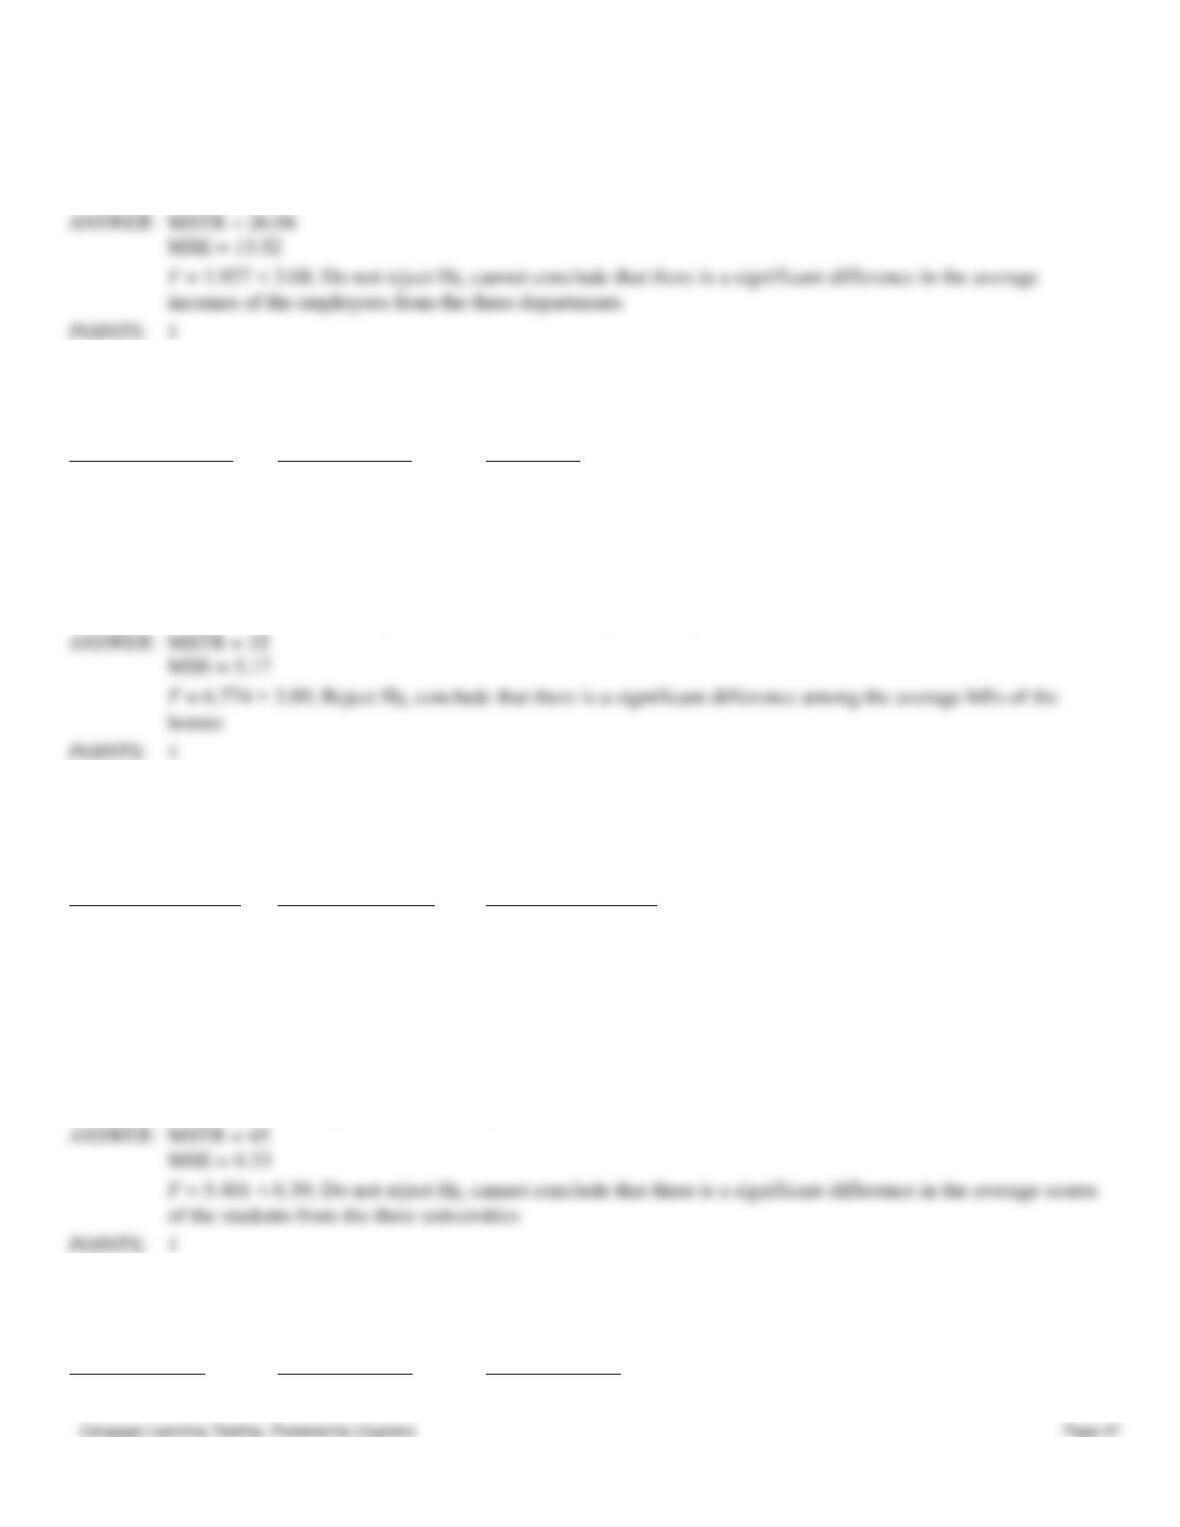
176. Random samples of employees from three different departments of MNM Corporation showed the following yearly
incomes (in $1,000).
Department A
Department B
Department C
40
46
46
37
41
40
43
43
41
41
33
48
35
41
39
Chapter 10 – Comparisons Involving Means, Experimental Design, and Analysis of Variance
38
42
45
At α = .05, test to determine if there is a significant difference among the average incomes of the employees from the
three departments.
177. The heating bills for a selected sample of houses using various forms of heating are given below (values are in
dollars).
Gas Heated Homes
Central Electric
Heat Pump
83
90
81
80
88
83
82
87
80
83
82
82
82
83
79
At α = 0.05, test to see if there is a significant difference among the average bills of the homes.
178. Three universities in your state decided to administer the same comprehensive examination to the recipients of MBA
degrees from the three institutions. From each institution, MBA recipients were randomly selected and were given the
test. The following table shows the scores of the students from each university.
Northern University
Central University
Southern University
75
85
80
80
89
81
84
86
84
85
88
79
81
83
85
At α = 0.01, test to see if there is any significant difference in the average scores of the students from the three
universities. (Note that the sample sizes are not equal.)
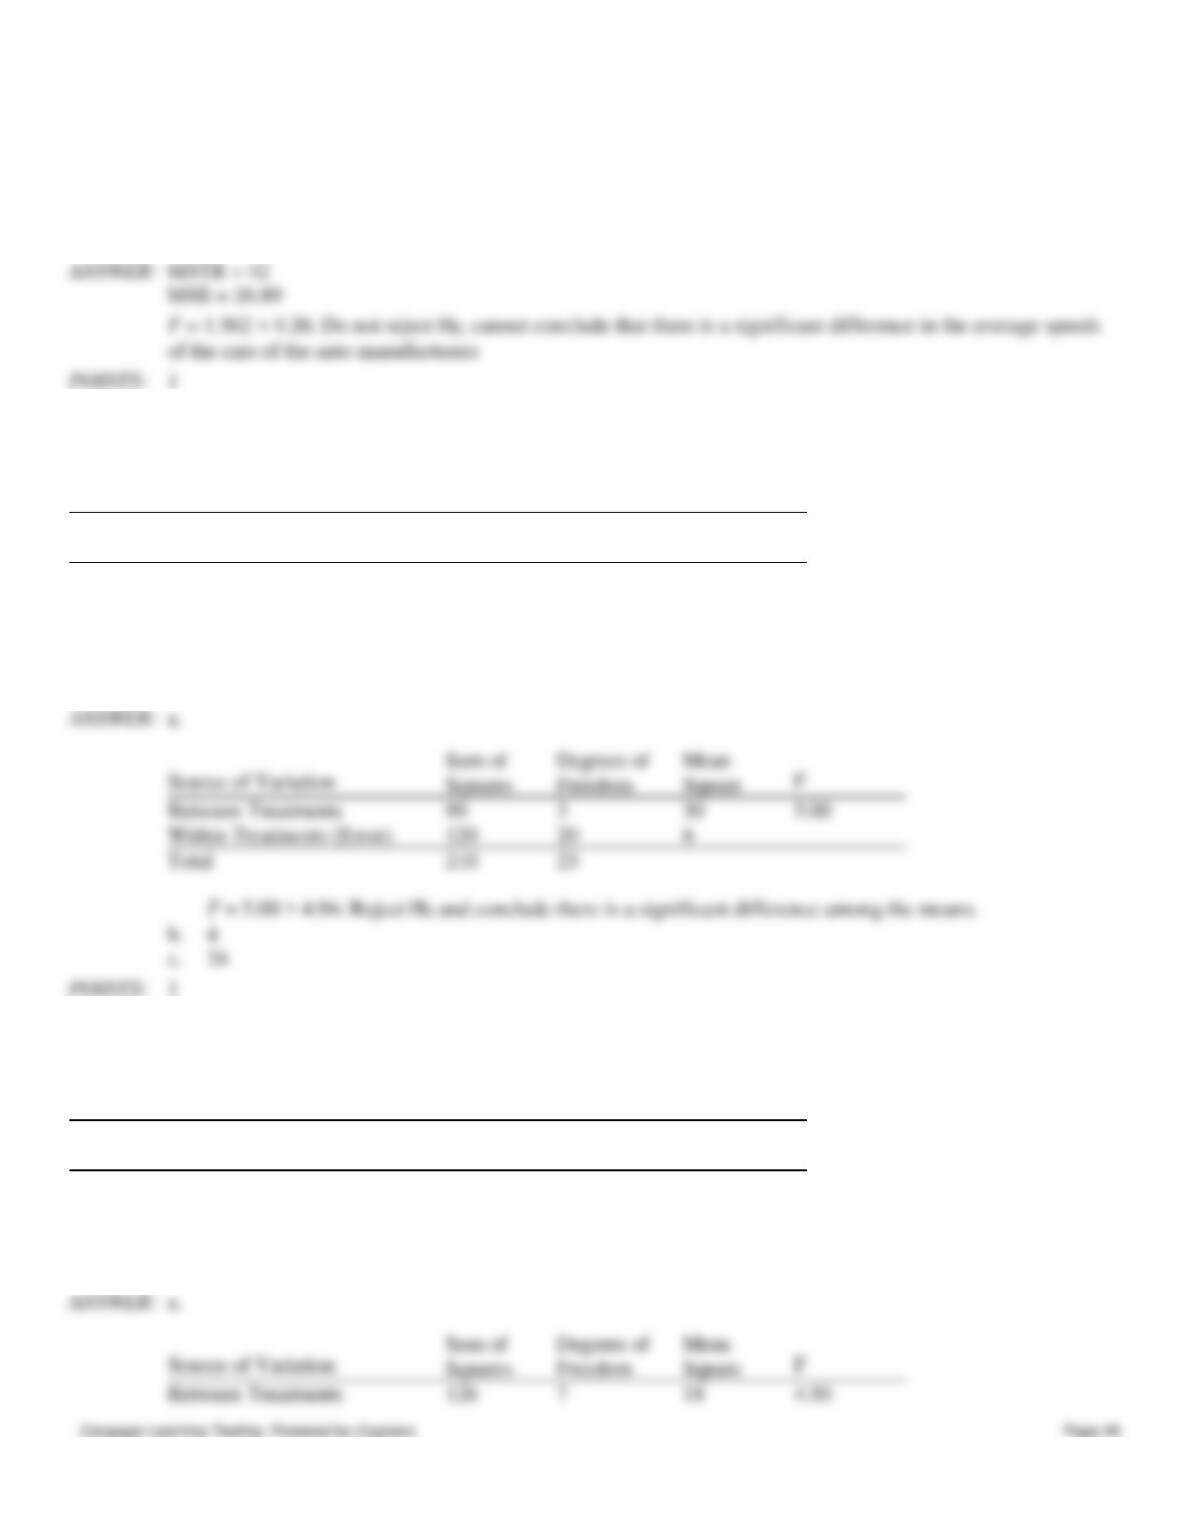
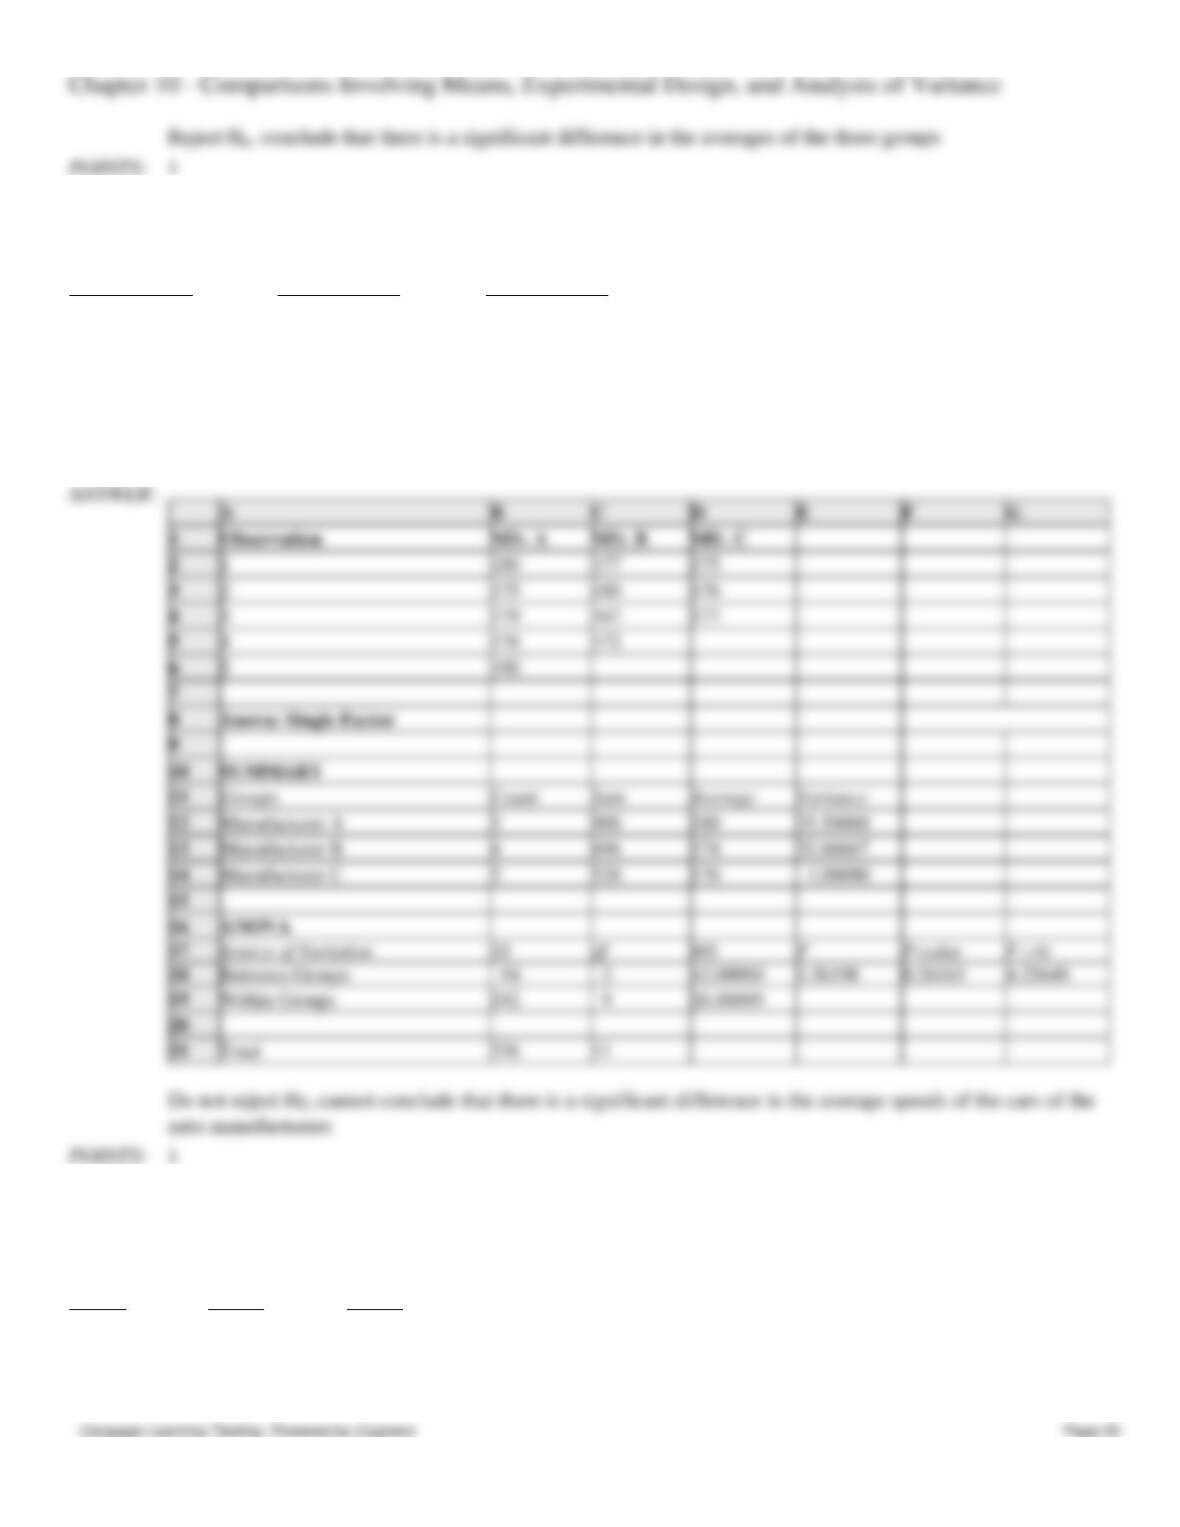
179. The three major automobile manufacturers have entered their cars in the Indianapolis 500 race. The speeds of the
tested cars are given below.
Manufacturer A
Manufacturer B
Manufacturer C
180
177
175
Chapter 10 – Comparisons Involving Means, Experimental Design, and Analysis of Variance
175
180
176
179
167
177
176
172
190
At α = .05, test to see if there is a significant difference in the average speeds of the cars of the auto manufacturers.
of the cars of the auto manufacturers
1
180. Part of an ANOVA table is shown below.
Source of Variation
Sum of
Squares
Degrees of
Freedom
Mean
Square
F
Between Treatments
90
3
_____?
_____?
Within Treatments (Error)
120
20
_____?
Total
_____?
_____?
a.
Compute the missing values and fill in the blanks in the above table. Use α = .01 to determine
if there is any significant difference among the means.
b.
How many groups have there been in this problem?
c.
What has been the total number of observations?
Sum of
Degrees of
Mean
Between Treatments
90
3
30
5.00
Within Treatments (Error)
120
20
6
Total
210
23
b.
c.
24
1
181. Part of an ANOVA table involving 8 groups for a study is shown below.
Source of Variation
Sum of
Squares
Degrees of
Freedom
Mean
Square
F
Between Treatments
126
_____?
_____?
_____?
Within Treatments (Error)
240
_____?
_____?
Total
_____?
67
a.
Complete all the missing values in the above table and fill in the blanks.
b.
Use α = 0.01 to determine if there is any significant difference among the means of the eight
groups.
Squares
Freedom
Square
Between Treatments
126
7
18
4.50
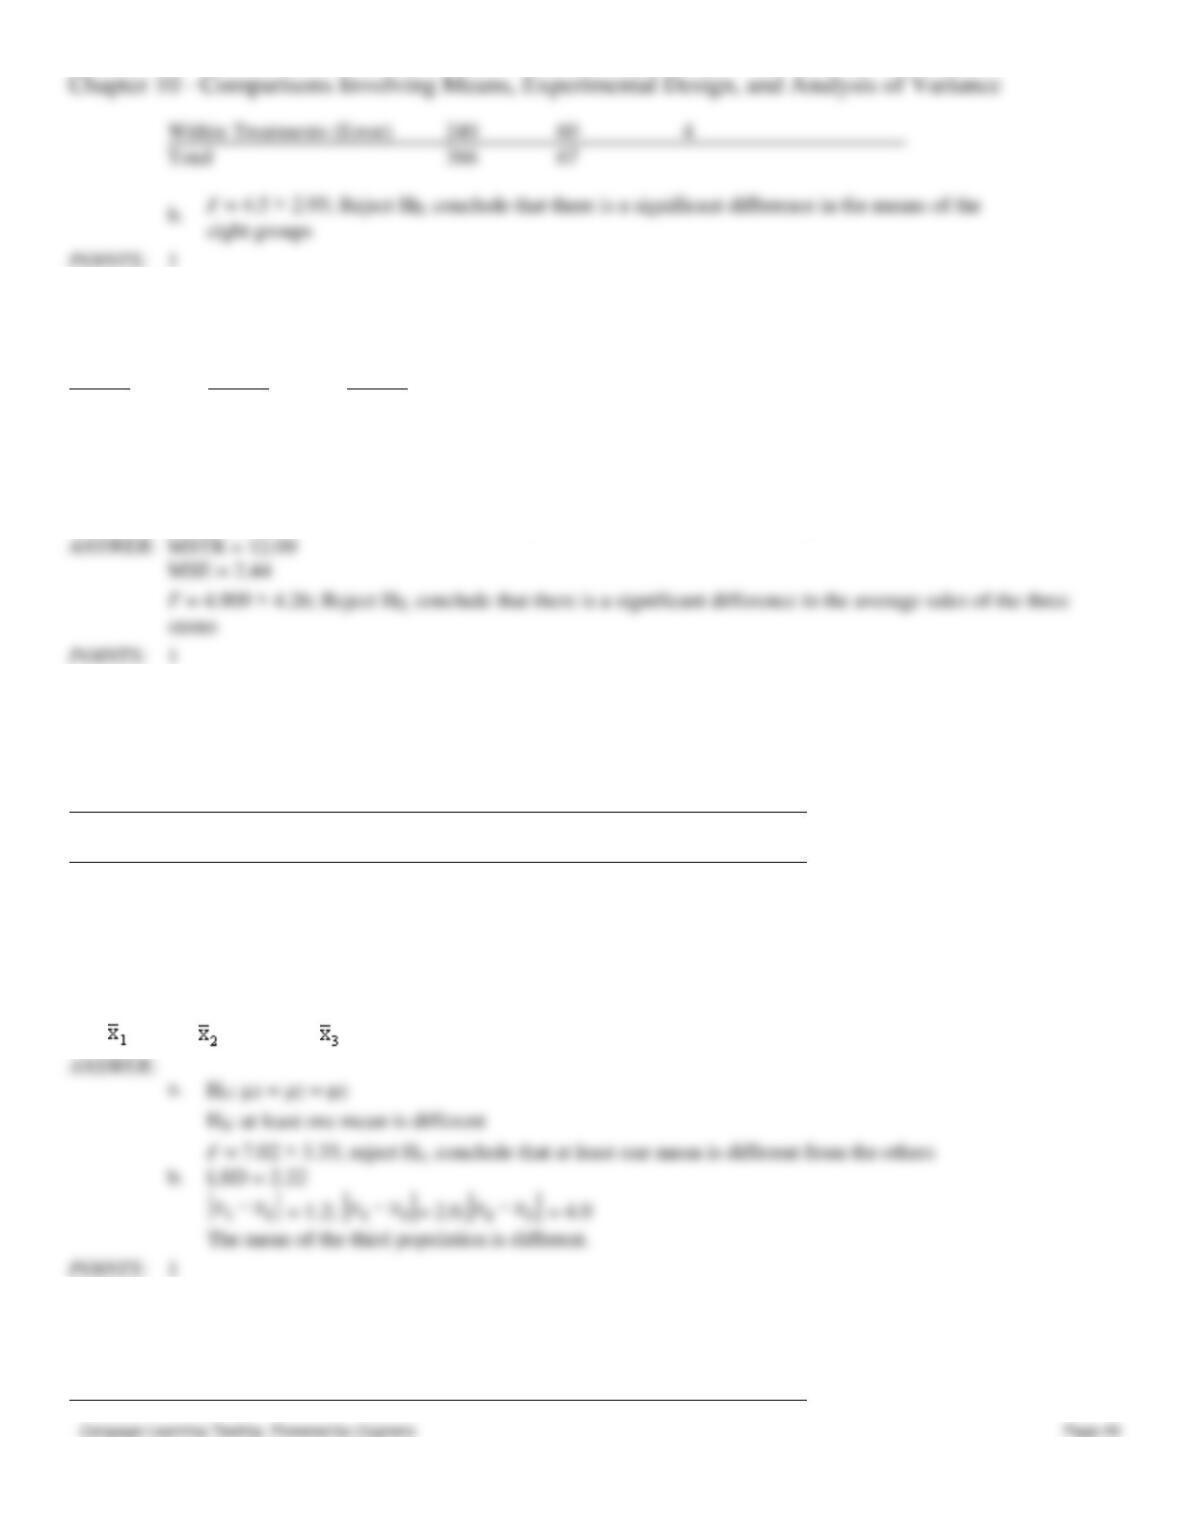
182. MNM, Inc. has three stores located in three different areas. Random samples of the daily sales of the three stores (in
$1,000) are shown below.
Store 1
Store 2
Store 3
9
10
6
8
11
7
7
10
8
8
13
11
At a 5% level of significance, test to see if there is a significant difference in the average sales of the three stores.
stores
1
183. Ten observations were selected from each of 3 populations, and an analysis of variance was performed on the data.
The following are the results:
Source of Variation
Sum of
Squares
Degrees of
Freedom
Mean
Square
F
Between Treatments
82.4
Within Treatments (Error)
158.4
Total
a.
Using α = .05, test to see if there is a significant difference among the means of the three
populations.
b.
If in Part a you concluded that at least one mean is different from the others, determine which
mean is different. The three sample means are
= 24.8, = 23.4, and = 27.4. Use Fisher’s LSD procedure and let α = .05.
b.
The mean of the third population is different.
1
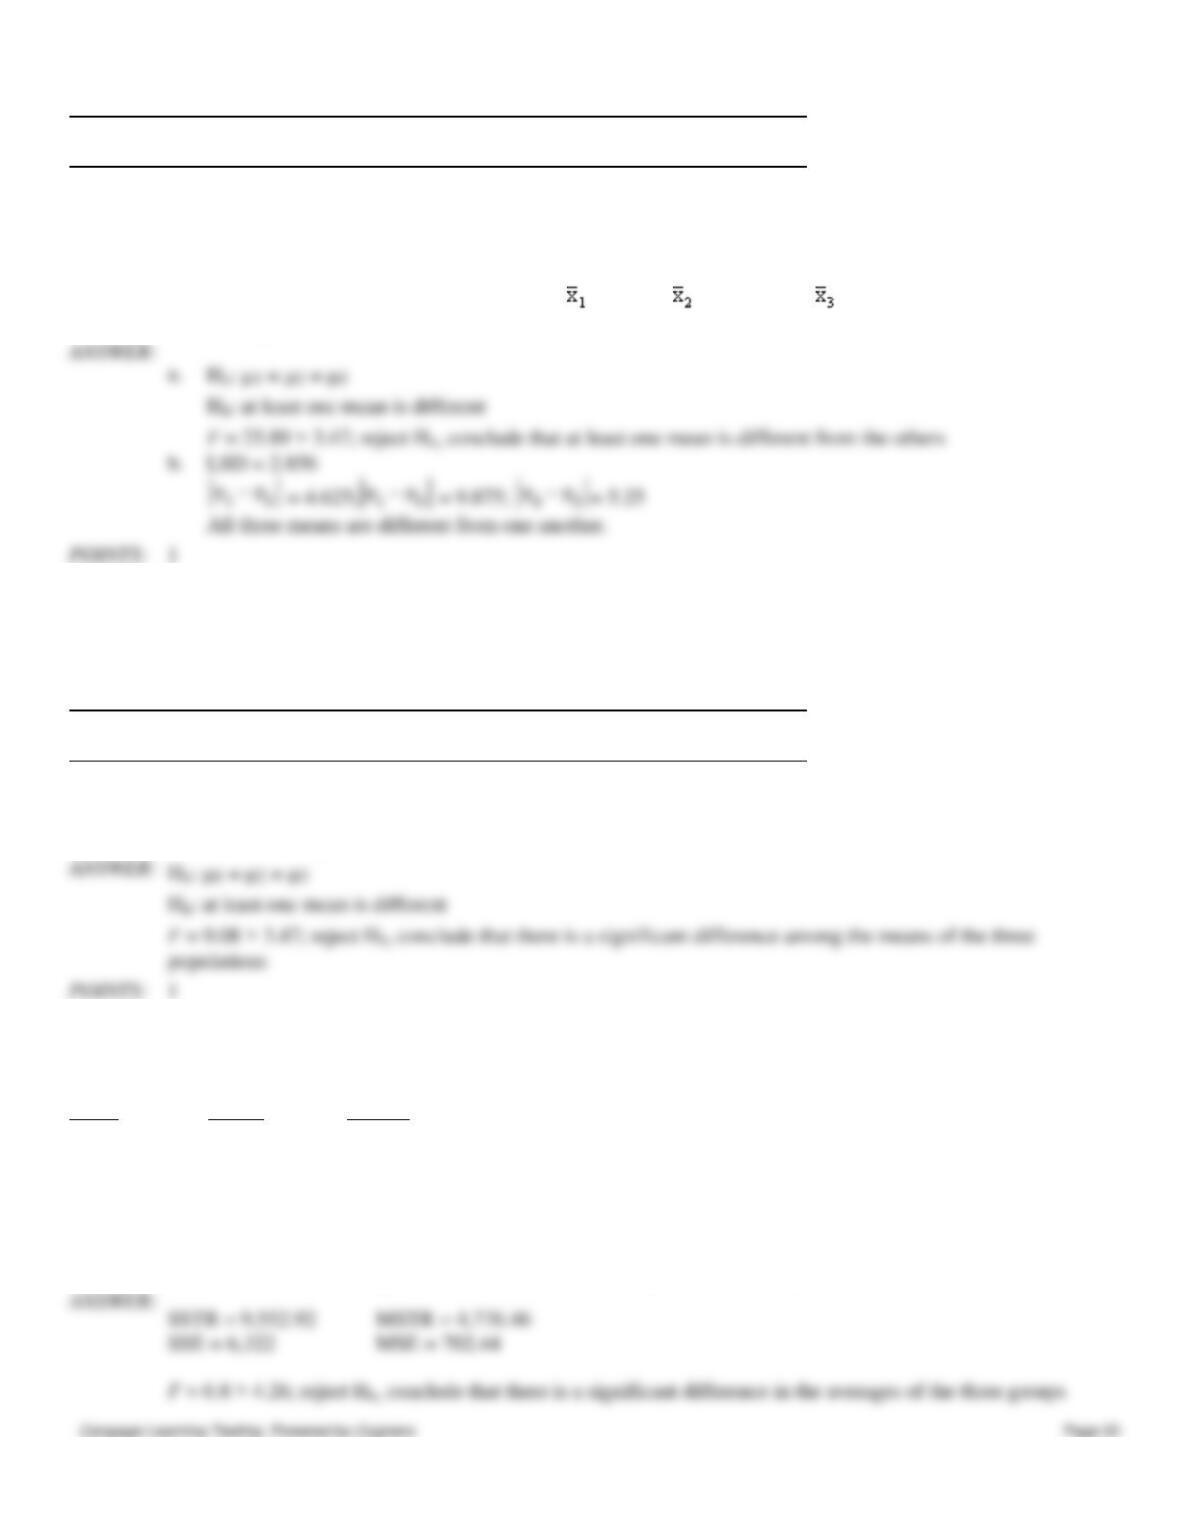
184. The following are the results from a completely randomized design consisting of 3 treatments.
Source of Variation
Sum of
Squares
Degrees of
Freedom
Mean
Square
F
Within Treatments (Error)
240
60
4
Total
366
67
Chapter 10 – Comparisons Involving Means, Experimental Design, and Analysis of Variance
Between Treatments
390.58
Within Treatments (Error)
158.40
Total
548.98
23
a.
Using α = .05, test to see if there is a significant difference among the means of the three
populations. The sample sizes for the three treatments are equal.
b.
If in Part a you concluded that at least one mean is different from the others, determine which
mean(s) is(are) different. The three sample means are = 17.000, = 21.625, and = 26.875.
Use Fisher’s LSD procedure and let α = .05.
b.
All three means are different from one another.
185. Eight observations were selected from each of 3 populations, and an analysis of variance was performed on the data.
The following are part of the results.
Source of Variation
Sum of
Squares
Degrees of
Freedom
Mean
Square
F
Between Treatments
195.58
Within Treatments (Error)
10.77
Total
Using α = .05, test to see if there is a significant difference among the means of the three populations. The sample sizes
for the three treatments are equal.
186. Random samples of individuals from three different cities were asked how much time they spend per day watching
television. The results (in minutes) for the three groups are shown below.
City I
City II
City III
260
178
211
280
190
190
240
220
250
260
240
300
At α = 0.05, test to see if there is a significant difference in the averages of the three groups.
187. Three different brands of tires were compared for wear characteristics. From each brand of tire, ten tires were
randomly selected and subjected to standard wear-testing procedures. The average mileage obtained for each brand of tire
and sample variances (both in 1,000 miles) are shown below.
Brand A
Brand B
Brand C
Average Mileage
37
38
33
Sample Variance
3
4
2
Show the complete ANOVA table for this problem.
188. Halls, Inc. has three stores located in three different areas. Random samples of the sales of the three stores (In
$1,000) are shown below.
Store 1
Store 2
Store 3
46
34
33
47
36
31
45
35
35
42
39
45
At a 5% level of significance, test to see if there is a significant difference in the average sales of the three stores.
MSTR= 162
189. In a completely randomized experimental design, 11 experimental units were used for each of the 4 treatments. Part
of the ANOVA table is shown below.
Source of Variation
Sum of
Squares
Degrees of
Freedom
Mean
Square
F
Between Treatments
1,500
_____?
_____?
_____?
Within Treatments (Error)
_____?
_____?
_____?
Total
5,500
Fill in the blanks in the above ANOVA table.
Squares
Freedom
Square
Between Treatments
1,500
500
5.00
Within Treatments (Error)
4,000
40
100
Total
5,500
43
190. Samples were selected from three populations. The data obtained are shown below.
Sample 1
Sample 2
Sample 3
10
16
15
13
14
15
12
13
16
13
14
14
16
10
17
Sample Mean ( )
12
15
14
Sample Variance ( )
2
2.4
5.5
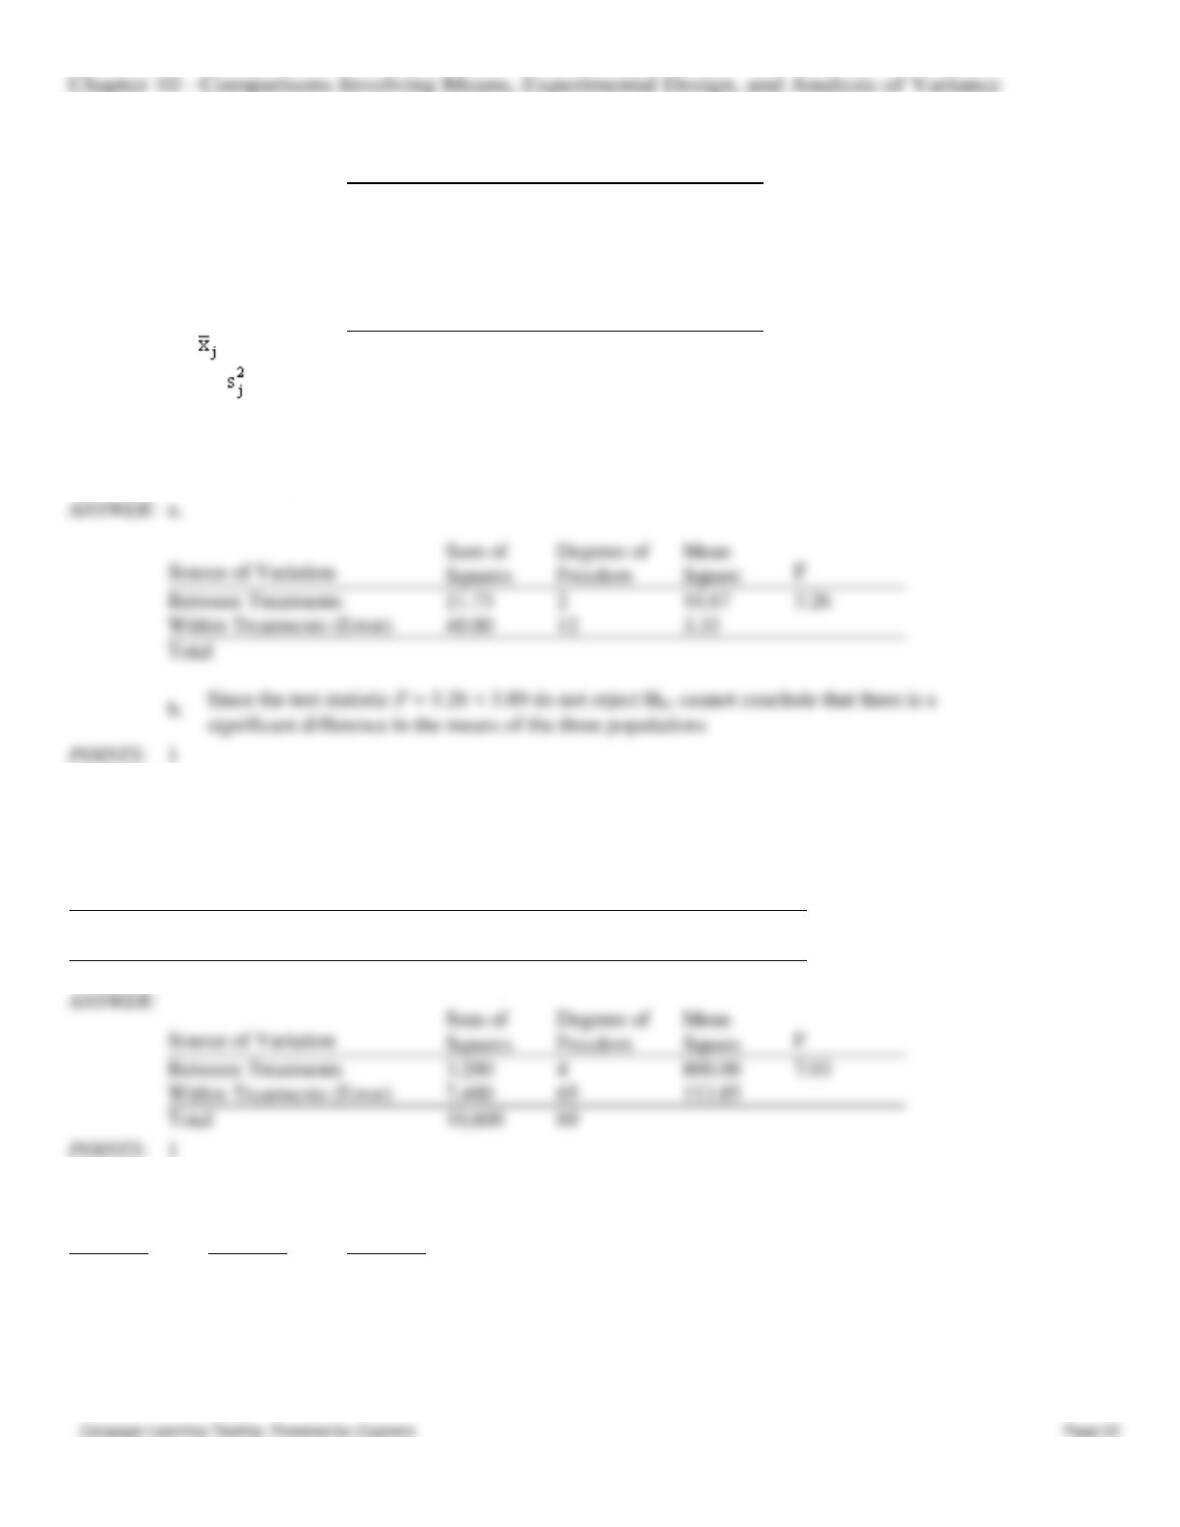
a.
Set up the ANOVA table for this problem.
b.
At a 5% level of significance test to determine whether there is a significant difference in the
means of the three populations.
Source of Variation
Sum of
Squares
Degrees of
Freedom
Mean
Square
F
Between Treatments
21.73
10.87
3.26
Within Treatments (Error)
40.00
12
3.33
Total
191. In a completely randomized experimental design, 14 experimental units were used for each of the 5 levels of the
factor (i.e., 5 treatments). Fill in the blanks in the following ANOVA table.
Source of Variation
Sum of
Squares
Degrees of
Freedom
Mean
Square
F
Between Treatments
_____?
_____?
800
_____?
Within Treatments (Error)
_____?
_____?
_____?
Total
10,600
_____?
Between Treatments
3,200
800.00
7.03
Within Treatments (Error)
7,400
65
113.85
Total
10,600
69
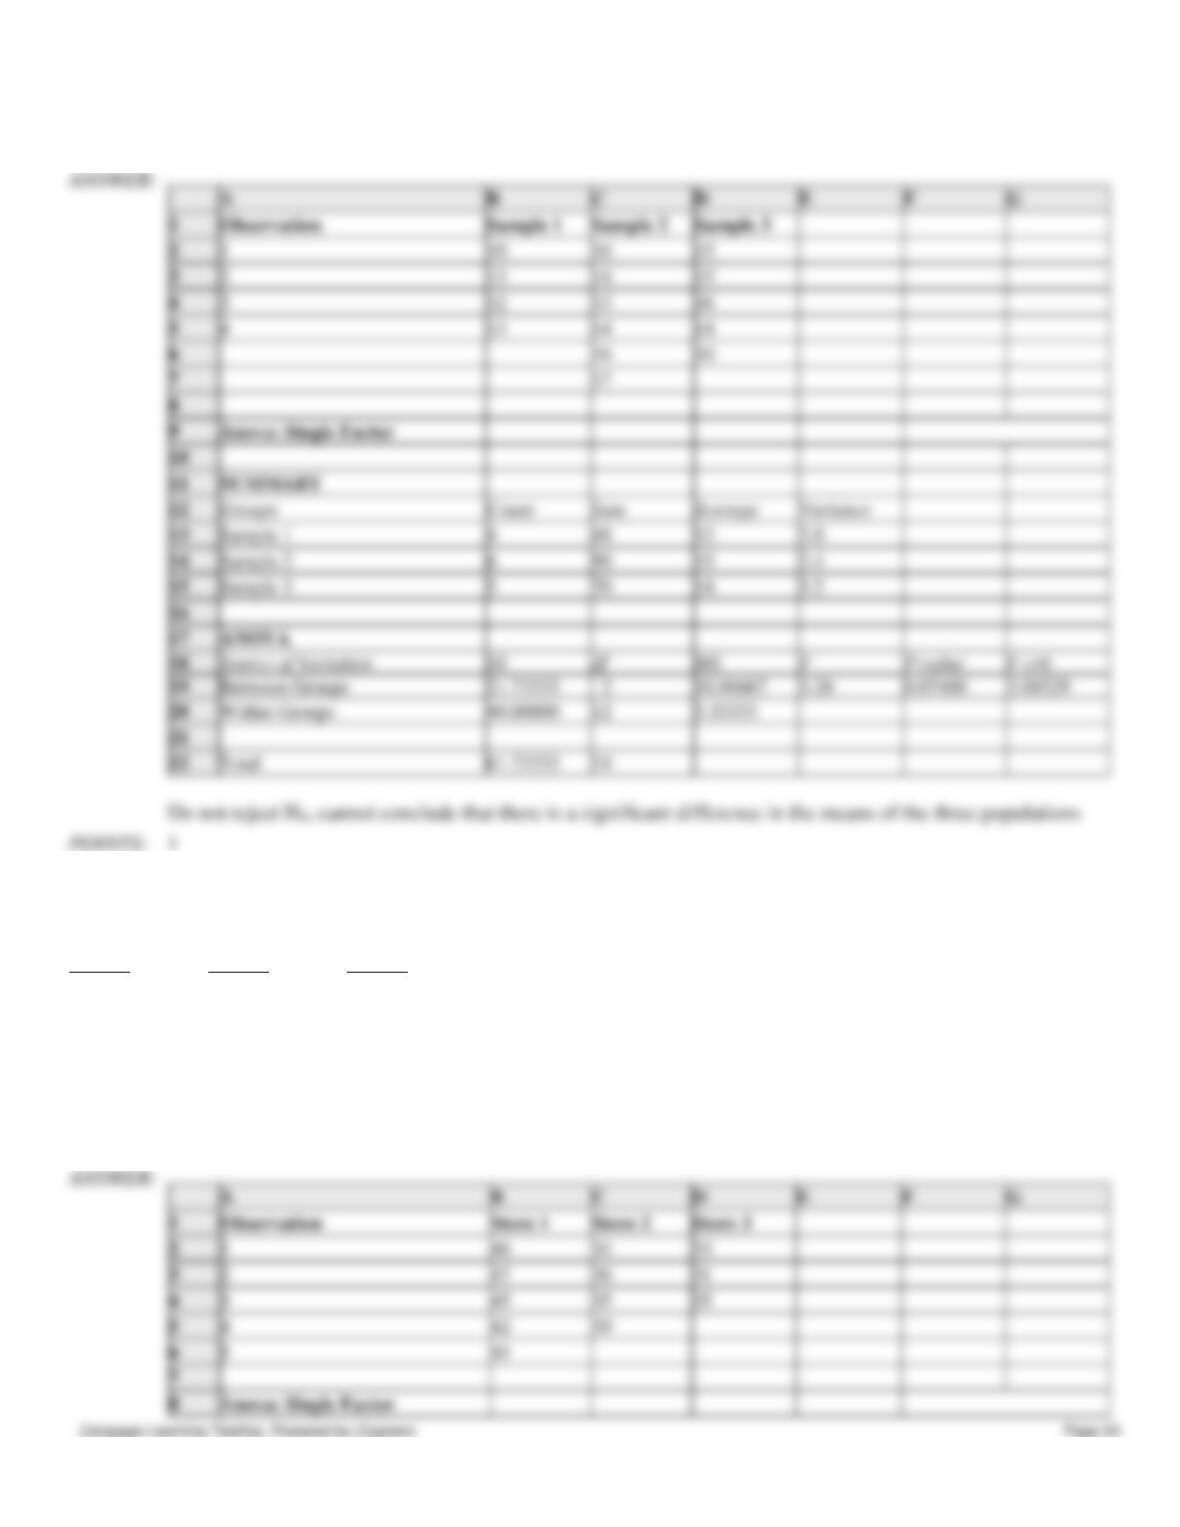
192. Samples were selected from three populations. The data obtained are shown below.
Sample 1
Sample 2
Sample 3
10
16
15
13
14
15
12
13
16
13
14
14
16
10
17
Chapter 10 – Comparisons Involving Means, Experimental Design, and Analysis of Variance
At a 5% level of significance, use Excel to test to determine whether there is a significant difference in the means of the
three populations.
193. Halls, Inc. has three stores located in three different areas. Random samples of the sales of the three stores (In
$1,000) are shown below.
Store 1
Store 2
Store 3
46
34
33
47
36
31
45
35
35
42
39
45
At a 5% level of significance, use Excel to test to see if there is a significant difference in the average sales of the three
stores.
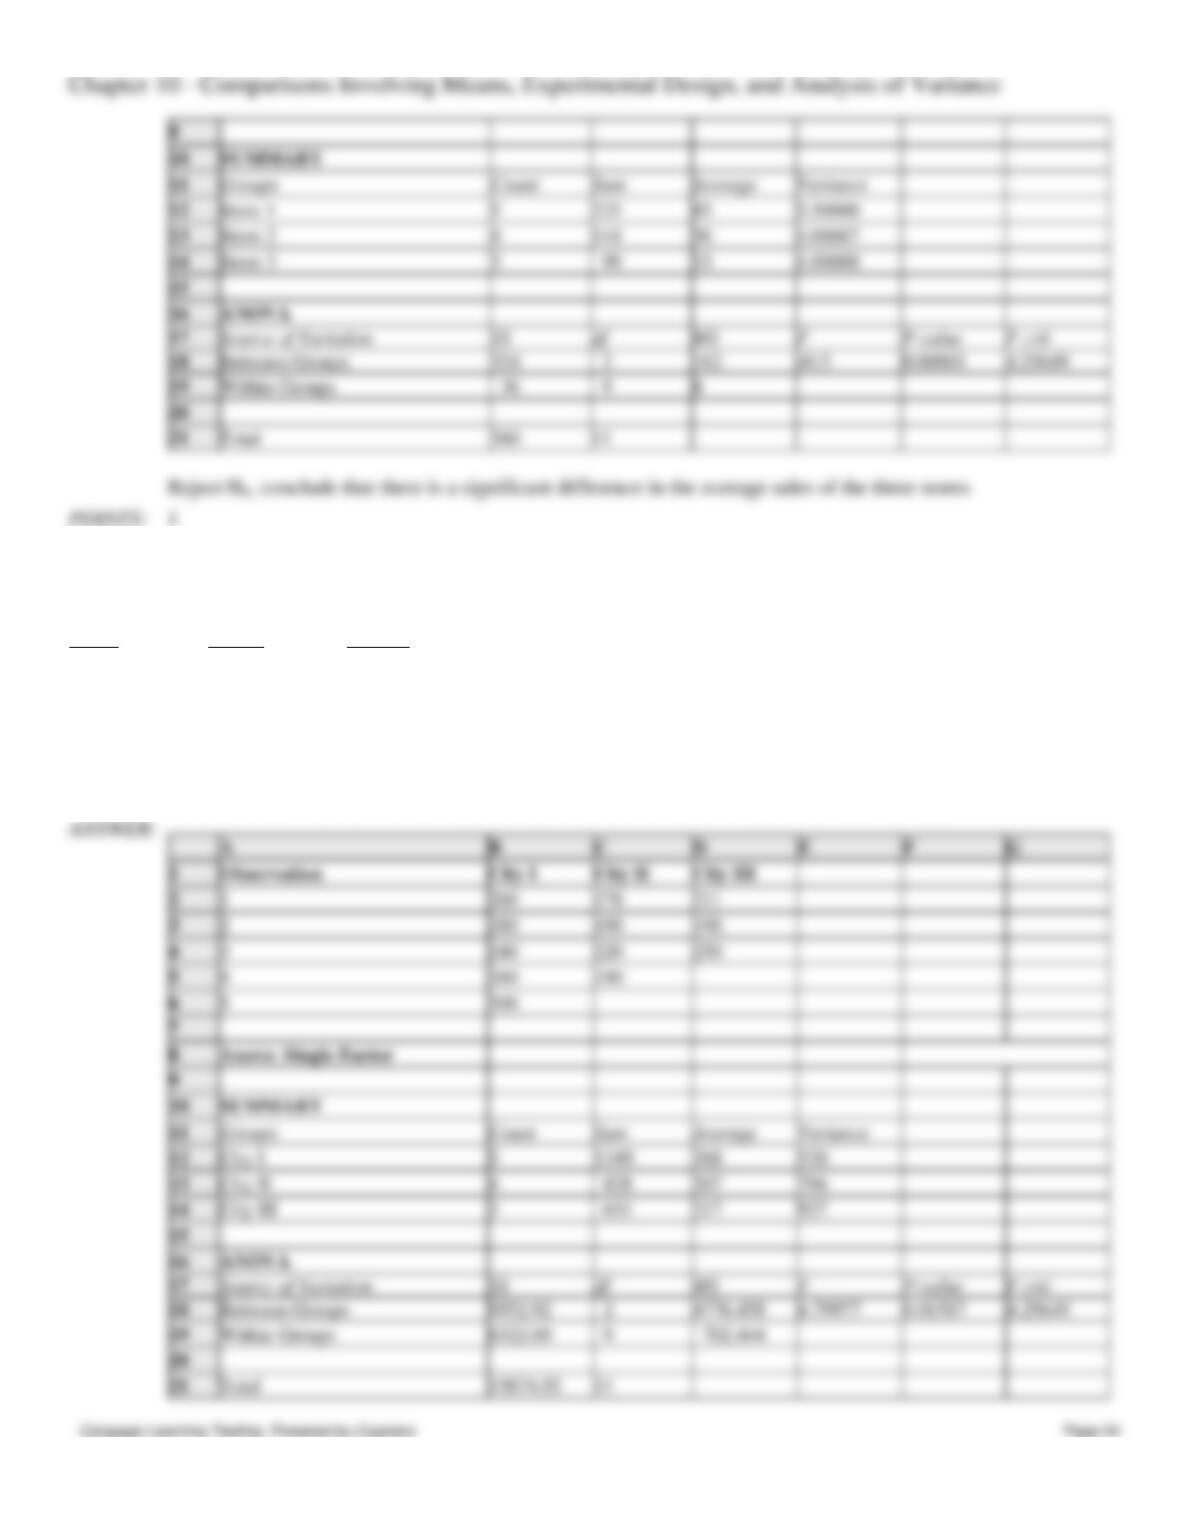
194. Random samples of individuals from three different cities were asked how much time they spend per day watching
television. The results (in minutes) for the three groups are shown below.
City I
City II
City III
260
178
211
280
190
190
240
220
250
260
240
300
At α = 0.05, use Excel to test to see if there is a significant difference in the averages of the three groups.
195. The three major automobile manufacturers have entered their cars in the Indianapolis 500 race. The speeds of the
tested cars are given below.
Manufacturer A
Manufacturer B
Manufacturer C
180
177
175
175
180
176
179
167
177
176
172
190
At α = .05, use Excel to test to see if there is a significant difference in the average speeds of the cars of the auto
manufacturers.
1
180
177
175
4
176
172
5
190
5
900
180
35.50000
3
528
176
Between Groups
42.00000
1.56198
0.26163
4.25649
242
26.88889
auto manufacturers
196. A dietician wants to see if there is any difference in the effectiveness of three diets. Eighteen people, comprising a
sample, were randomly assigned to the three diets. Below you are given the total amount of weight lost in a month by
each person.
Diet A
Diet B
Diet C
14
12
25
18
10
32
20
22
18
12
12
14
Chapter 10 – Comparisons Involving Means, Experimental Design, and Analysis of Variance
20
16
17
18
12
14
What would you advise the dietician about the effectiveness of the three diets? Use Excel and a .05 level of significance.
197. Individuals were randomly assigned to three different production processes. The hourly units of production for the
three processes are shown below.
Production Process
Process 1
Process 2
Process 3
33
33
28
30
35
36
28
30
30
29
38
34
Use Excel with α = 0.05 to determine if there is a significant difference in the mean hourly units of production for the
three types of production processes.