
Chapter 2
Descriptive Statistics: Tabular and
Graphical Displays
Learning Objectives
1. Learn how to construct and interpret summarization procedures for qualitative data such as:
frequency and relative frequency distributions, bar graphs and pie charts.
2. Learn how to construct and interpret tabular summarization procedures for quantitative data such as:
frequency and relative frequency distributions, cumulative frequency and cumulative relative
frequency distributions.
3. Learn how to construct a dot plot and a histogram as graphical summaries of quantitative data.
4. Learn how the shape of a data distribution is revealed by a histogram. Learn how to recognize when
a data distribution is negatively skewed, symmetric, and positively skewed.
5. Be able to use and interpret the exploratory data analysis technique of a stem-and-leaf display.
6. Learn how to construct and interpret cross tabulations, scatter diagrams, side–by-side and stacked bar
charts.
7. Learn best practices for creating effective graphical displays and for choosing the appropriate type of
display.
Solutions:
1.
Class
Frequency
Relative Frequency
A
60
60/120 = 0.50
B
24
24/120 = 0.20
C
36
36/120 = 0.30
120
1.00
2. a. 1 – (.22 + .18 + .40) = .20
b. .20(200) = 40
c/d.
Class
Frequency
Percent Frequency
A
.22(200) = 44
22
B
.18(200) = 36
18
C
.40(200) = 80
40
D
.20(200) = 40
20
Total
200
100
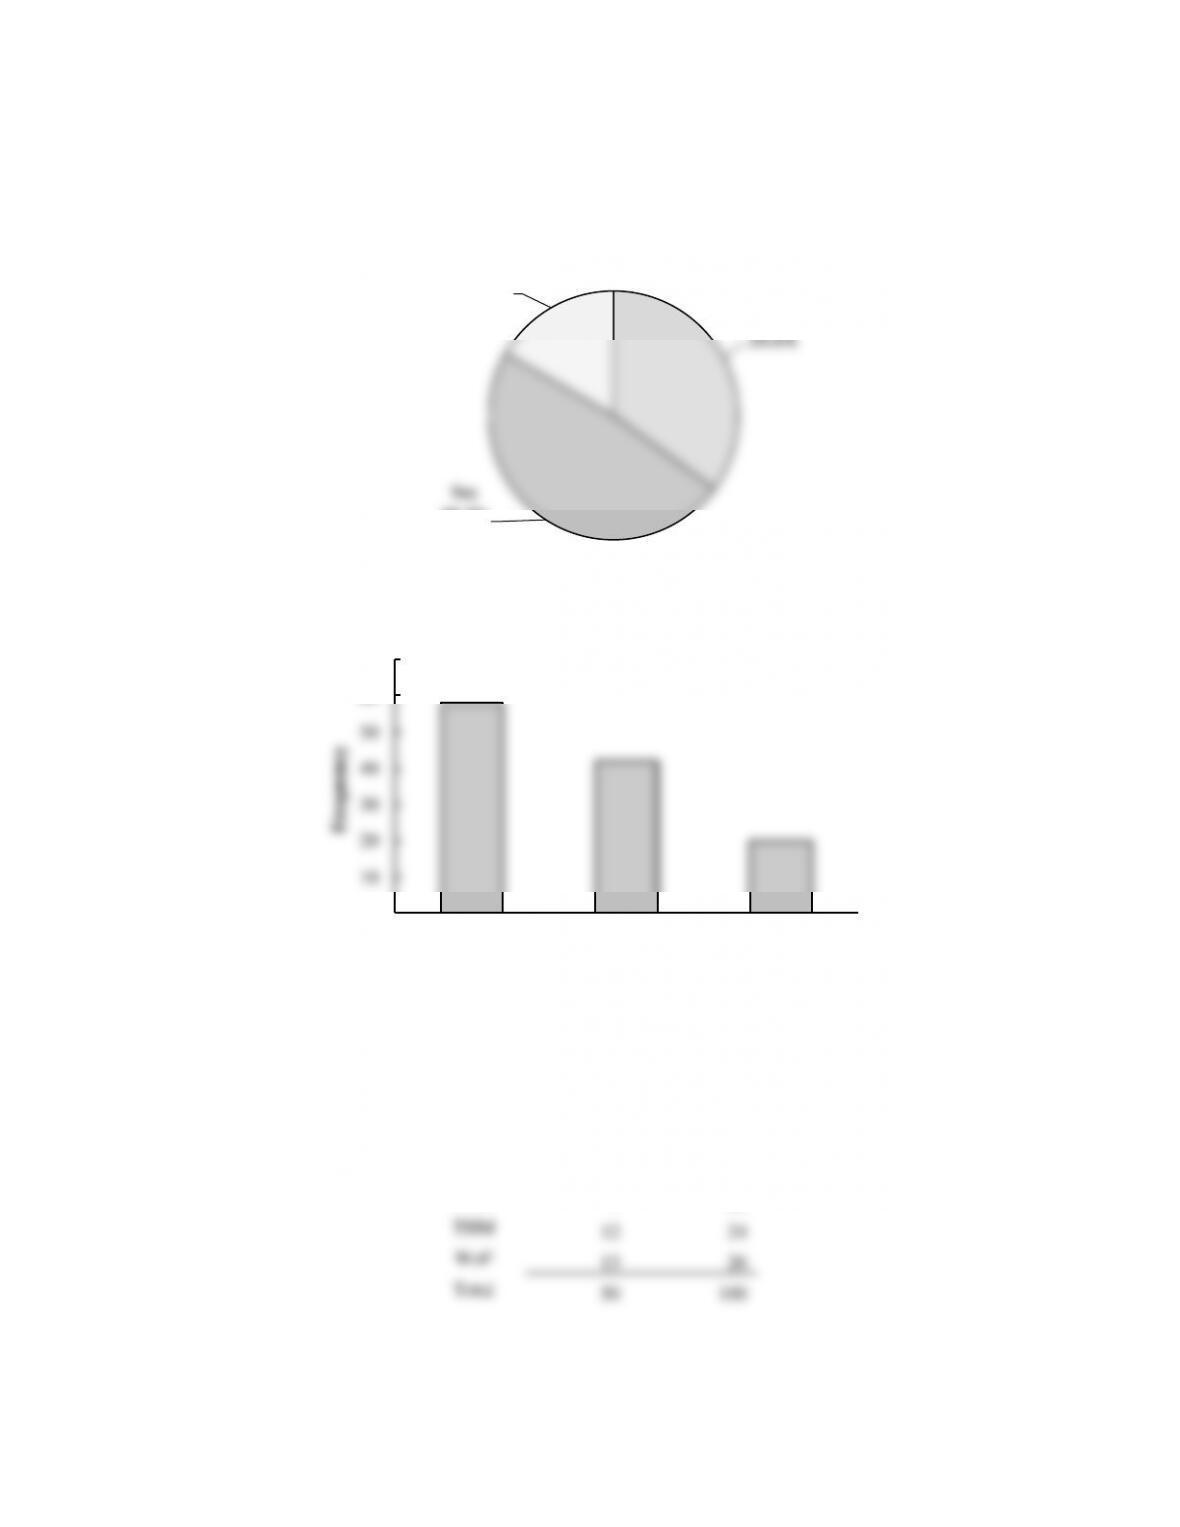
3. a. 360° x 58/120 = 174°
b. 360° x 42/120 = 126°
c.
d.
4. a. These data are categorical.
b.
Show
Relative
Frequency
% Frequency
Jep
10
20
JJ
8
16
OWS
7
14
THM
12
24
WoF
13
26
Total
50
No
35.0%
Yes
48.3%
No Opinion
16.7%
0
10
20
30
40
50
60
70
Yes No No Opinion
Frequency
Response
Men.
5. a.
b.
0
2
4
6
8
10
12
14
Jep JJ OWS THM WoF
Frequency
Syndicated Television Show
Jep
20%
JJ
16%
OWS
14%
THM
24%
WoF
26%
Syndicated Television Shows
Relative
Percent
Name
Frequency
Frequency
Frequency
Brown
7
0.14
14%
Johnson
10
0.20
20%
Jones
7
0.14
14%
Miller
6
0.12
12%
Smith
12
0.24
24%
Williams
8
0.16
16%
50
1
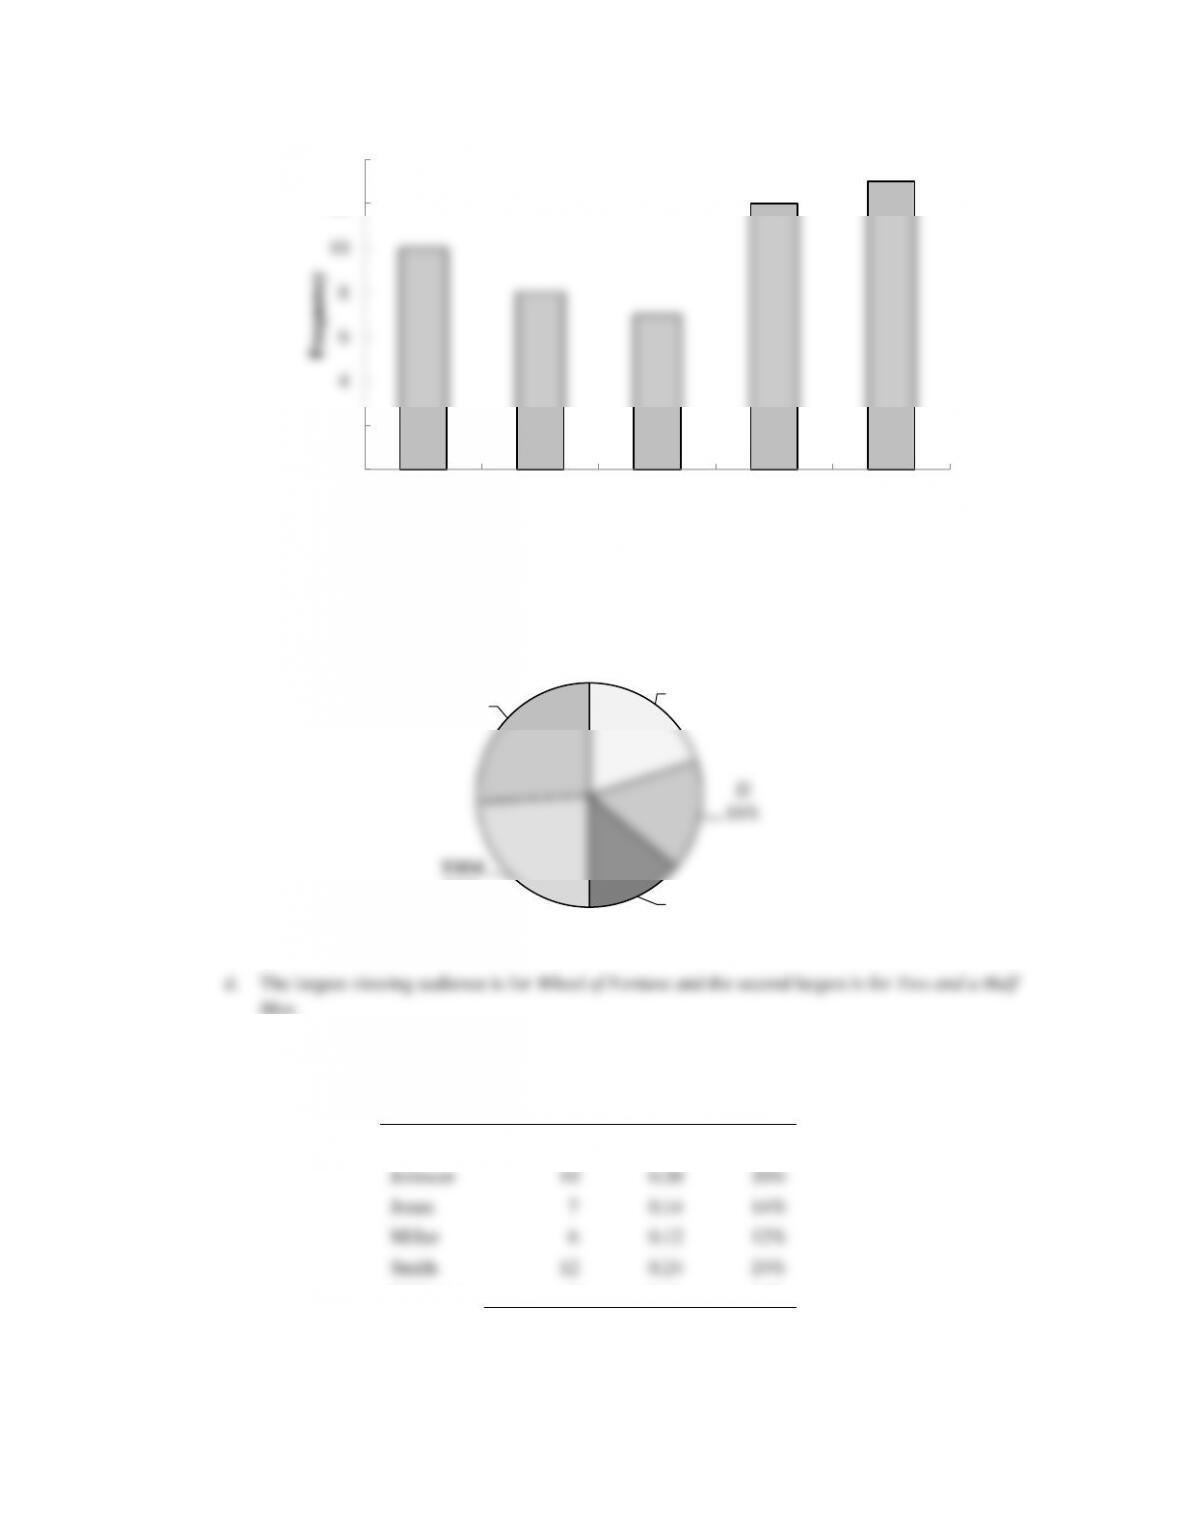
c.
d. The three most common last names are Smith (24%), Johnson (20%), Williams (16%5)
6. a.
Relative
Network
Frequency
% Frequency
ABC
6
24
CBS
9
36
FOX
1
4
NBC
9
36
0
2
4
6
8
10
12
14
Brown Johnson Jones Miller Smith Williams
Frequency
Name
Common U.S. Last Names
Brown
14%
Johnson
20%
Jones
14%
Miller
12%
Smith
24%
Williams
16%
Common U.S. Last Names
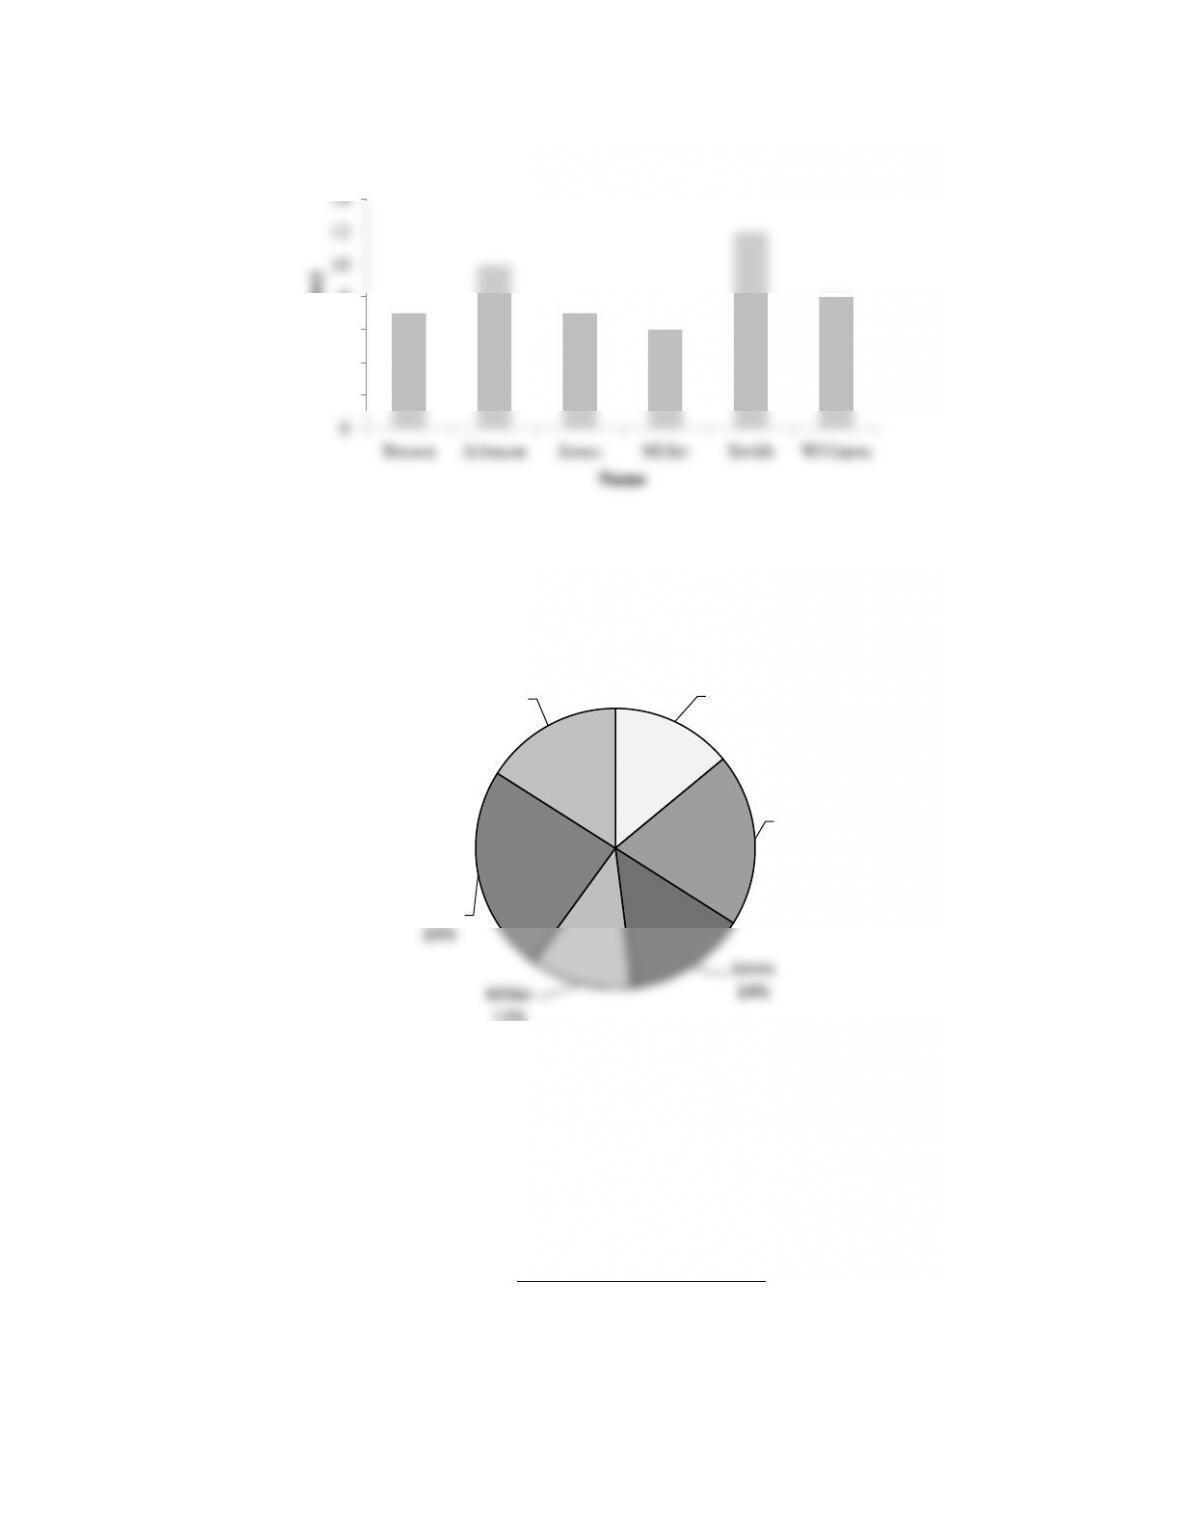
b. For these data, NBC and CBS tie for the number of top-rated shows. Each has 9 (36%) of the top 25.
ABC is third with 6 (24%) and the much younger FOX network has 1(4%).
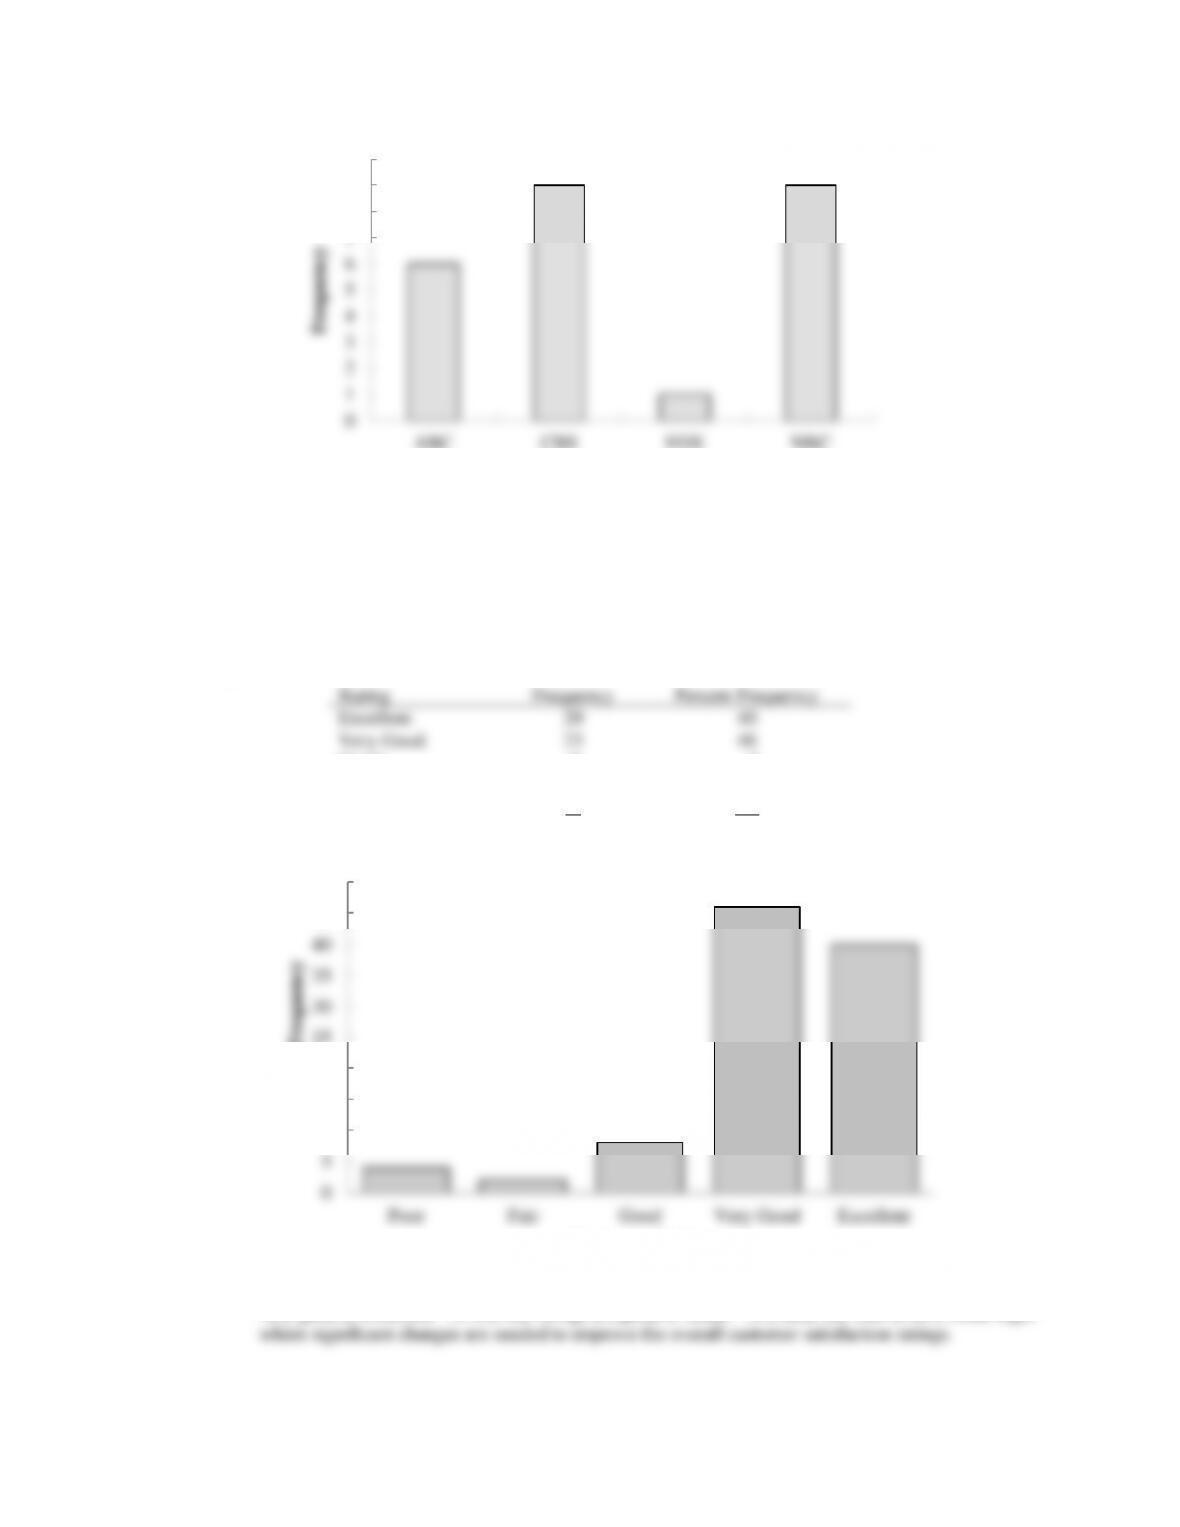
7. a.
Rating
Frequency
Percent Frequency
Excellent
20
40
Very Good
23
46
Good
4
8
Fair
1
2
Poor
2
4
50
100
Management should be very pleased with the survey results. 40% + 46% = 86% of the ratings are
very good to excellent. 94% of the ratings are good or better. This does not look to be a Delta flight
where significant changes are needed to improve the overall customer satisfaction ratings.
0
1
2
3
4
5
6
7
8
9
10
ABC CBS FOX NBC
Frequency
Network
0
5
10
15
20
25
30
35
40
45
50
Poor Fair Good Very Good Excellent
Percent Frequency
Customer Rating
b. While the overall ratings look fine, note that one customer (2%) rated the overall experience with the
flight as Fair and two customers (4%) rated the overall experience with the flight as Poor. It might
be insightful for the manager to review explanations from these customers as to how the flight failed
to meet expectations. Perhaps, it was an experience with other passengers that Delta could do little
to correct or perhaps it was an isolated incident that Delta could take steps to correct in the future.
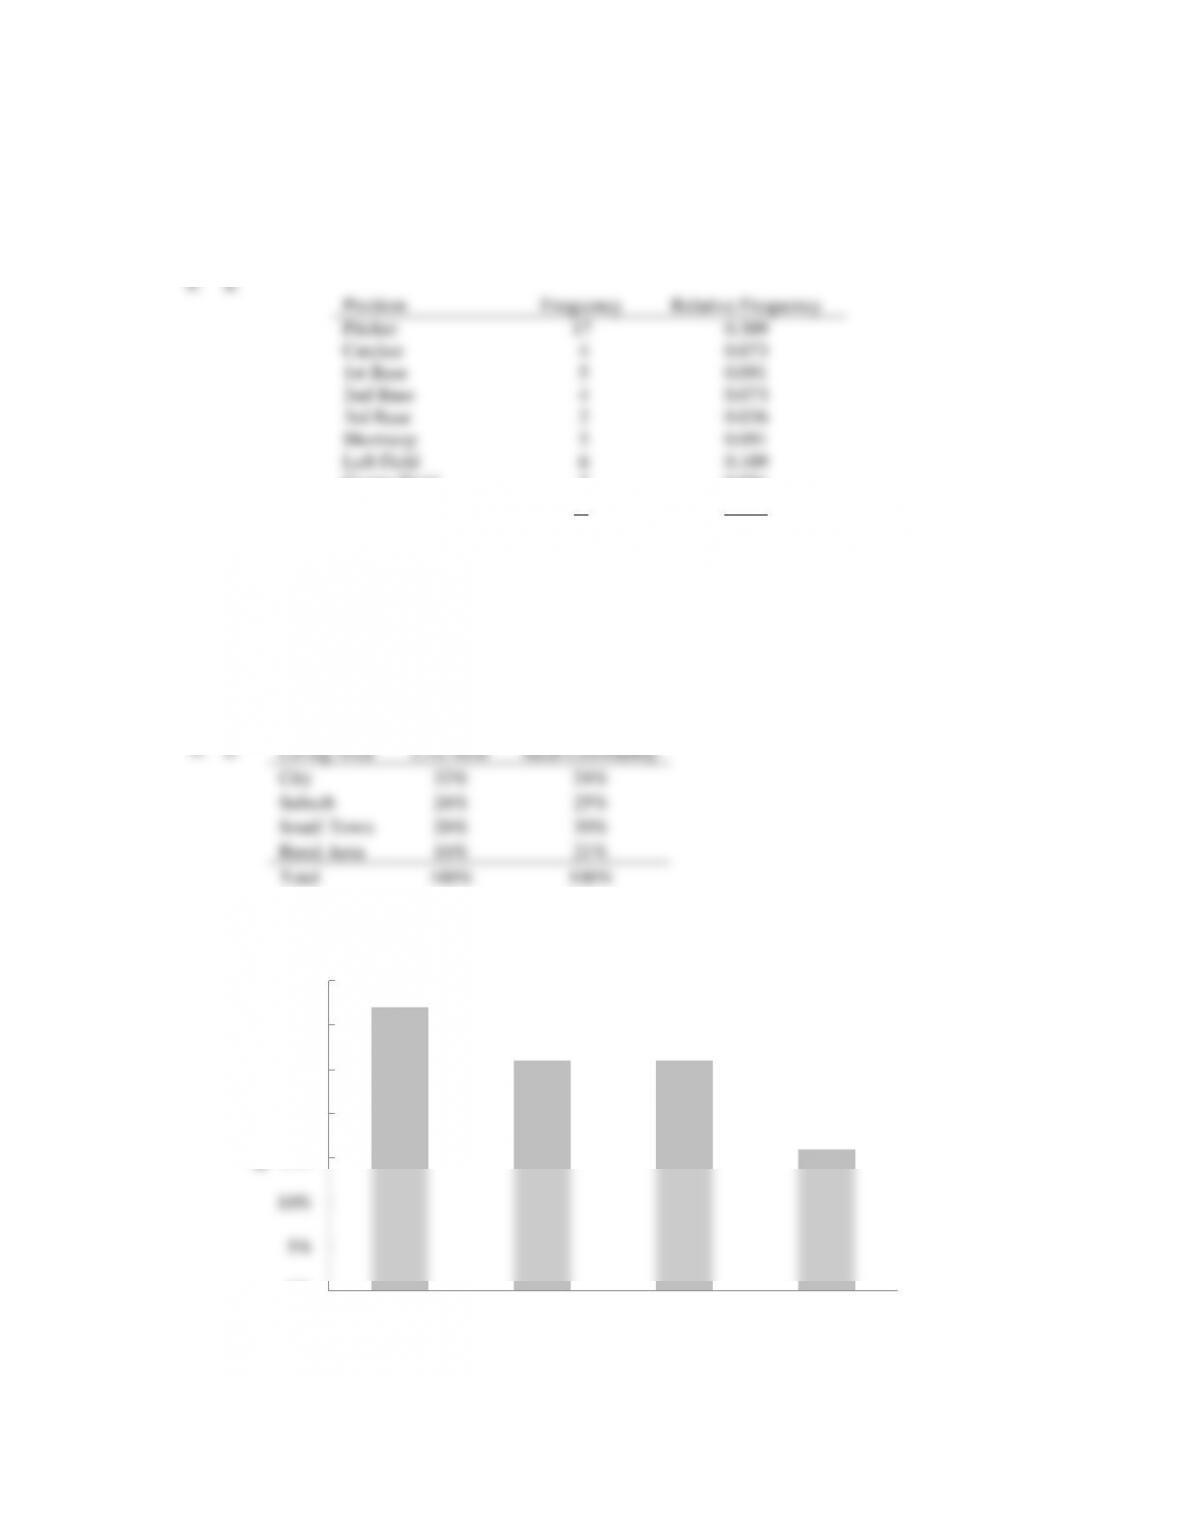
Position
Frequency
Relative Frequency
Pitcher
17
0.309
Catcher
4
0.073
1st Base
5
0.091
2nd Base
4
0.073
3rd Base
2
0.036
Shortstop
5
0.091
Left Field
6
0.109
Center Field
5
0.091
Right Field
7
0.127
55
1.000
b. Pitchers (Almost 31%)
c. 3rd Base (3 – 4%)
d. Right Field (Almost 13%)
e. Infielders (16 or 29.1%) to Outfielders (18 or 32.7%)
9. a.
City
Suburb
Small Town
Rural Area
b. Where do you live now?
0%
5%
10%
15%
20%
25%
30%
35%
City Suburb Small Town Rural Area
Percent
Living Area
Living Area
Live Now
Ideal Community
Total
100%
100%
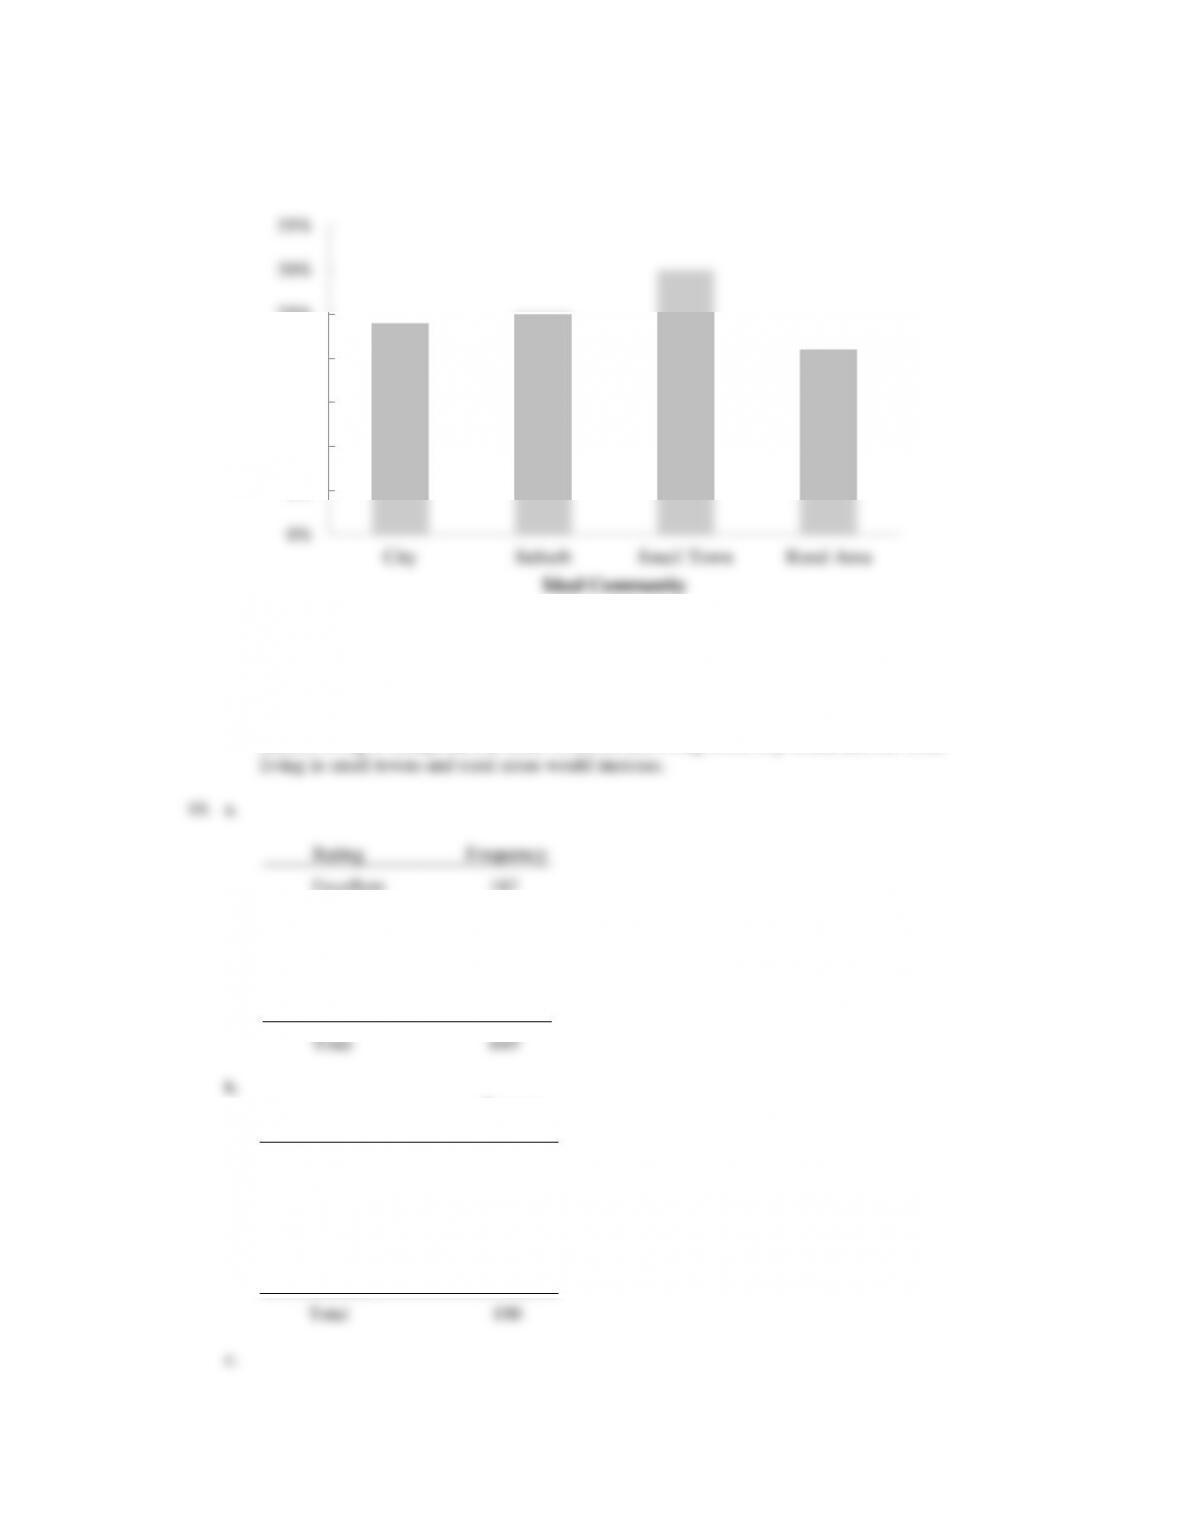
What do you consider the ideal community?
c. Most adults are now living in a city (32%).
d. Most adults consider the ideal community a small town (30%).
e. Percent changes by living area: City –8%, Suburb –1%, Small Town +4%, and Rural Area +5%.
Suburb living is steady, but the trend would be that living in the city would decline while
Rating
Frequency
Excellent
187
Very Good
252
Average
107
Poor
62
Terrible
41
Total
649
Rating
Percent
Frequency
Excellent
29
Very Good
39
Average
16
Poor
10
Terrible
Total
0%
5%
10%
15%
20%
25%
30%
35%
City Suburb Small Town Rural Area
Percent
Ideal Community
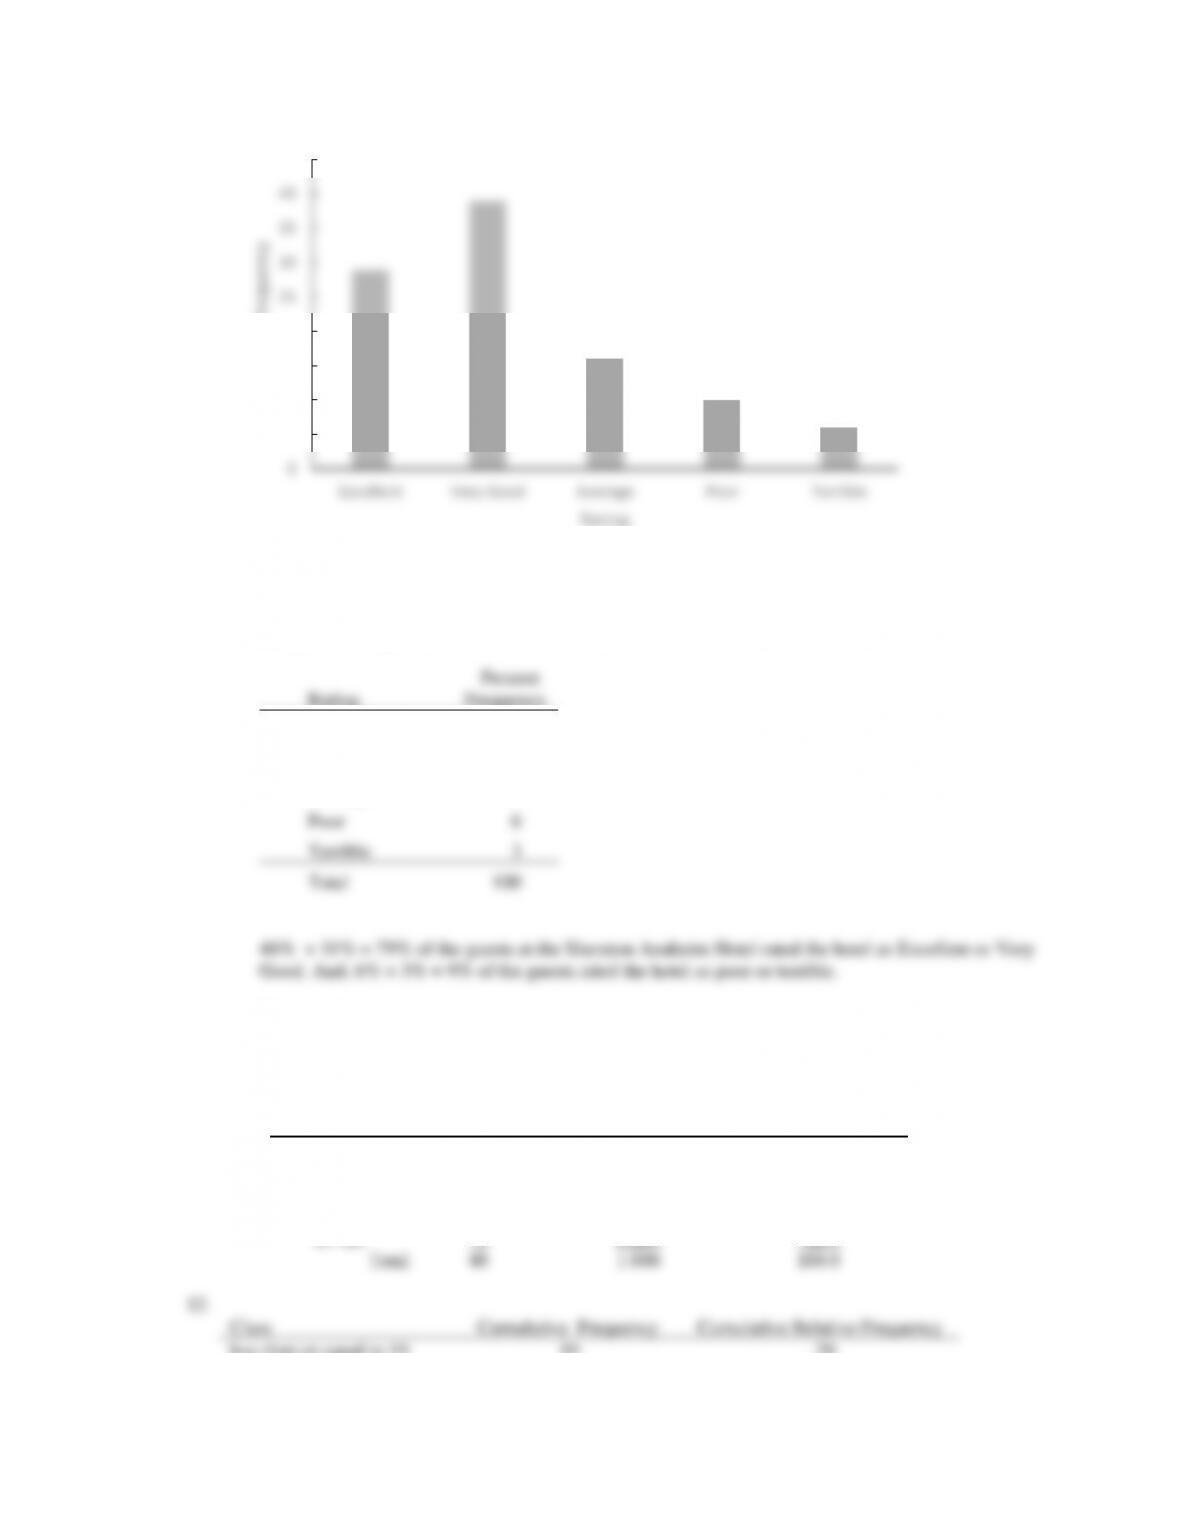
d. 29% + 39% = 68% of the guests at the Sheraton Anaheim Hotel rated the hotel as Excellent or Very
Good. But, 10% + 6% = 16% of the guests rated the hotel as poor or terrible.
e. The percent frequency distribution for Disney’s Grand Californian follows:
Rating
Percent
Frequency
Excellent
48
Very Good
31
Average
12
Poor
6
Terrible
3
Total
100
48% + 31% = 79% of the guests at the Sheraton Anaheim Hotel rated the hotel as Excellent or Very
Good. And, 6% + 3% = 9% of the guests rated the hotel as poor or terrible.
Compared to ratings of other hotels in the same region, both of these hotels received very favorable
ratings. But, in comparing the two hotels, guests at Disney’s Grand Californian provided somewhat
better ratings than guests at the Sheraton Anaheim Hotel.
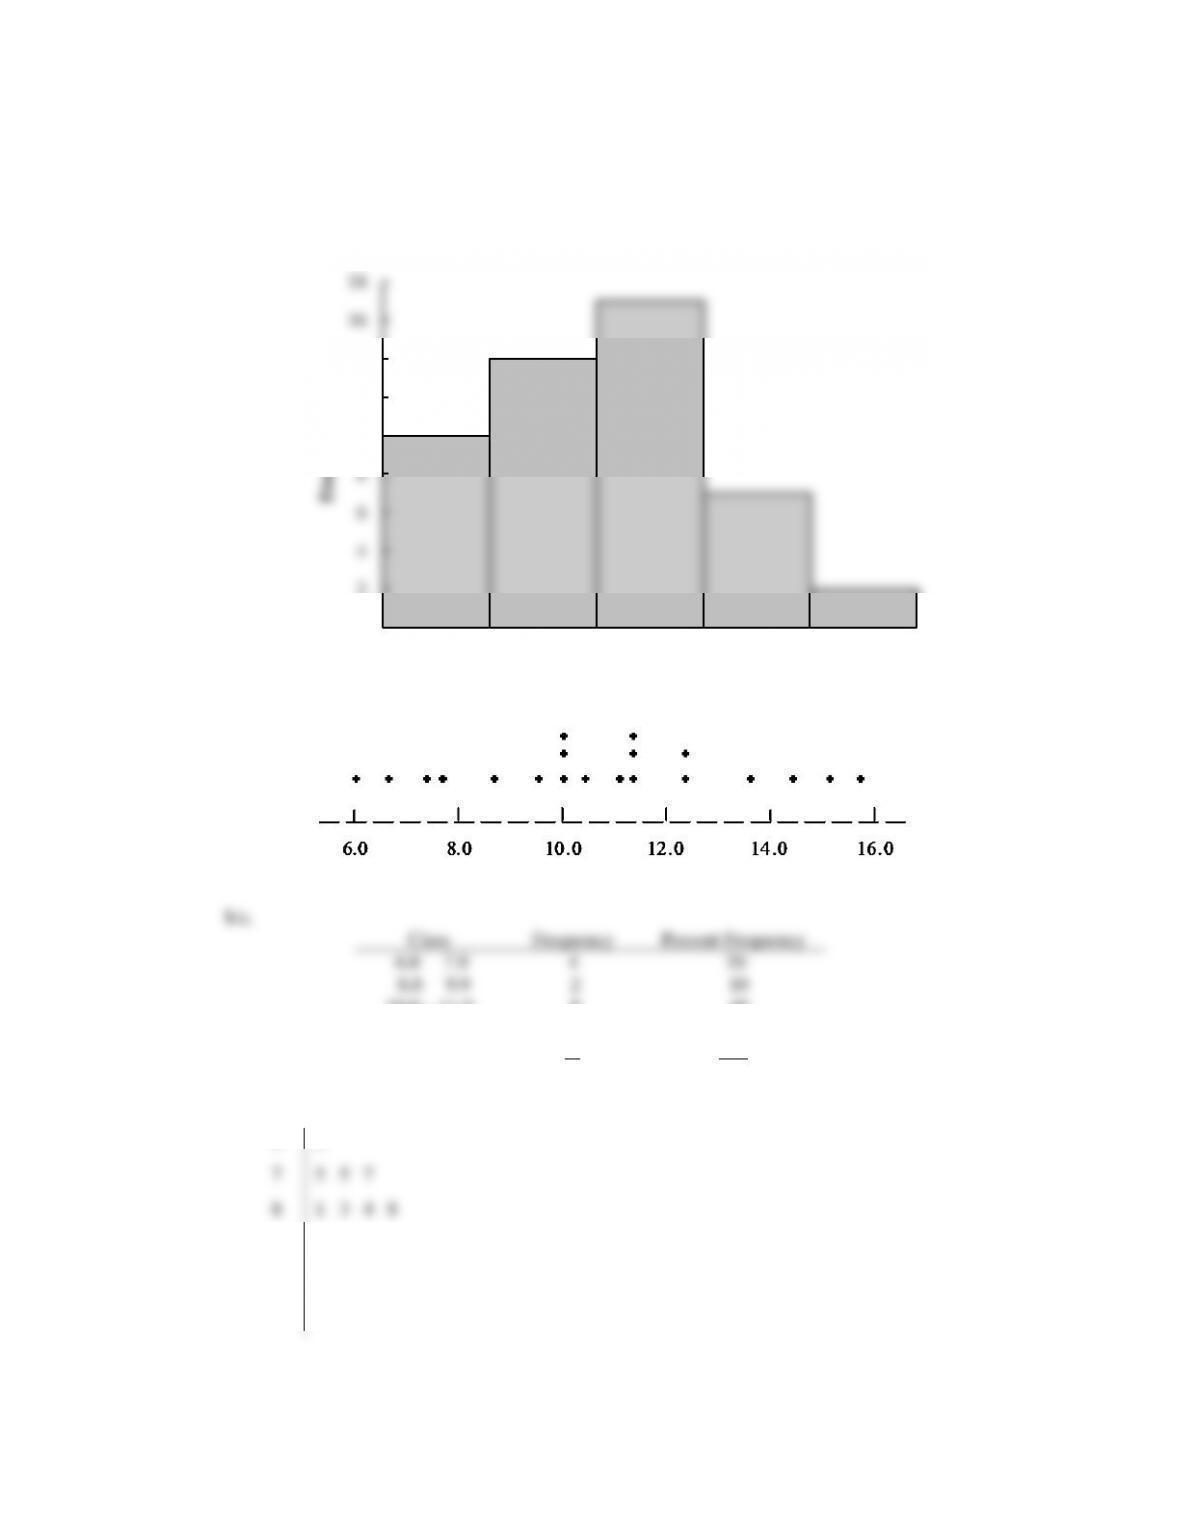
11.
Class
Frequency
Relative Frequency
Percent Frequency
12–14
2
0.050
5.0
15–17
8
0.200
20.0
18–20
11
0.275
27.5
21–23
10
0.250
25.0
24–26
9
0.225
22.5
Total
40
1.000
100.0
0
5
10
15
20
25
30
35
40
45
Excellent Very Good Average Poor Terrible
Percent Frequency
Rating
less than or equal to 39
41
.82
less than or equal to 49
48
.96
less than or equal to 59
50
1.00
13.
14. a.
0
2
4
6
8
10
12
14
16
18
10-19 20-29 30-39 40-49 50-59
Frequency

16. Leaf Unit = 10
11
6
12
0 2
13
0 6 7
14
2 2 7
15
5
16
0 2 8
17
0 2 3
17. a/b.
Waiting Time
Frequency
Relative Frequency
0 – 4
4
0.20
5 – 9
8
0.40
10 – 14
5
0.25
15 – 19
2
0.10
20 – 24
1
0.05
Totals
20
1.00
c/d.
Waiting Time
Cumulative Frequency
Cumulative Relative Frequency
Less than or equal to 4
4
0.20
Less than or equal to 9
12
0.60
Less than or equal to 14
17
0.85
Less than or equal to 19
19
0.95
Less than or equal to 24
20
1.00
e. 12/20 = 0.60