Chapter 10
Comparisons Involving Means, Experimental Design,
and Analysis of Variance
Case Problem 1: Par, Inc.
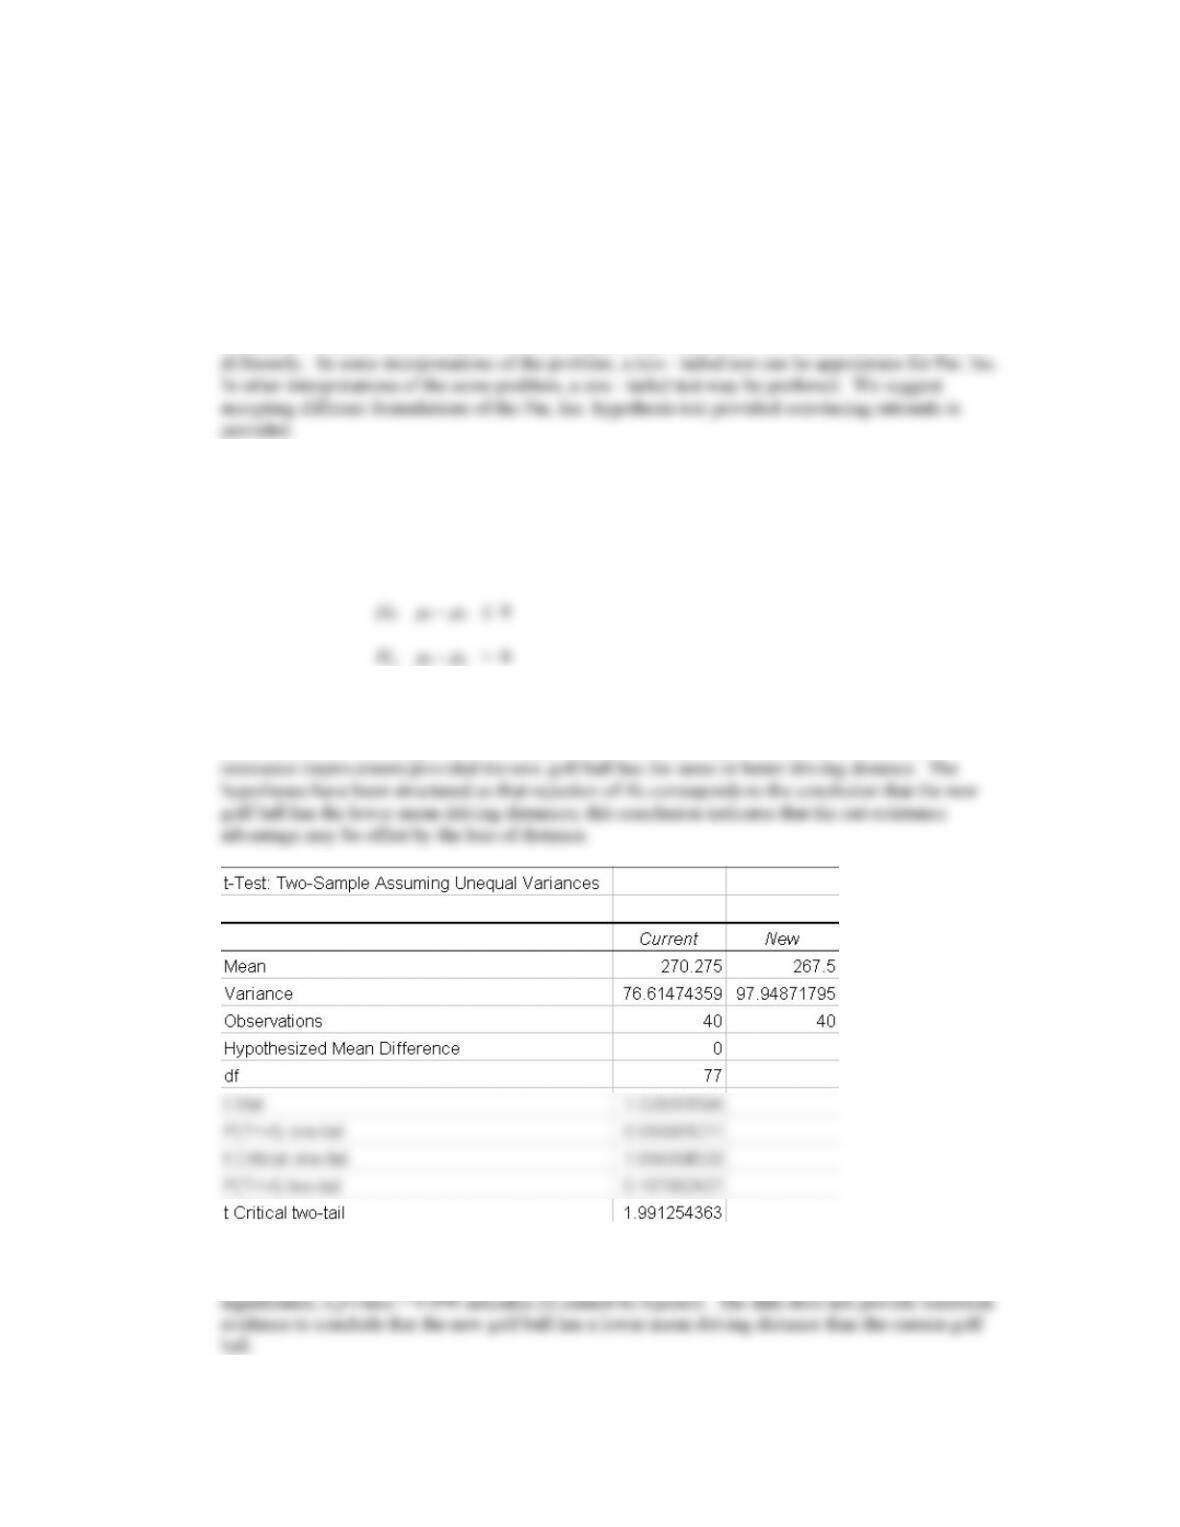
This case can provide discussion and differing opinions as to what hypothesis test should be
conducted. Students should begin to see that logical arguments exist for structuring the hypotheses
Letting
1 = the population mean for the current golf ball
2 = the population mean for the new golf ball,
we suggest the following hypothesis test:
This formulation is based on the information that the new golf ball is being designed to “resist cuts
and yet still offer good driving distances.” The research hypothesis is not to prove the new golf ball
out distances the current golf ball. In fact, Par could claim an improved quality with the cut
The sample mean for the current golf ball was 270.275 and the sample mean for the new golf ball
was 267.50. On average, the current golf ball had a 2.775 yard advantage. Using the .05 level of
The argument should be made that in failing to reject H0, the research findings are inconclusive.
While the data do not show the new golf ball with a significantly lower mean driving distance, the
researcher should not be ready to conclude the mean distance for the new golf ball is equal to or
Case Problem 2: Wentworth Medical Center
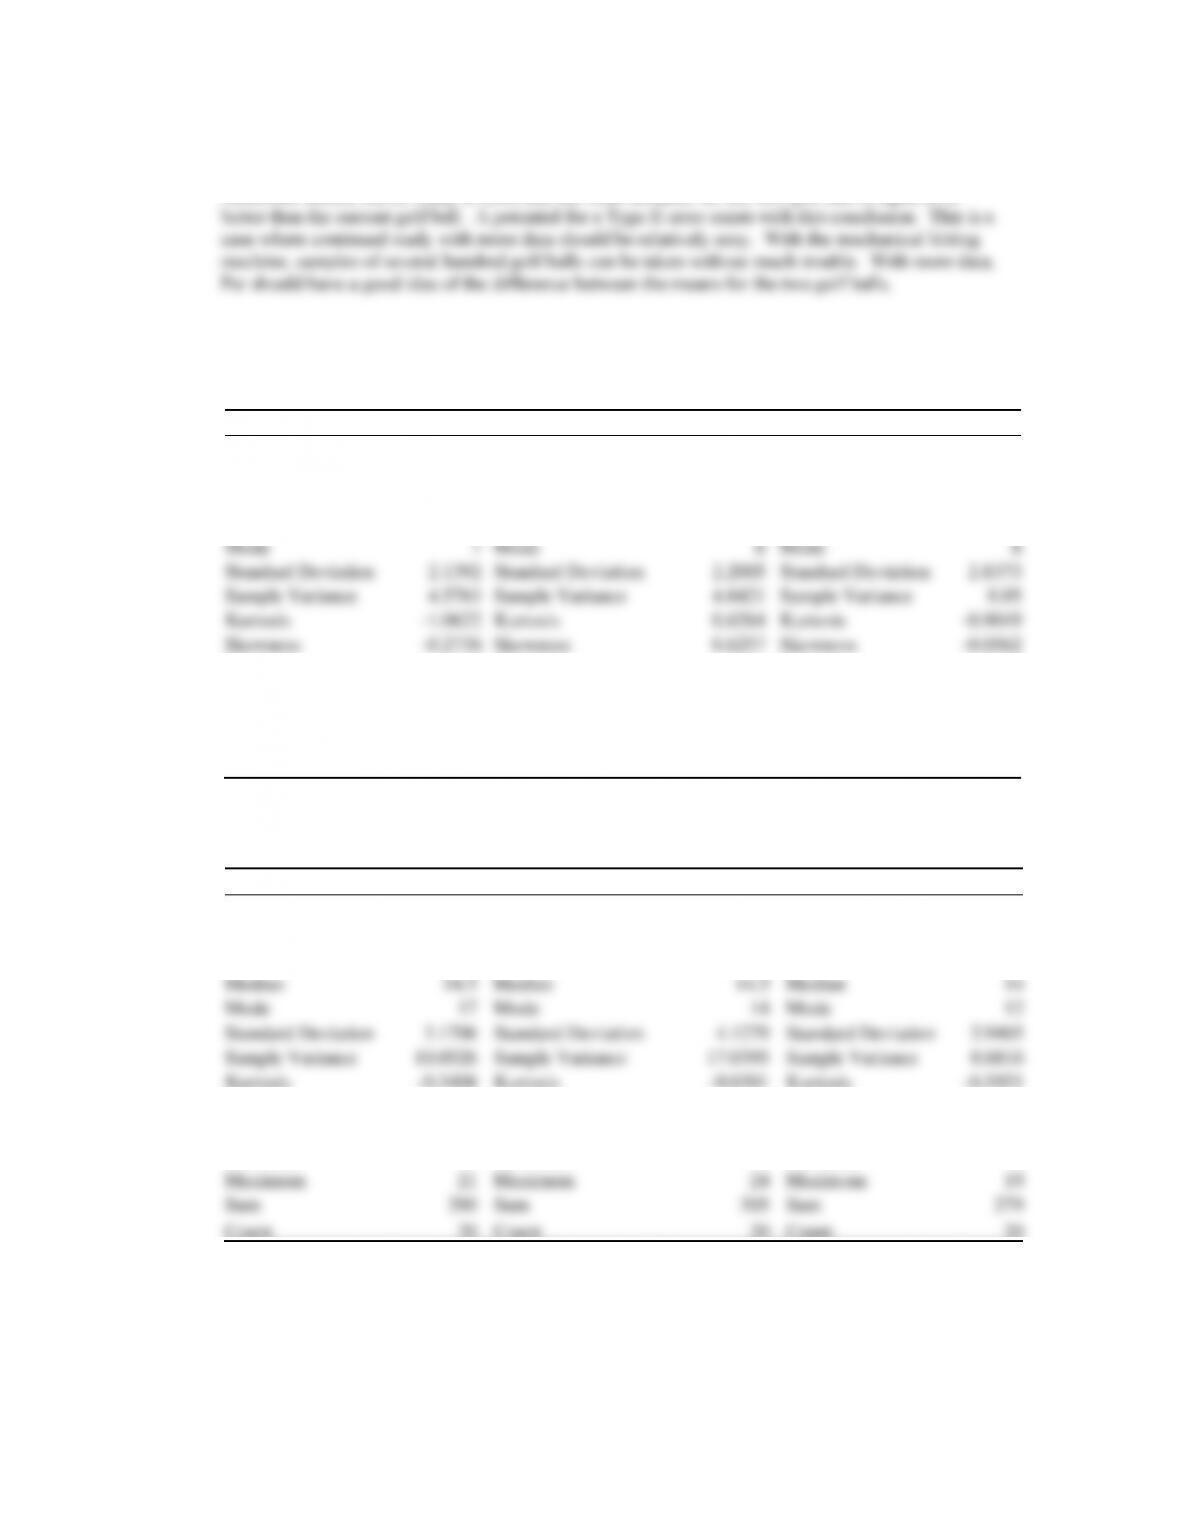
1. Descriptive statistics for the individuals in reasonably good health (Medical1) are shown below:
Florida
New York
North Carolina
Mean
5.55
Mean
8
Mean
7.05
Standard Error
0.4783
Standard Error
0.4920
Standard Error
0.6344
Median
6
Median
8
Median
7.5
Mode
7
Mode
8
Mode
8
Standard Deviation
2.1392
Standard Deviation
2.2005
Standard Deviation
2.8373
Sample Variance
4.5763
Sample Variance
4.8421
Sample Variance
8.05
Kurtosis
-1.0622
Kurtosis
0.6264
Kurtosis
-0.9049
Skewness
-0.2736
Skewness
0.6257
Skewness
-0.0562
Range
7
Range
9
Range
9
Minimum
2
Minimum
4
Minimum
3
Maximum
9
Maximum
13
Maximum
12
Sum
111
Sum
160
Sum
141
Count
20
Count
20
Count
20
Descriptive statistics for the individuals who had a chronic health condition (Medical2) are shown
below:
Florida
New York
North Carolina
Mean
14.5
Mean
15.25
Mean
13.95
Standard Error
0.7090
Standard Error
0.9230
Standard Error
0.6588
Median
14.5
Median
14.5
Median
14
Mode
17
Mode
14
Mode
12
Standard Deviation
3.1706
Standard Deviation
4.1279
Standard Deviation
2.9465
Sample Variance
10.0526
Sample Variance
17.0395
Sample Variance
8.6816
Kurtosis
-0.3408
Kurtosis
-0.0301
Kurtosis
-0.5921
Skewness
0.2807
Skewness
0.5254
Skewness
-0.0417
Range
12
Range
15
Range
11
Minimum
9
Minimum
9
Minimum
8
Maximum
21
Maximum
24
Maximum
19
Sum
290
Sum
305
Sum
279
Count
20
Count
20
Count
20
The depression levels for the individuals who had a chronic health condition are, on average, much
higher than the depression levels of individuals in reasonably good health.

2. The hypotheses for both studies are as follows:
Ho:
FL NY NC
==
Ha: Not all population means are equal.
The analysis of variance results for individuals in reasonably good health (Medical1) are shown
below:
Anova: Single Factor
SUMMARY
Groups
Count
Sum
Average
Variance
Florida
20
111
5.55
4.576316
New York
20
160
8
4.842105
North Carolina
20
141
7.05
8.05
ANOVA
Source of Variation
SS
df
MS
F
P-value
F crit
Between Groups
61.03333
2
30.51667
5.240886
0.00814
3.158846
Within Groups
331.9
57
5.822807
Total
392.9333
59
The p-value of .008 supports the conclusion that the mean depression scores are not the same for the
three states.
The analysis of variance results for the individuals who had a chronic health condition
(MEDICAL2) are shown below:
Anova: Single Factor
SUMMARY
Groups
Count
Sum
Average
Variance
Florida
20
290
14.5
10.05263
New York
20
305
15.25
17.03947
North Carolina
20
279
13.95
8.681579
ANOVA
Source of Variation
SS
df
MS
F
P-value
F crit
Between Groups
17.03333
2
8.516667
0.714212
0.493906
3.158846
Within Groups
679.7
57
11.92456
Total
696.7333
59
At the 5% level of significance there does not appear to be any significant difference in the mean
depression scores among the three states.