Solutions to
Case Problems
Chapter 2
Descriptive Statistics: Tabular and Graphical Displays
Case Problem 1: Pelican Stores
1. There were 70 Promotional customers and 30 Regular customers. Because there are 100
observations in the sample, the frequency and percent frequency distribution are the same. Percent
frequency distributions for many of the variables are given.
No. of Items
Percent Frequency
1
29
2
27
3
10
4
10
5
9
6
7
7 or more
8
Total:
100
Net Sales
Percent Frequency
0.00 – 24.99
9
25.00 – 49.99
30
50.00 – 74.99
25
75.00 – 99.99
10
100.00 – 124.99
12
125.00 – 149.99
4
150.00 – 174.99
3
175.00 – 199.99
3
200 or more
4
Total:
100
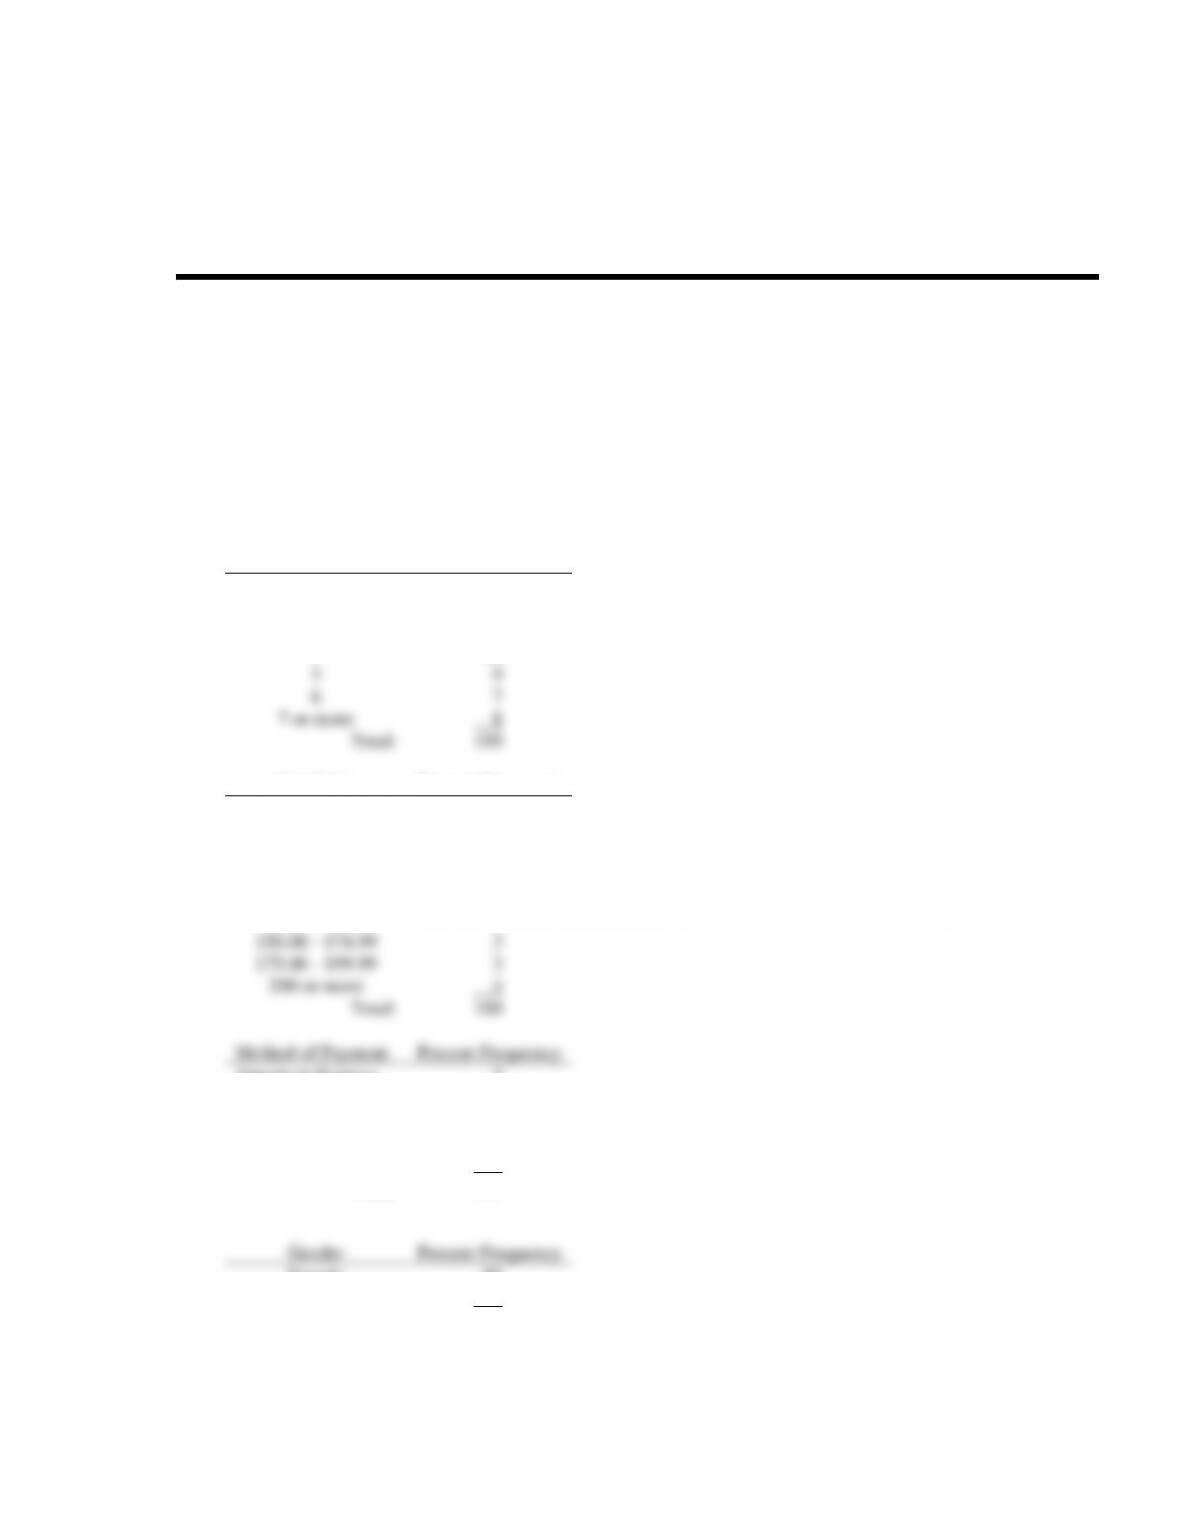
Method of Payment
Percent Frequency
American Express
2
Discover
4
MasterCard
14
Proprietary Card
70
Visa
10
Total:
100
Gender
Percent Frequency
Female
93
Male
7
Total:
100
Marital Status
Percent Frequency
Married
84
Single
16
Total:
100
Age
Percent Frequency
20 – 29
10
30 – 39
30
40 – 49
33
50 – 59
16
60 – 69
7
70 – 79
4
Total:
100
• The percent frequency distribution of net sales shows that 61% of the customers spent $50 or
more.
• Customers are distributed across all adult age groups.
• The overwhelming majority of customers are female.
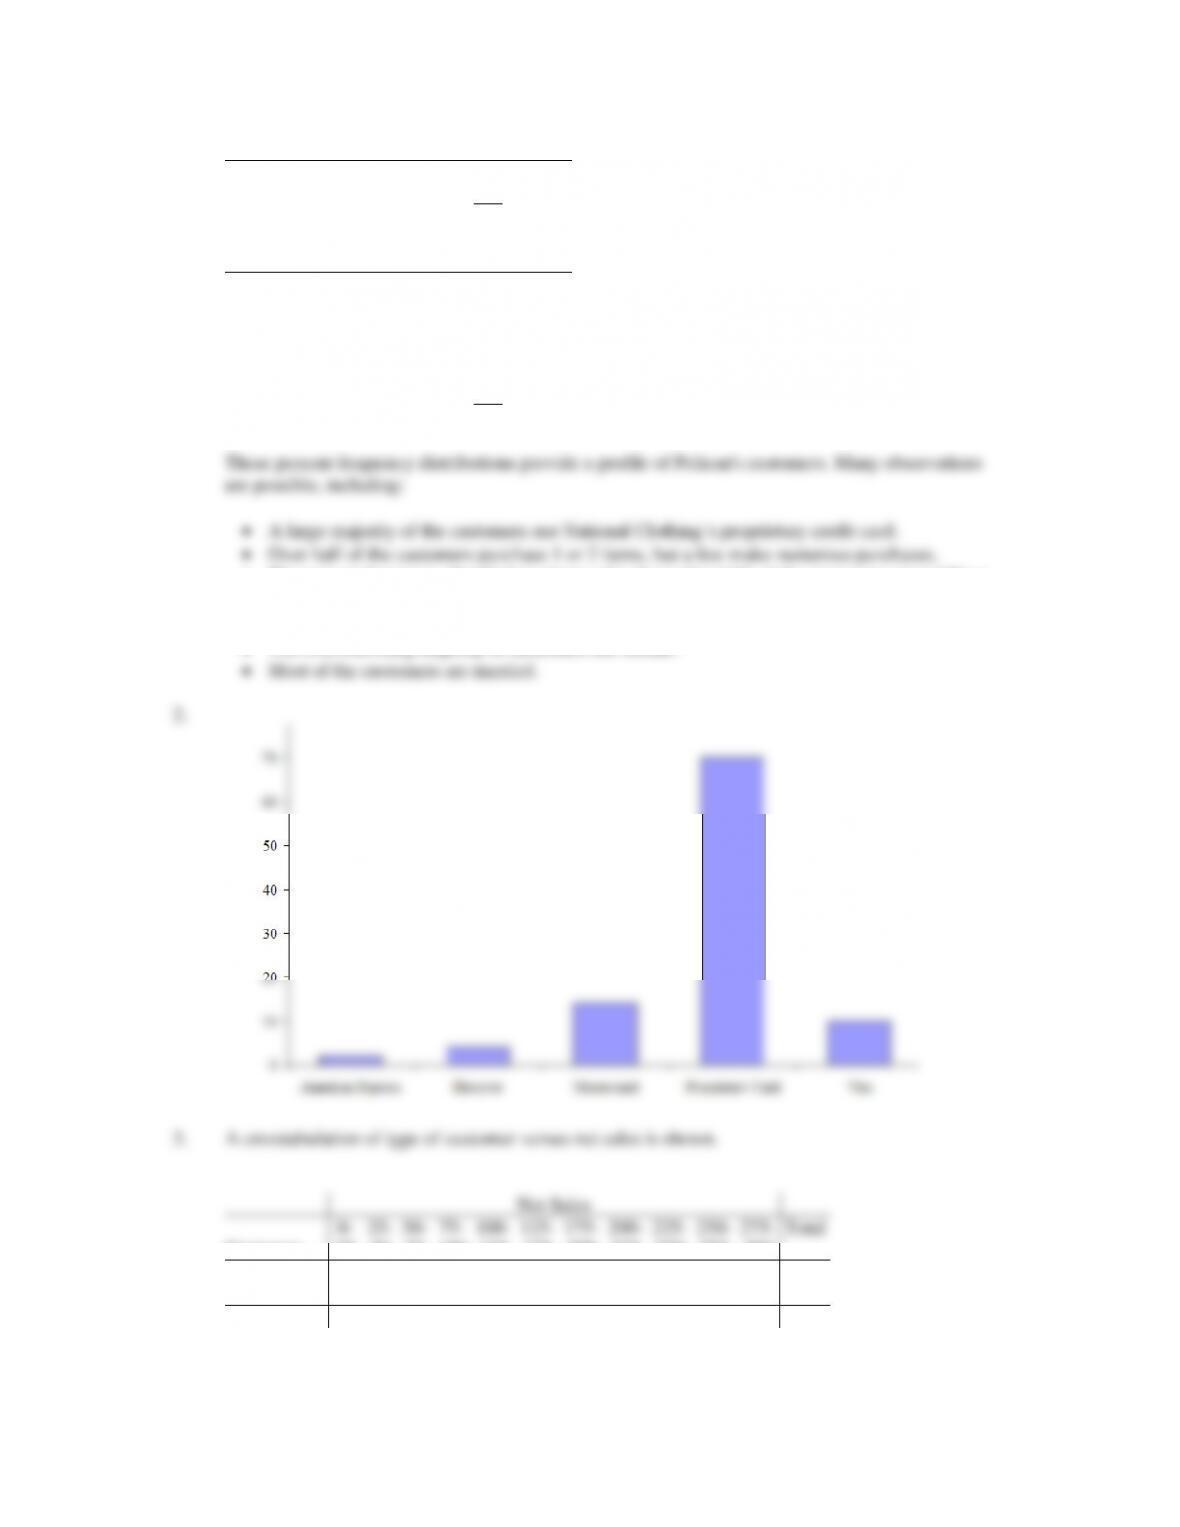
Net Sales
Customer
0-
25
25–
50
50-
75
75–
100
100-
125
125–
175
175–
200
200–
225
225–
250
250-
275
275–
300
Total
Promotional
7
17
17
8
9
3
2
3
1
2
1
70
Regular
2
13
8
2
3
1
1
30
Total
9
30
25
10
12
4
3
3
1
2
1
100
From the crosstabulation it appears that net sales are larger for promotional customers.
4. A scatter diagram of net Sales vs. age is shown below. A trendline has been fitted to the data. From
Age is not a factor in determining net sales.
data from the motion picture industry. Developing and interpreting frequency distributions, percent
frequency distributions and scatter diagrams are emphasized. The interpretations and insights can be quite
varied. We illustrate some below.
Frequency Distribution and Percent Frequency Distribution
The choice of the classes for frequency distributions or percent frequency distributions can be expected to
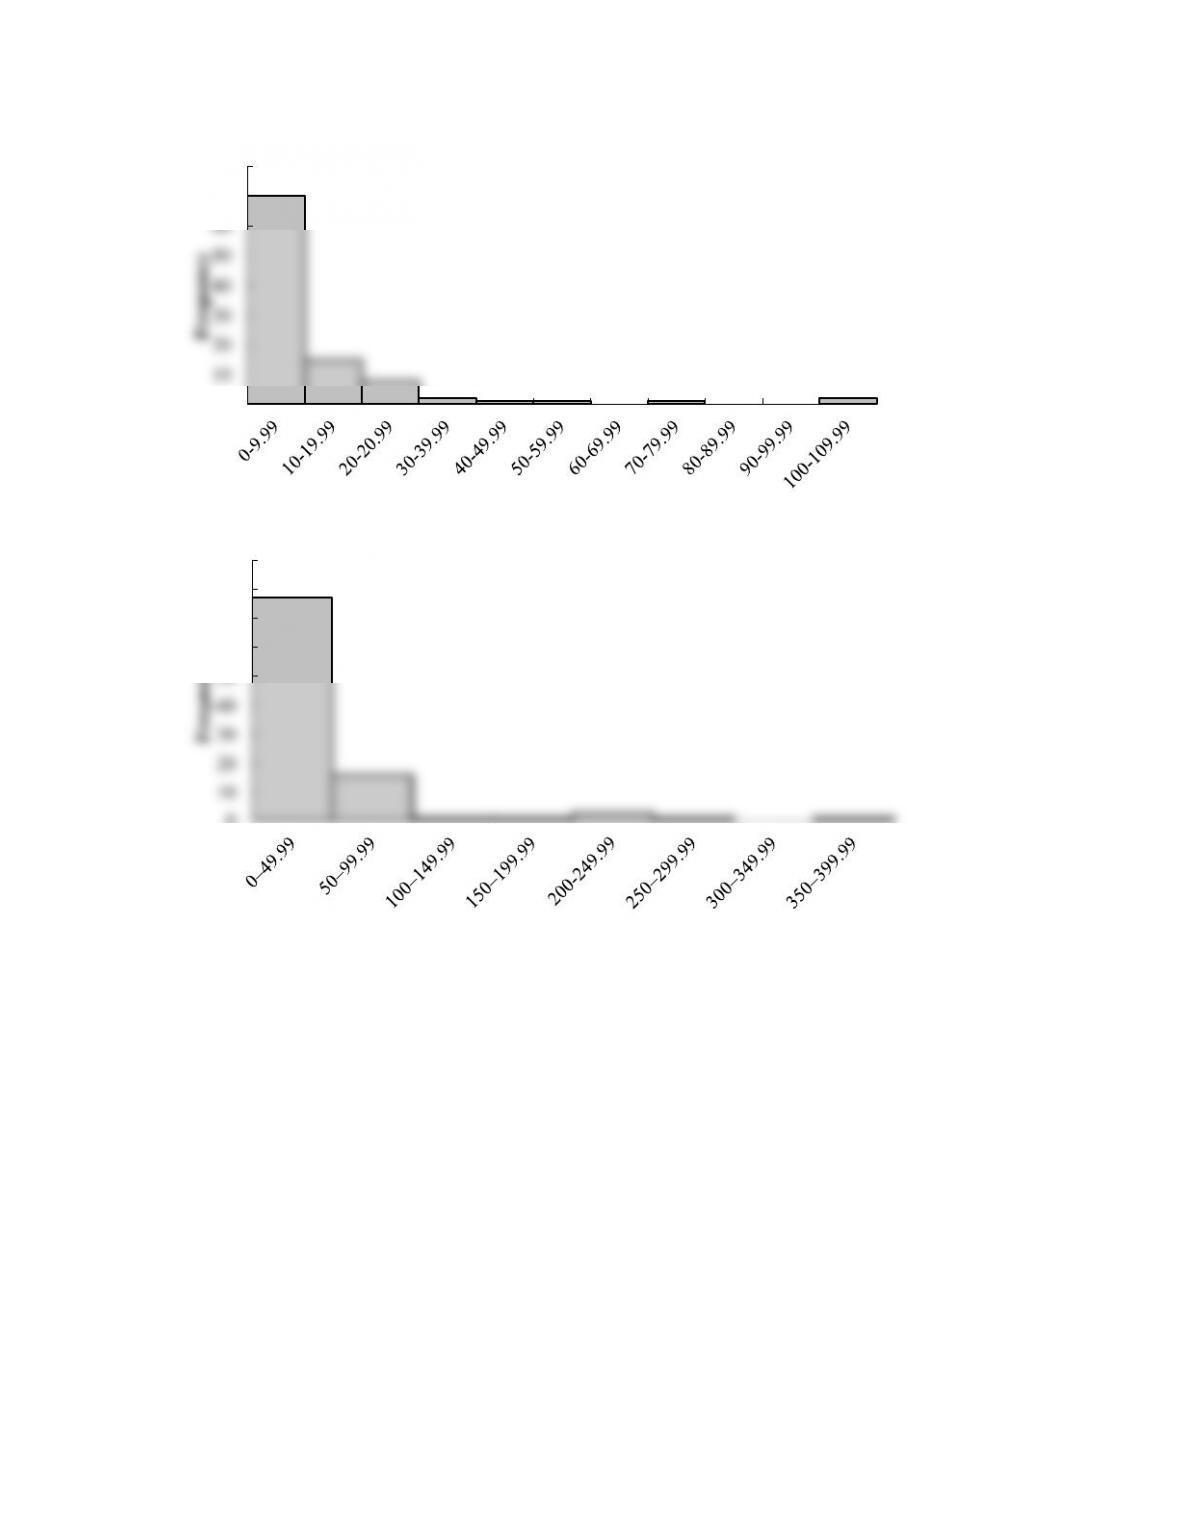
vary. The frequency distributions we developed are as follows:
Opening Gross Sales
(Millions)
Frequency
(or Percentage)
$0
–
9.99
70
10
–
19.99
15
20
–
29.99
8
30
–
39.99
2
40
–
49.99
1
50
–
59.99
1
60
–
69.99
0
70
–
79.99
1
80
–
89.99
0
90
–
99.99
0
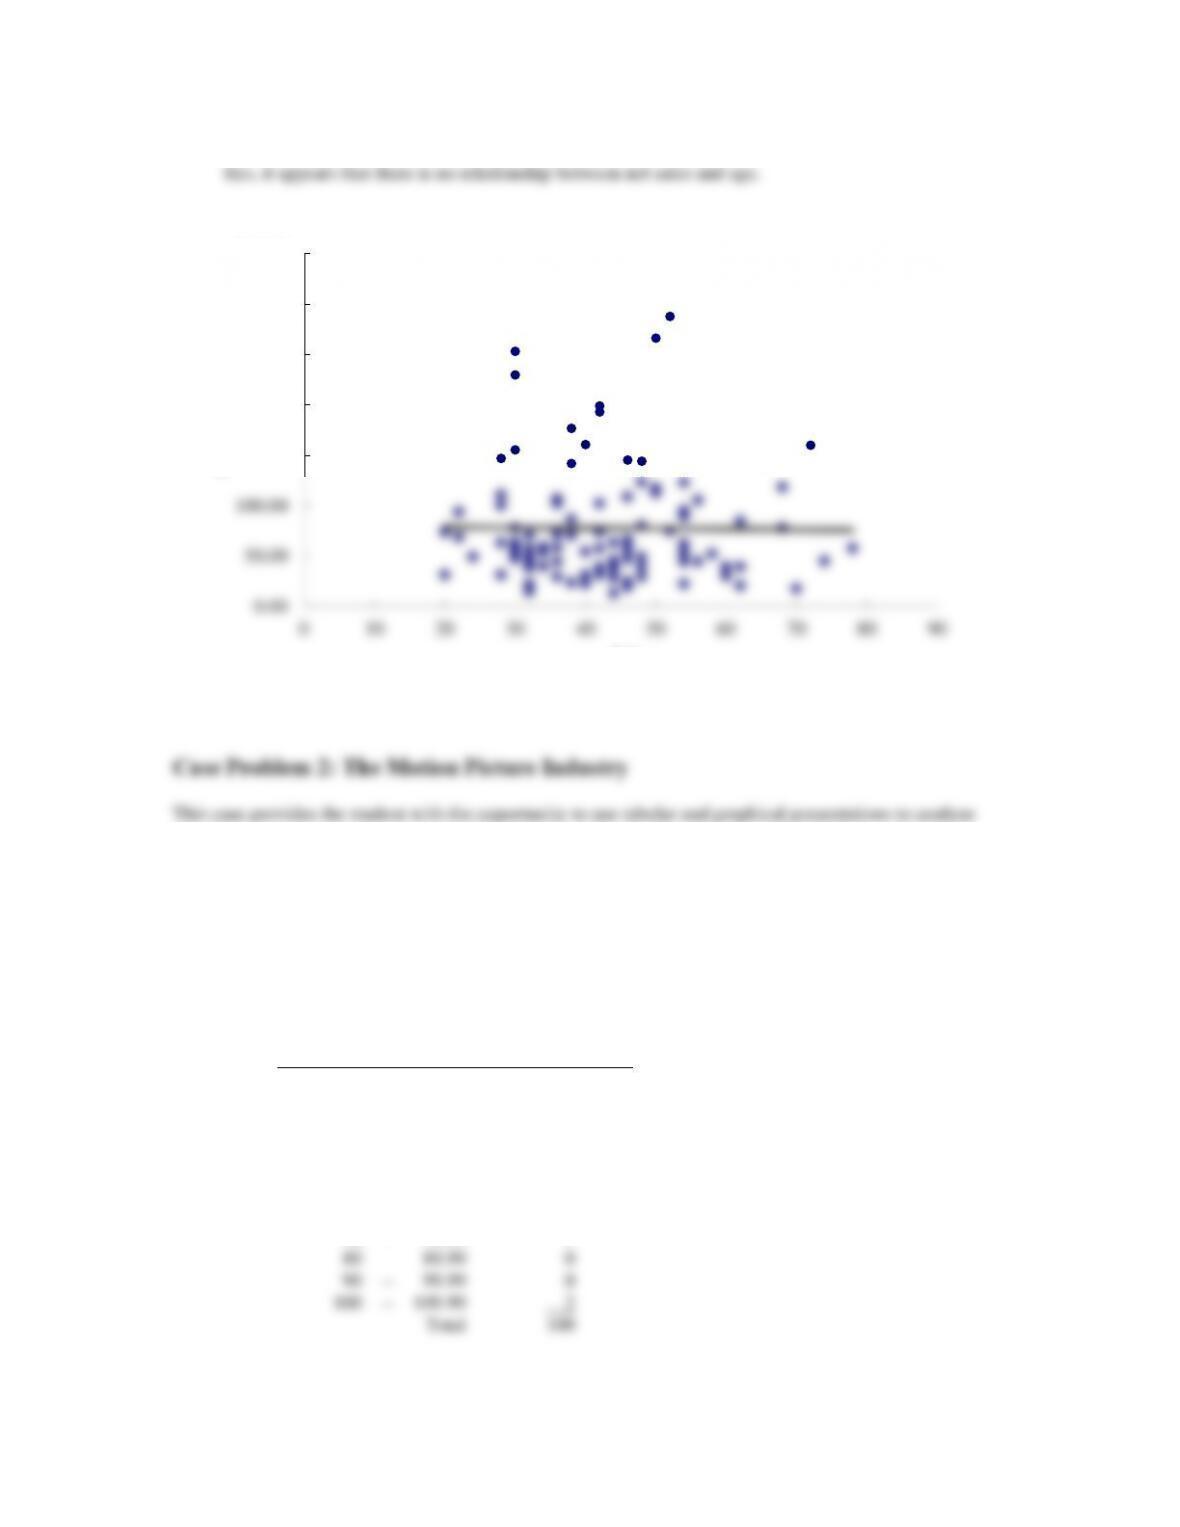
100
–
109.99
2
Total
100
0.00
50.00
100.00
150.00
200.00
250.00
300.00
350.00
010 20 30 40 50 60 70 80 90
Net Sales
Age
Total Gross Sales
(Millions)
Frequency
(or Percentage)
$0
–
49.99
77
50
–
99.99
16
100
–
149.99
1
150
–
199.99
1
200
–
249.99
3
250
–
299.99
1
300
–
349.99
0
350
–
399.99
1
Total
100
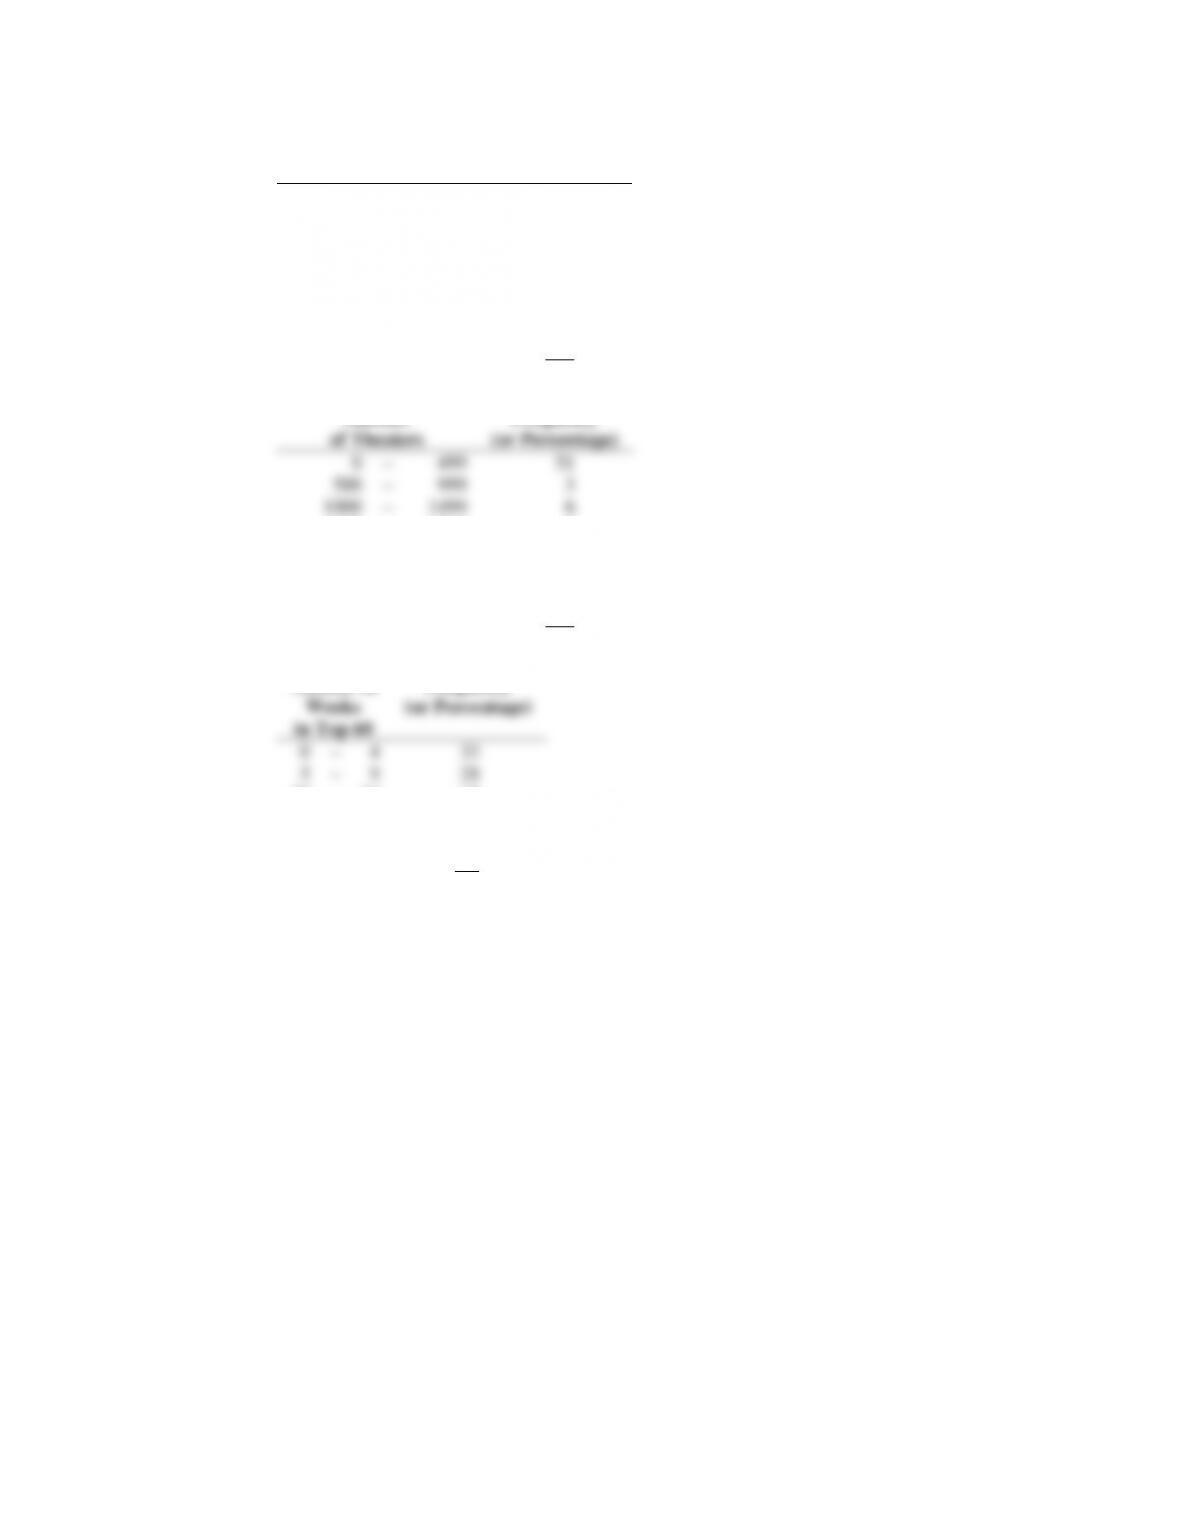
Number
of Theaters
Frequency
(or Percentage)
0
–
499
51
500
–
999
3
1000
–
1499
6
1500
–
1999
7
2000
–
2499
5
2500
–
2999
6
3000
–
3499
17
3500
–
3999
5
Total
100
Number of
Weeks
in Top 60
Frequency
(or Percentage)
0
–
4
33
5
–
9
28
10
–
14
18
15
–
19
15
20
–
24
5
25
–
29
1
Total
100
Histograms
The following histograms are based on the frequency distributions shown above.
0
10
20
30
40
50
60
70
80
Frequency
Opening Weekend Gross Sales (millions)
0
10
20
30
40
50
60
70
80
90
Frequency
Total Gross Sales (millions)
Interpretation
Opening Weekend Gross Sales. The distribution is skewed to the right. Numerous motion pictures have
somewhat low opening weekend gross sales, while a relatively few (7%) have an opening weekend gross
Total Gross Sales. This distribution is also skewed to the right. Again, the majority of the motion pictures
Highly successful blockbuster motion pictures are rare. Total gross sales over $200 million occurred only
5% of the time and over $300 million occurred only 1% of the time. No motion picture reported $400
million in total gross sales. Unless there is something unusually attractive about the motion picture, a total
gross sales less than $50 million appears typical.
0
10
20
30
40
50
60
Frequency
Number of Theaters
0
5
10
15
20
25
30
35
0-4 5–910–14 15–19 20–24 25–29
Frequency
Number of Weeks in the Top 60
Number of Theaters. This distribution is skewed to the right, but not so much as sales data distributions.
Number of Weeks in Top 60. This distribution is skewed to the right, but not as much as the other
distributions. It appears that almost all newly released movies initially make it into the top 60, with 67%
General Observations. The data show that there are relative few high-end, highly successful motion
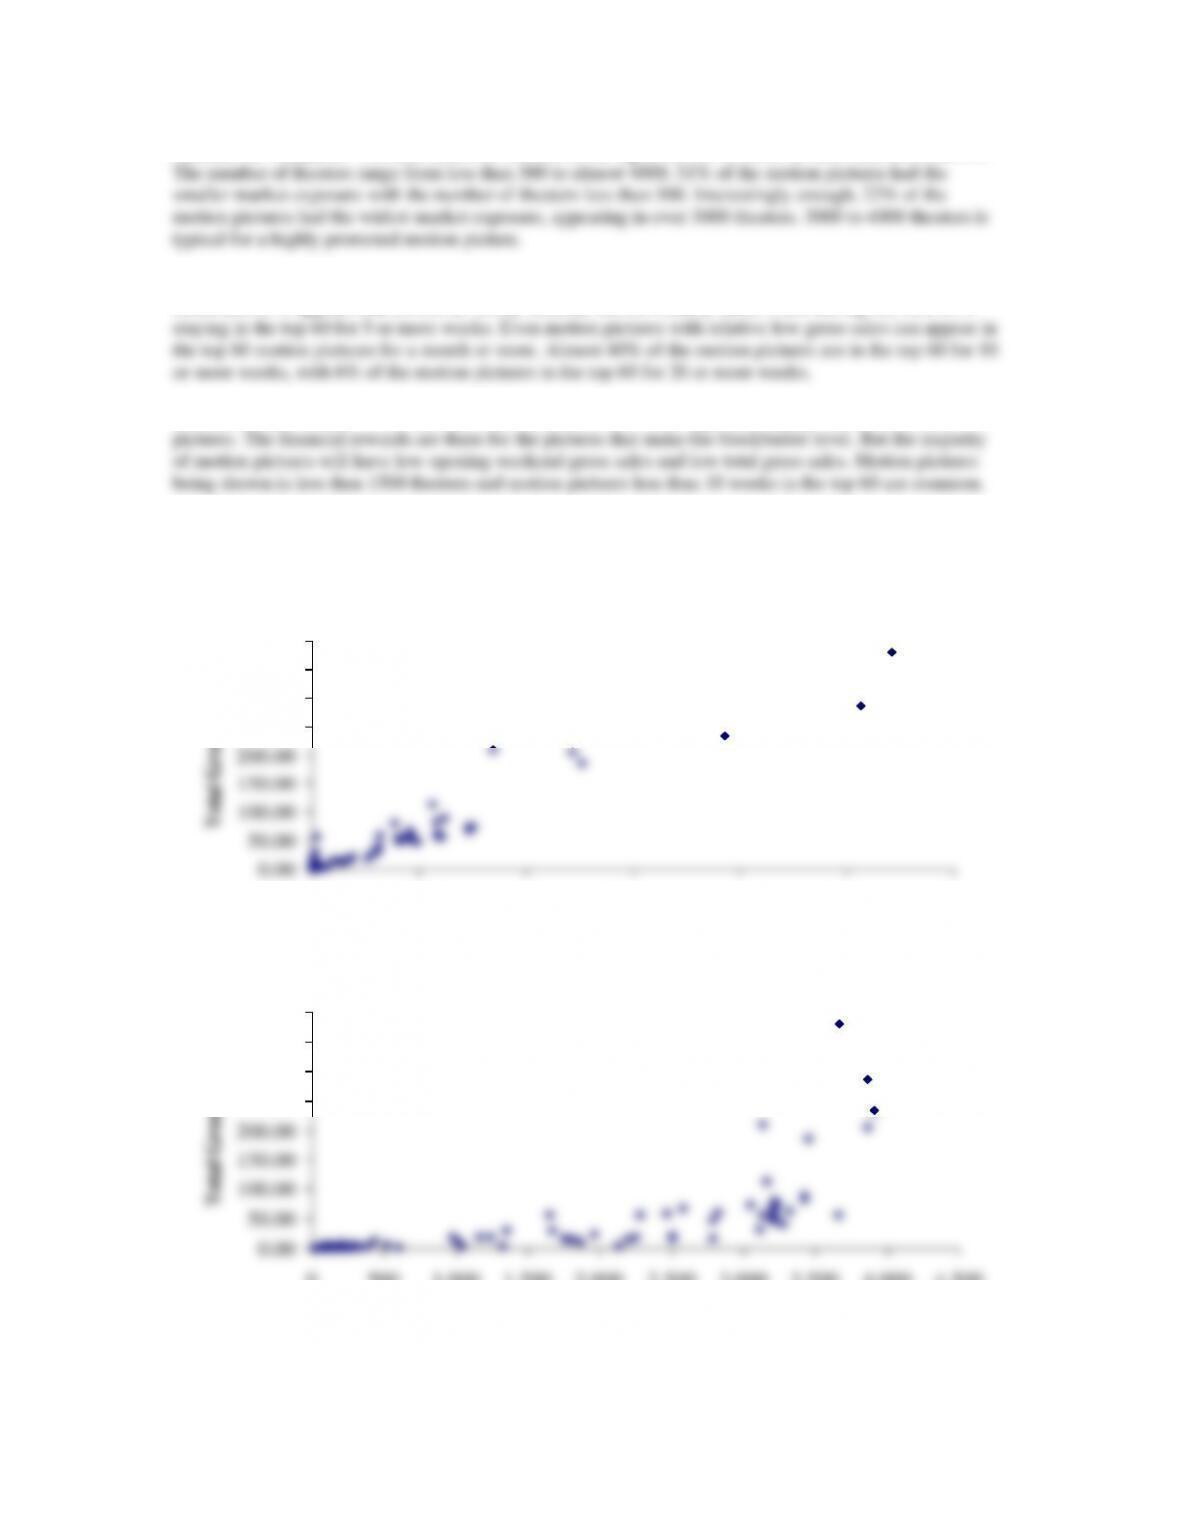
Scatter Diagrams
Three scatter diagrams are suggested to show how Total Gross Sales is related to each of the other three
variables.
0.00
50.00
100.00
150.00
200.00
250.00
300.00
350.00
400.00
0.00 20.00 40.00 60.00 80.00 100.00 120.00
Opening Weekend Gross Sales
Total Gross Sales
0.00
50.00
100.00
150.00
200.00
250.00
300.00
350.00
400.00
0500 1,000 1,500 2,000 2,500 3,000 3,500 4,000 4,500
Number of Theaters
Total Gross Sales
Interpretation
Opening Weekend Gross Sales. The scatter plot of total gross sales and opening weekend gross sales
shows a strong positive relationship. Motion pictures with the highest total gross sales were the motion
pictures with the highest opening weekend gross sales. How the motion picture does during its opening
Number of Theaters. The scatter plot of the total gross sales and number of theaters also shows a positive
relationship. For motion pictures playing in less than 3000 theaters, the total gross sales has a positive
relationship with the number of theaters. If the motion picture is shown in more theaters, higher total gross
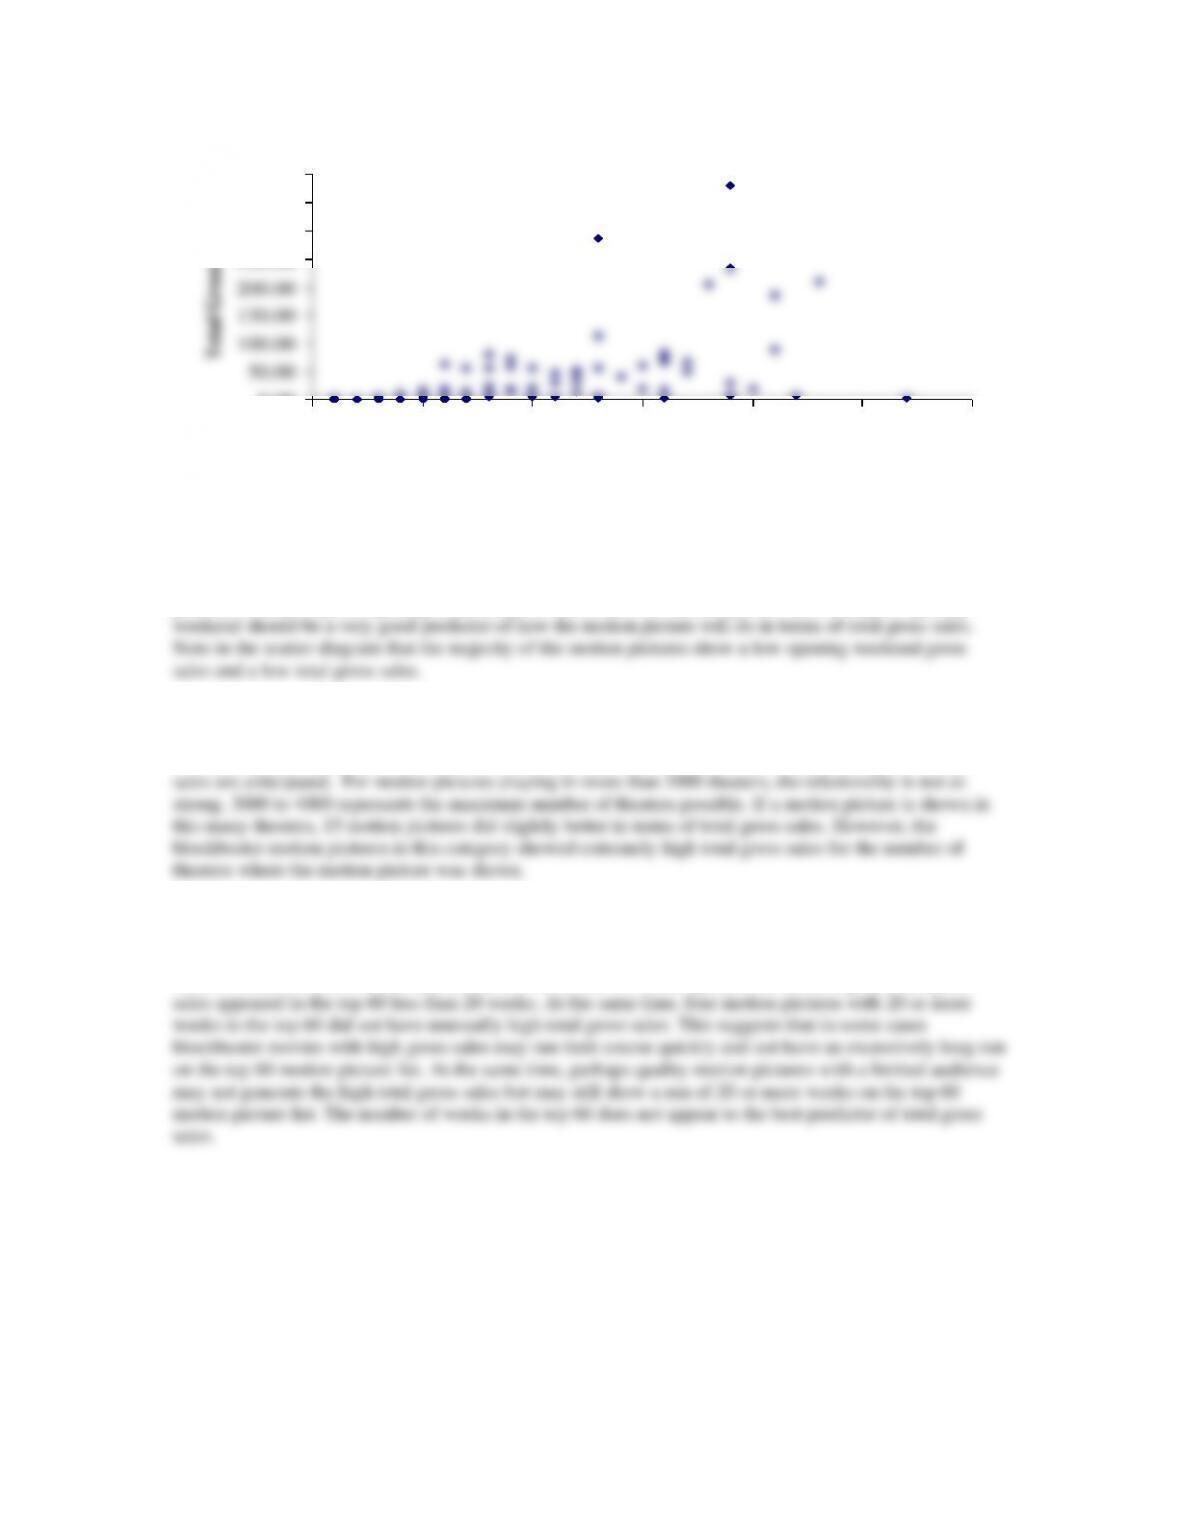
Number of Weeks in Top 60. The scatter plot of the total gross sales and number of weeks in the top 60
shows a positive relationship, but this relationship appears to be the weakest of the three relationships
studied. Generally, the more successful, higher gross sales motion pictures are in the top 60 for more
weeks. However, this is not always the case. Four of the six motion pictures with the highest total gross
0.00
50.00
100.00
150.00
200.00
250.00
300.00
350.00
400.00
0 5 10 15 20 25 30
Number of Weeks in the Top 60
Total Gross Sales