39. a.
b. For midsized cars, lower driving speeds seem to yield higher miles per gallon.
40. a.
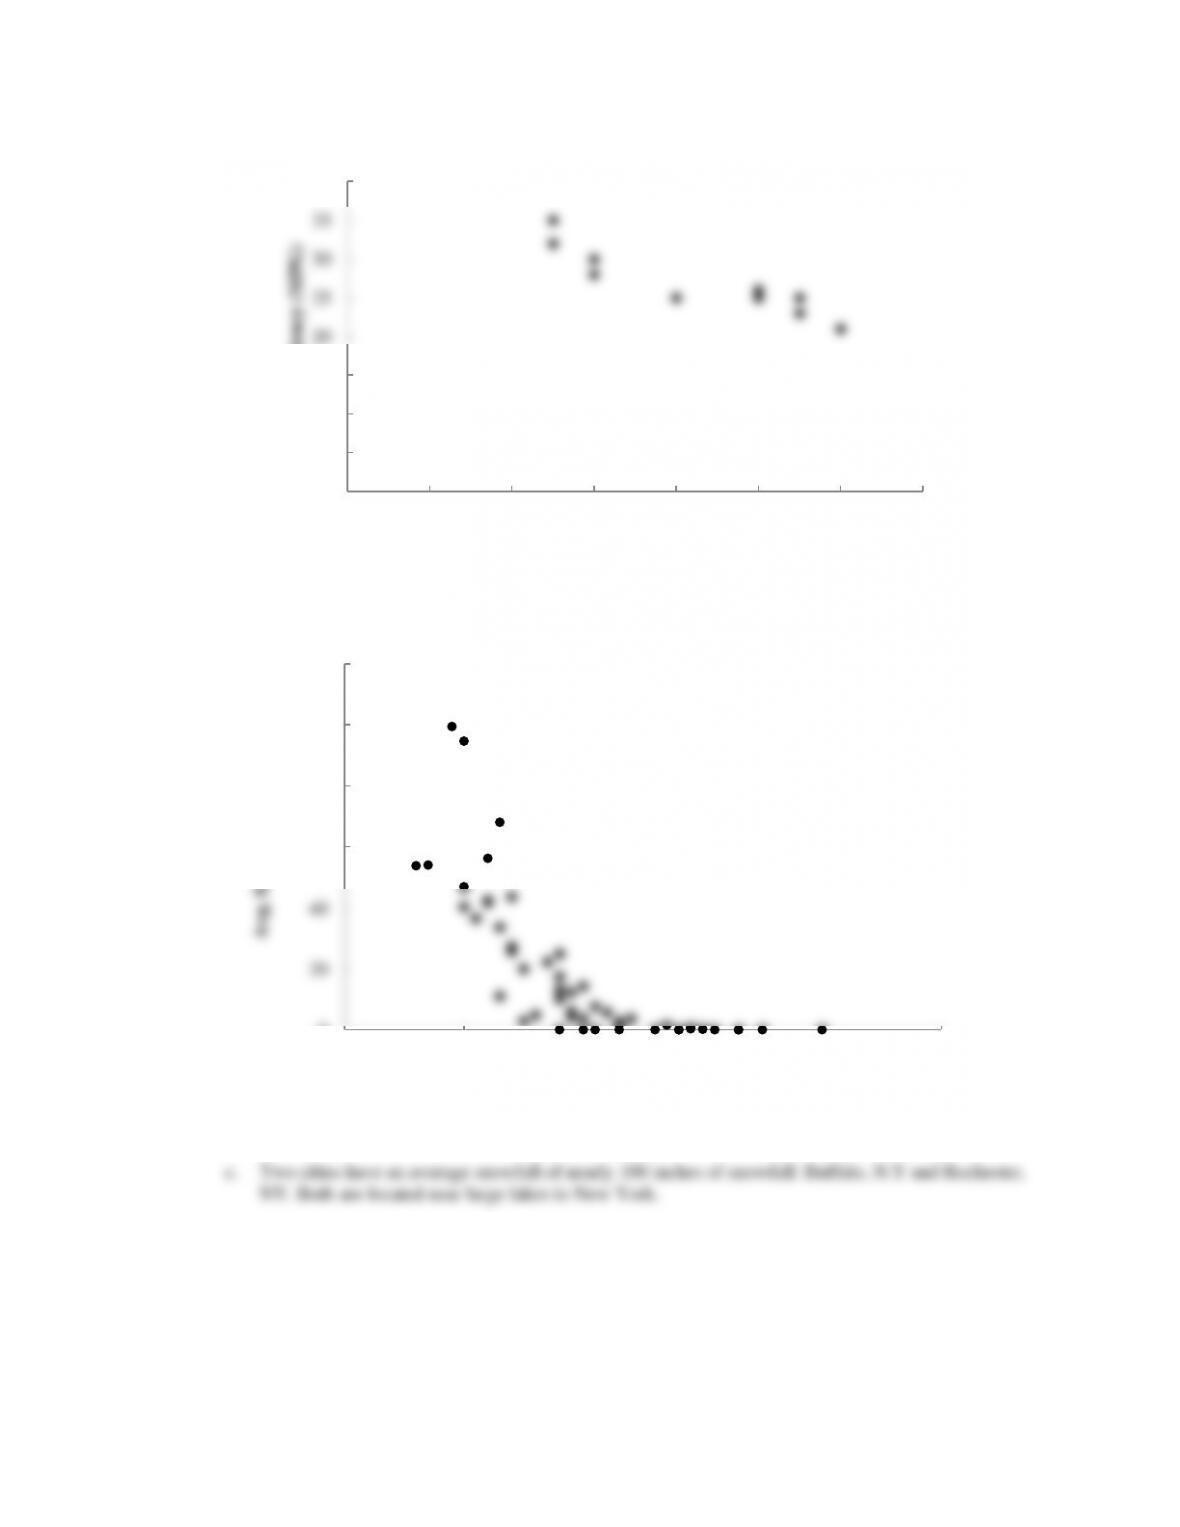
b. Colder average low temperature seems to lead to higher amounts of snowfall.
41. a.
0
5
10
15
20
25
30
35
40
010 20 30 40 50 60 70
Fuel Efficiency (MPG)
Driving Speed (MPH)
0
20
40
60
80
100
120
30 40 50 60 70 80
Avg. Snowfall (inches)
Avg. Low Temp
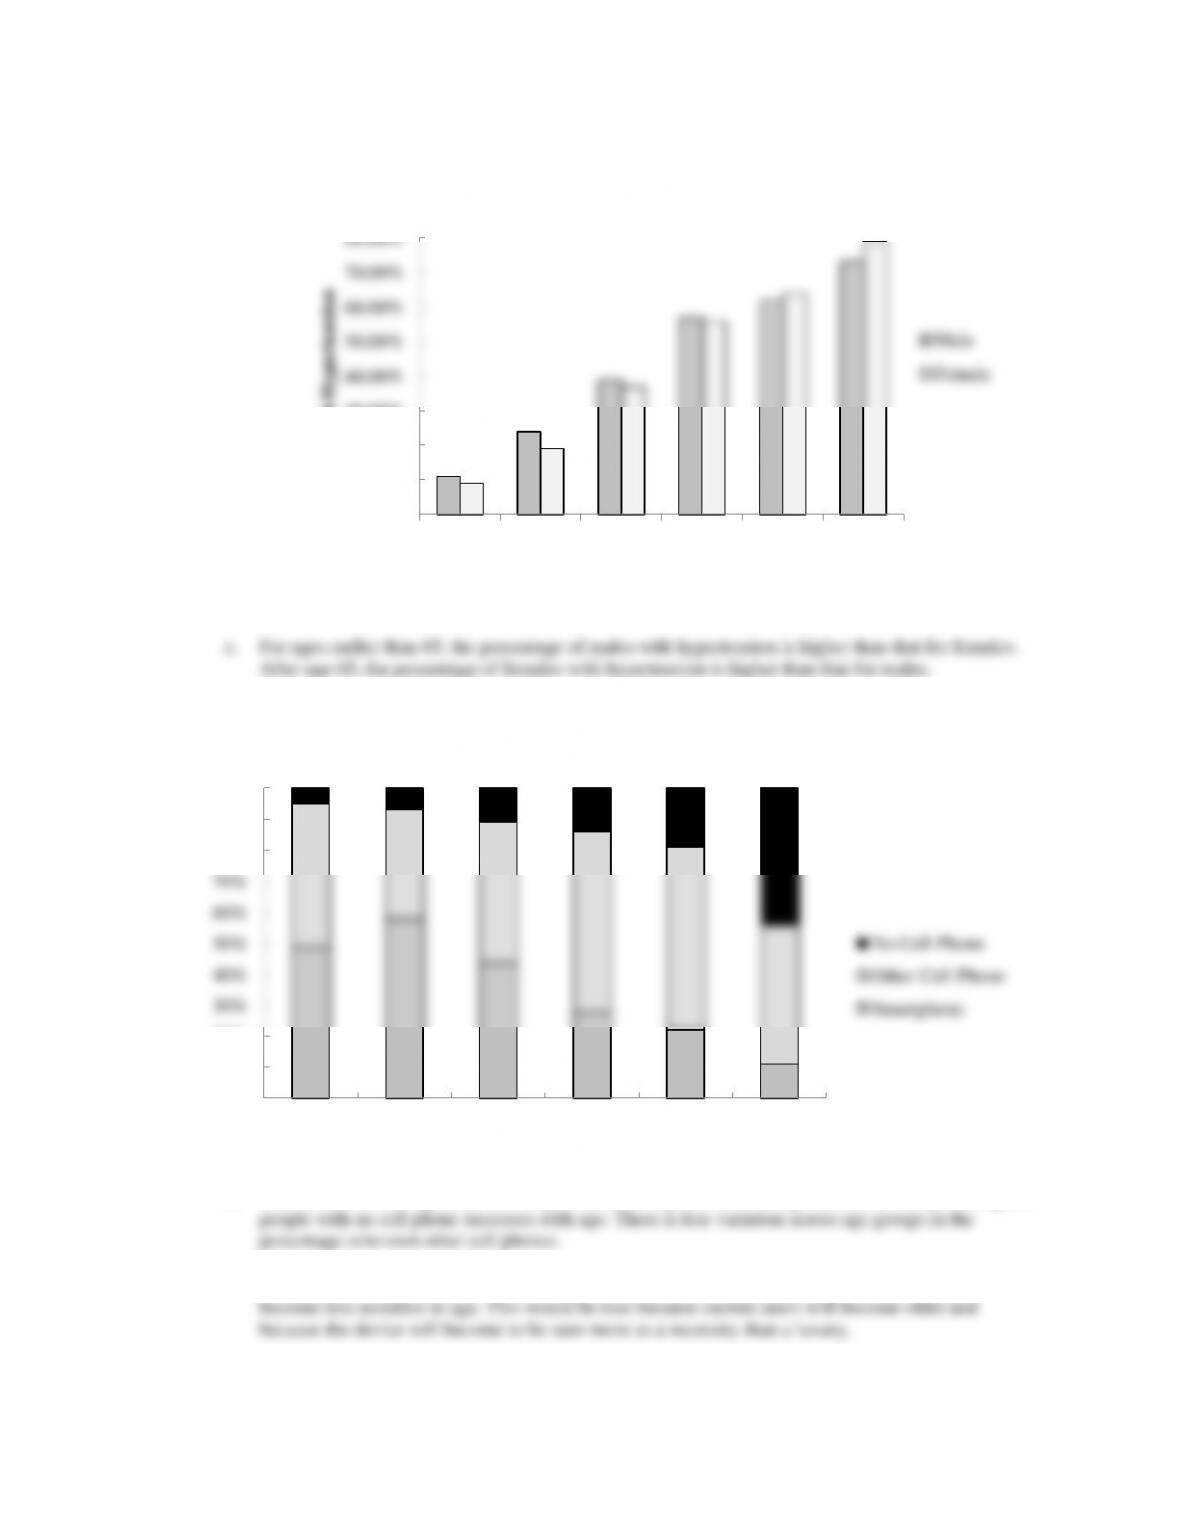
b. The percentage of people with hypertension increases with age.
42. a.
b. After an increase in age 25-34, smartphone ownership decreases as age increases. The percentage of
43. a.
0.00%
10.00%
20.00%
30.00%
40.00%
50.00%
60.00%
70.00%
80.00%
20-34 35-44 45-54 55-64 65-74 75+
% with Hypertension
Age
Male
Female
0%
10%
20%
30%
40%
50%
60%
70%
80%
90%
100%
18-24 25-34 35-44 45-54 55-64 65+
Age
No Cell Phone
Other Cell Phone
Smartphone
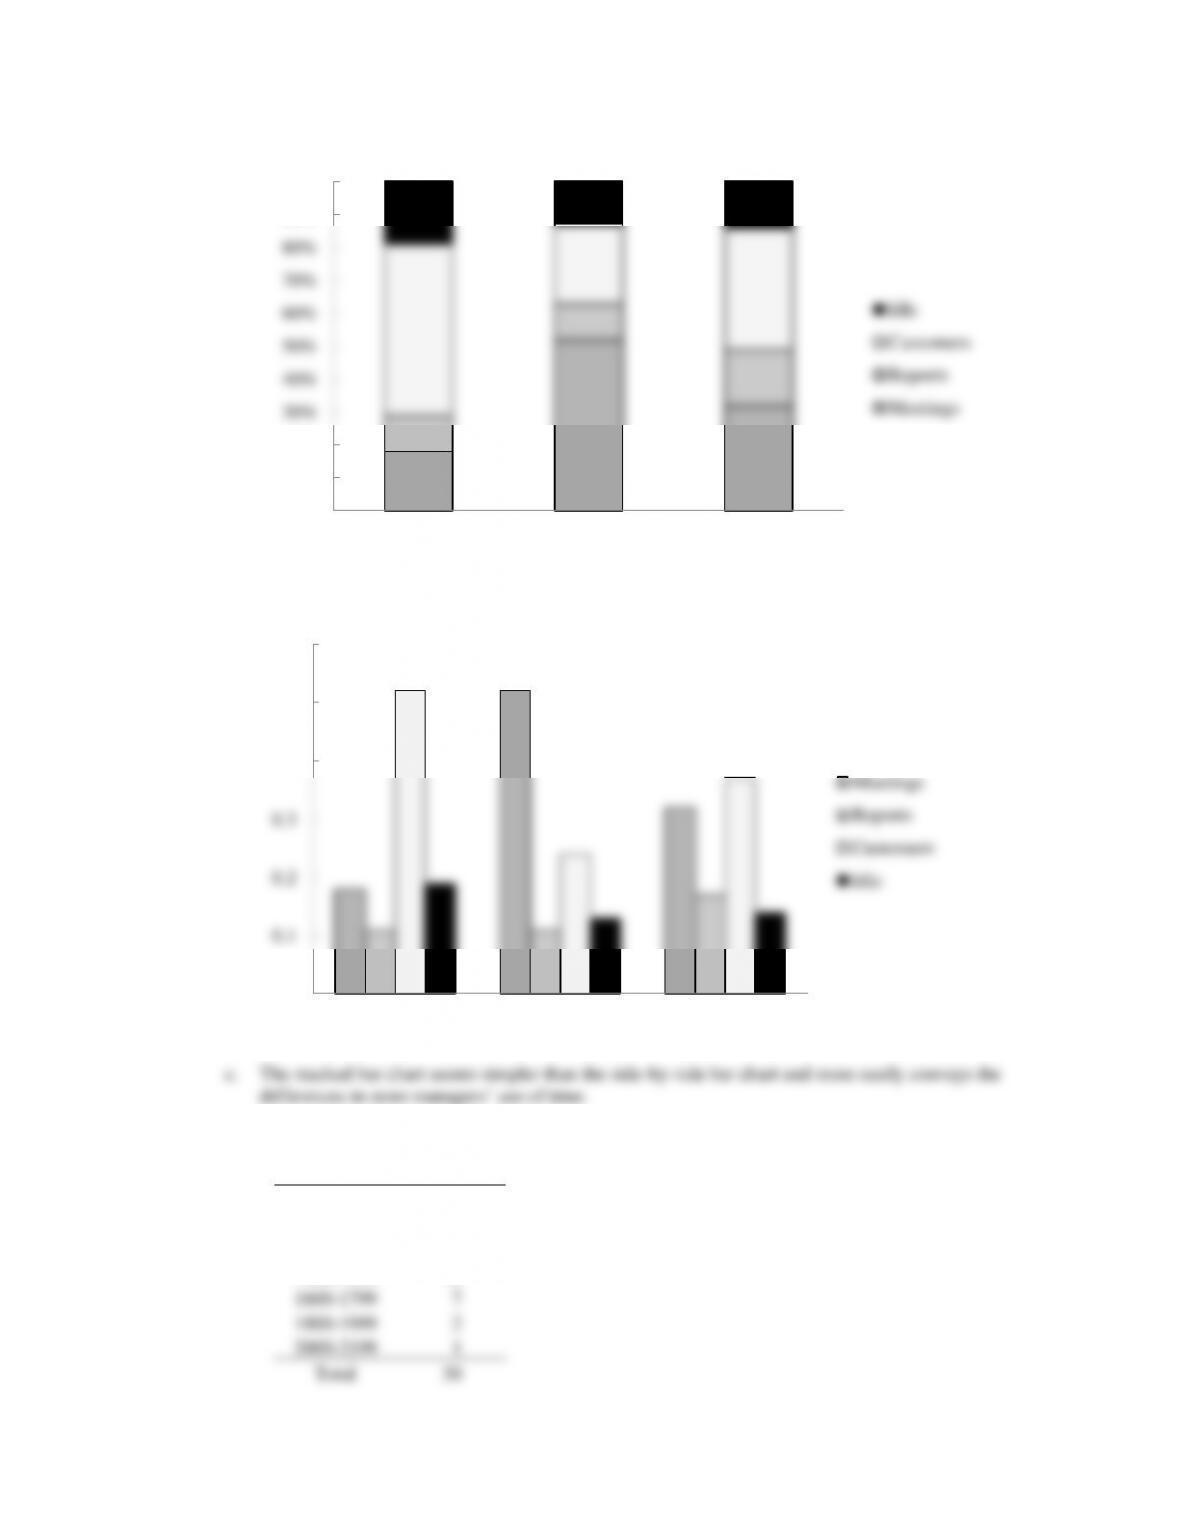
b.
44. a.
1400-1599
1600-1799
7
1800-1999
2
2000-2199
1
0%
10%
20%
30%
40%
50%
60%
70%
80%
90%
100%
Bend Portland Seattle
Idle
Customers
Reports
Meetings
0
0.1
0.2
0.3
0.4
0.5
0.6
Bend Portland Seattle
Meetings
Reports
Customers
Idle
Class
Frequency
800–999
1
1000-1199
3
1200-1399
6
Total
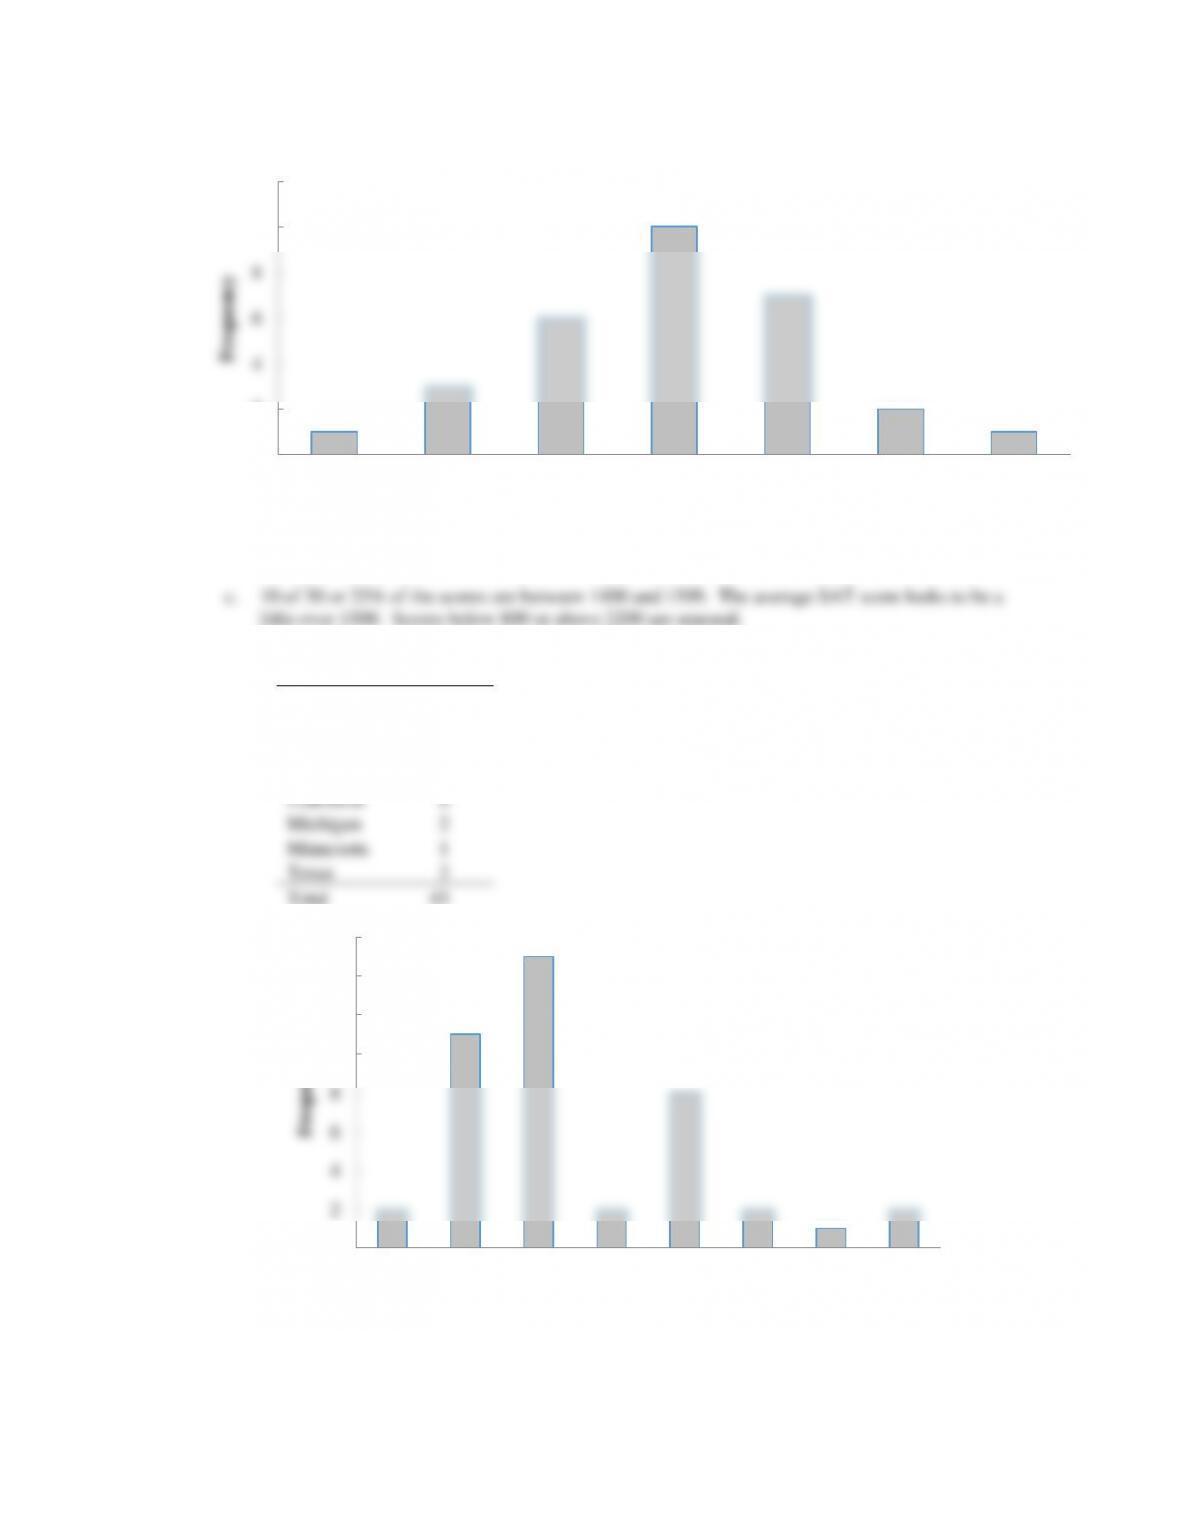
b. The distribution if nearly symmetrical. It could be approximated by a bell-shaped curve.
45. a.
Michigan
2
Minnesota
1
Texas
2
0
2
4
6
8
10
12
800-999 1000-1199 1200-1399 1400-1599 1600-1799 1800-1999 2000-2199
Frequency
SAT Score
0
2
4
6
8
10
12
14
16
AZ CA FL GA LA MN MN TX
Frequency
State
State
Frequency
Arizona
2
California
11
Florida
15
Georgia
2
Louisiana
8
Total
43
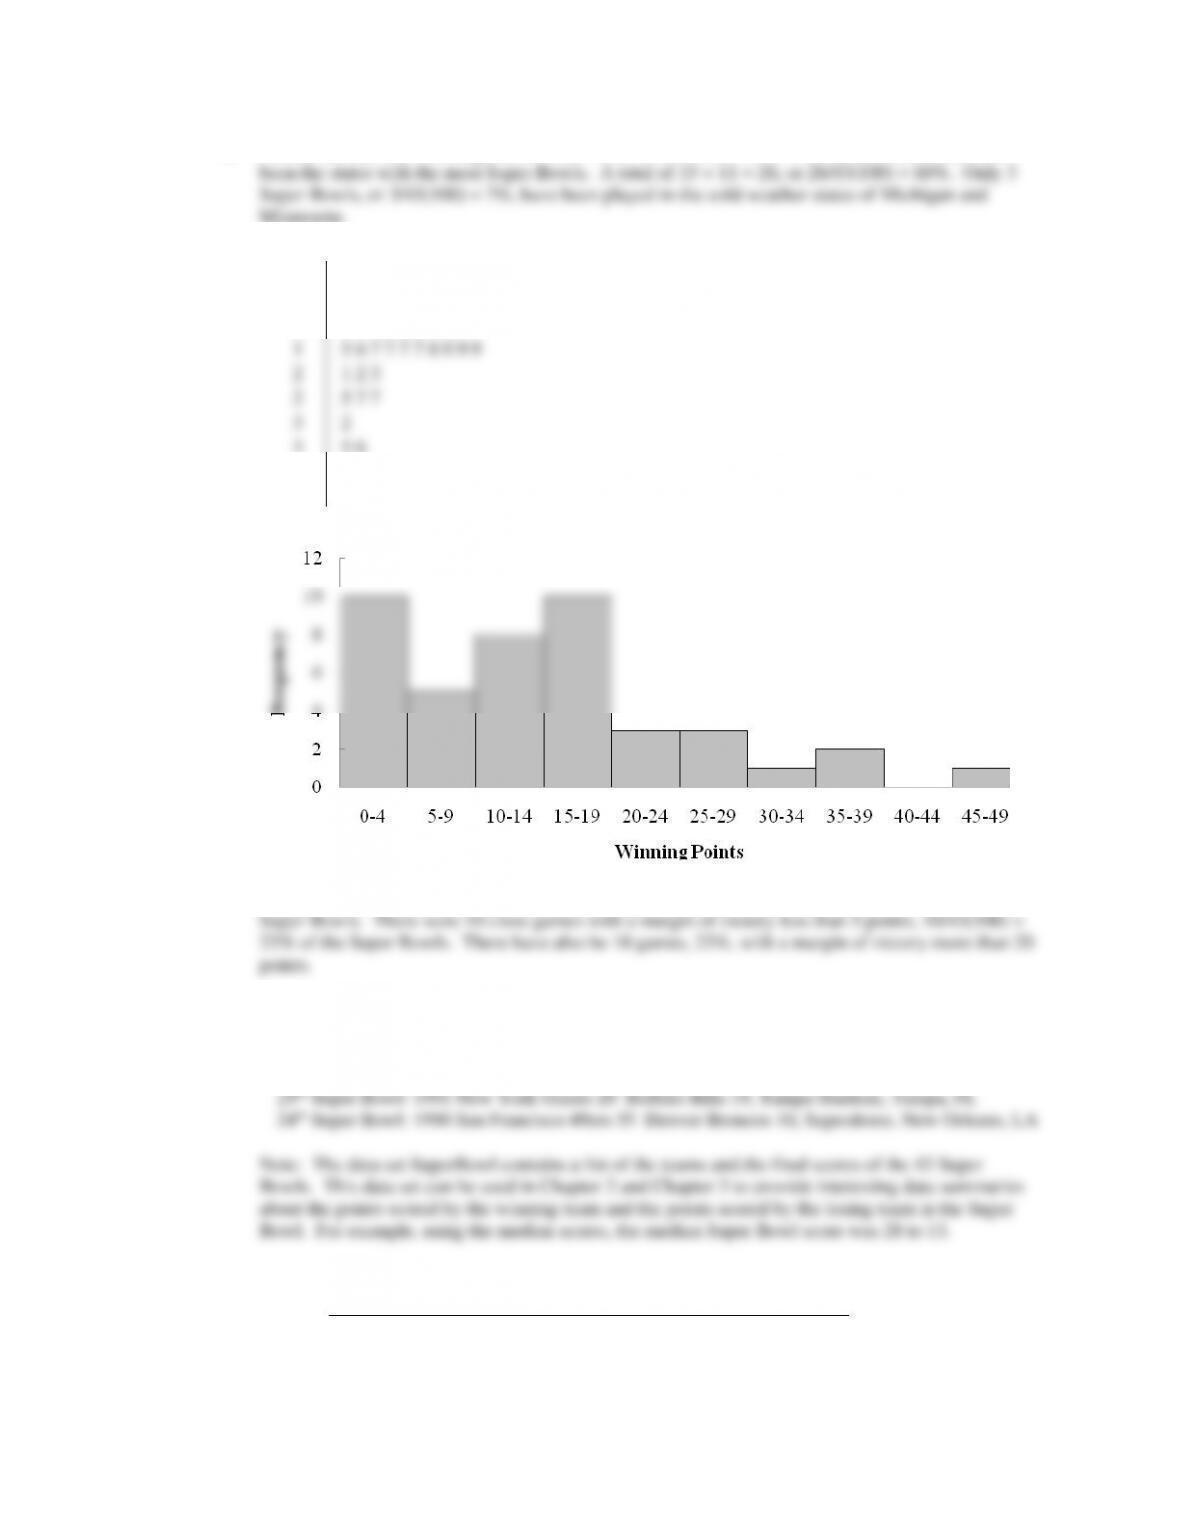
b. Florida has had the most Super Bowl with 15, or 15/43(100) = 35%. Florida and California have
Minnesota.
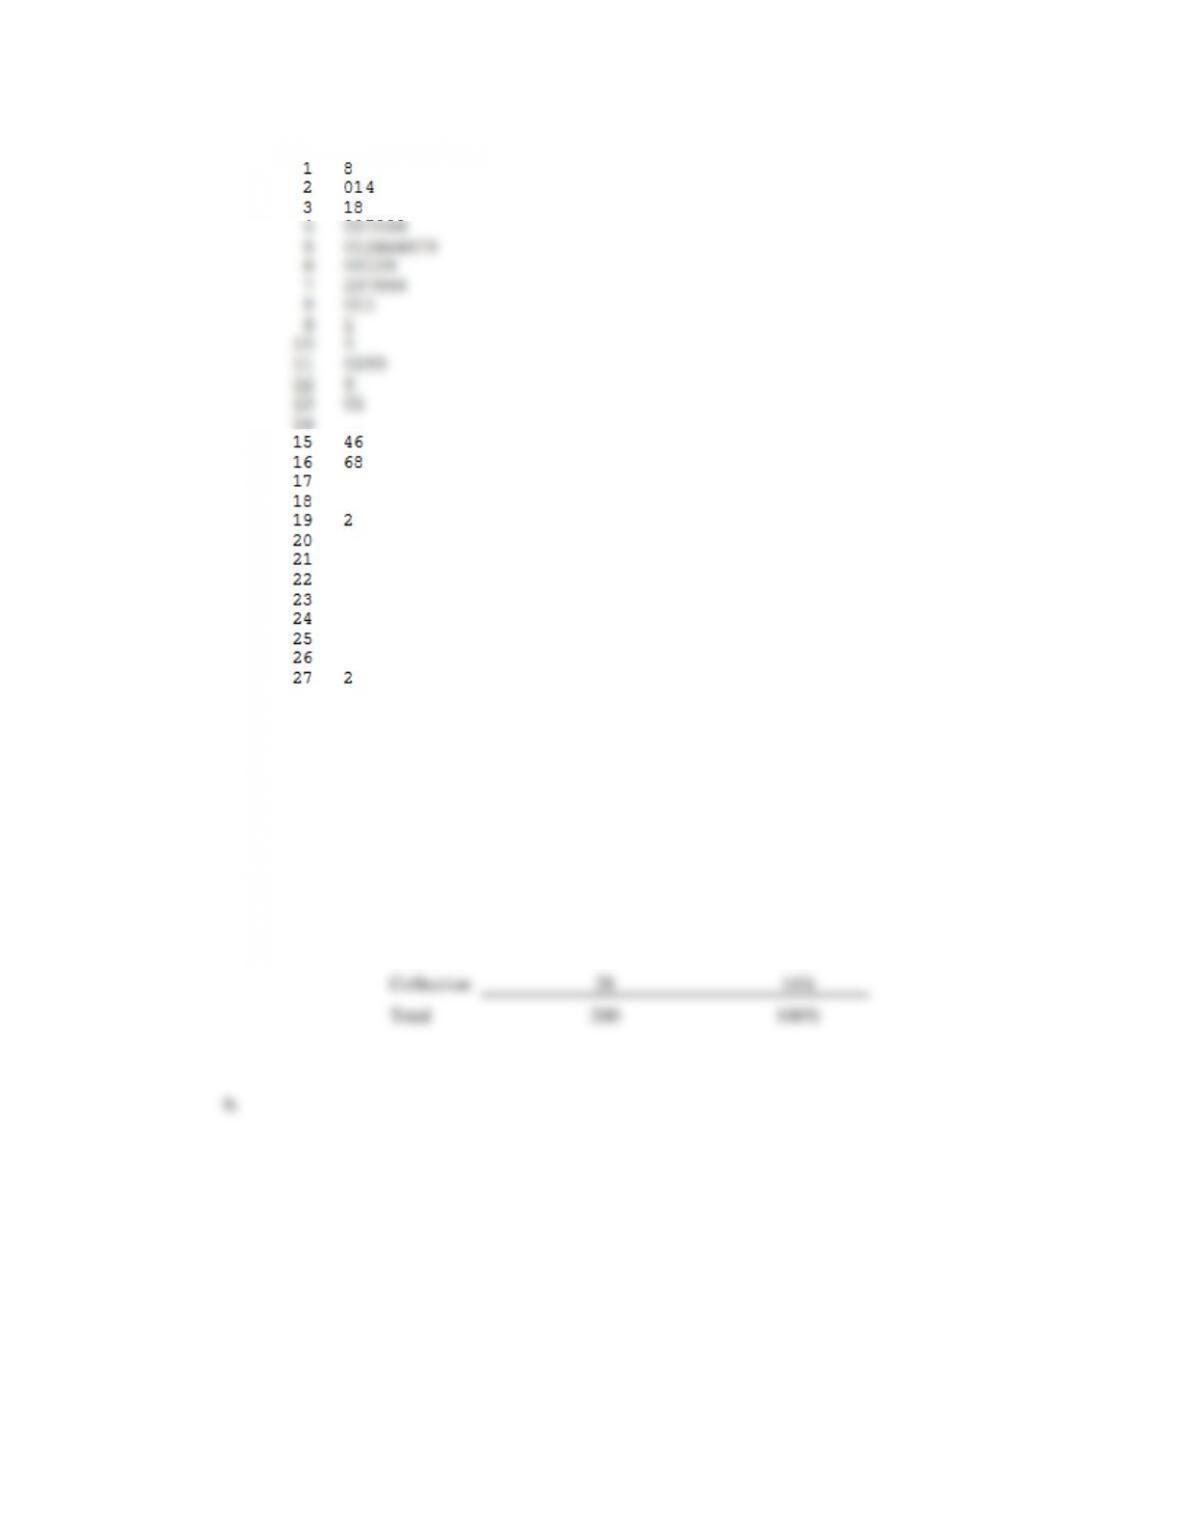
c.
1
5 6 7 7 7 7 8 9 9 9
2
1 2 3
2
5 7 7
3
2
d. The most frequent winning points have been 0 to 4 points and 15 to 19 points. Both occurred in 10
e. The closest games was the 25th Super Bowl with a 1 point margin. It was played in Florida. The
largest margin of victory occurred one year earlier in the 24th Super Bowl. It had a 45 point margin
and was played in Louisiana. More detailed information not available from the text information.
46. a.
Population in Millions
Frequency
% Frequency
0.0 – 2.4
15
30.0%
2.5-4.9
13
26.0%
0
1 3 3 3 3 3 4 4 4 4
0
5 7 7 7 9
1
0 0 0 1 2 2 3 4
3
5 6
4
4
5
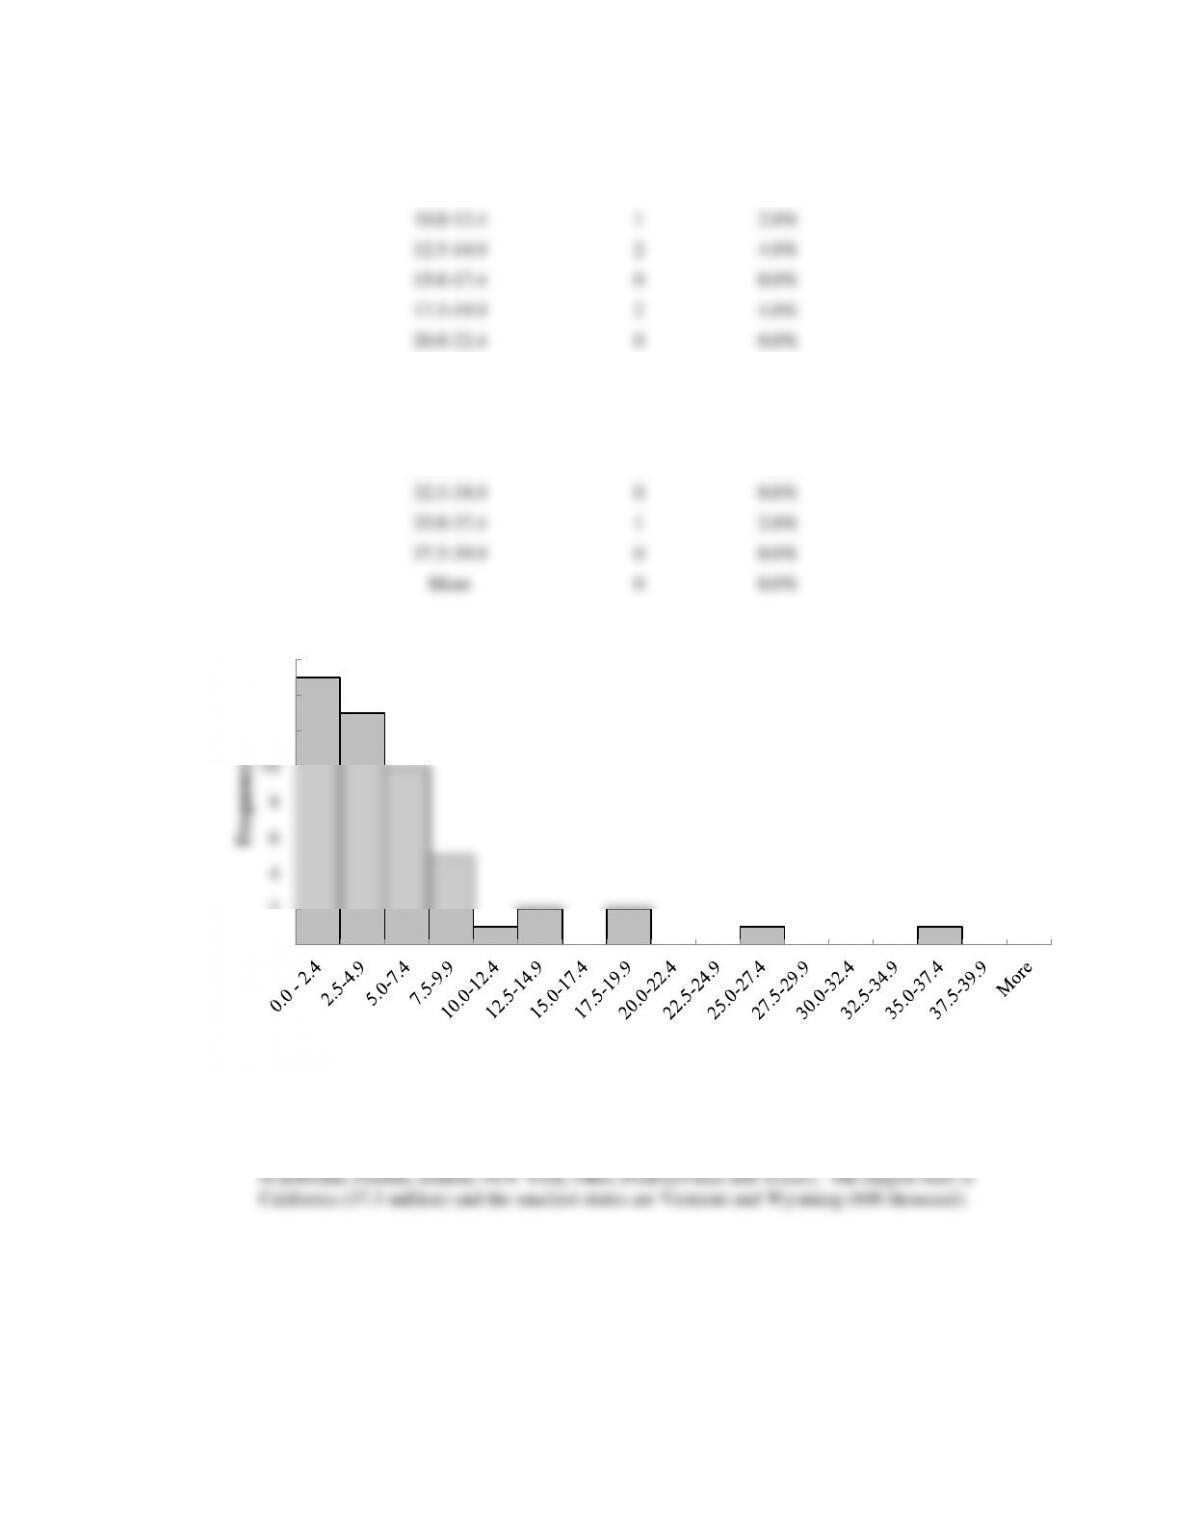
5.0-7.4
10
20.0%
7.5-9.9
5
10.0%
10.0-12.4
1
2.0%
12.5-14.9
2
4.0%
15.0-17.4
0
0.0%
17.5-19.9
2
4.0%
20.0-22.4
0
0.0%
22.5-24.9
0
0.0%
25.0-27.4
1
2.0%
27.5-29.9
0
0.0%
30.0-32.4
0
0.0%
32.5-34.9
0
0.0%
35.0-37.4
1
2.0%
37.5-39.9
0
0.0%
More
0
0.0%
b. The distribution is skewed to the right.
c. 15 states (30%) have a population less than 2.5 million. Over half of the states have population less
than 5 million (28 states – 56%). Only seven states have a population greater than 10 million
47. a.
0
2
4
6
8
10
12
14
16
Frequency
Population Millions
b. The majority of the start-up companies in this set have less than $90 million in venture capital. Only
6 of the 50 (12%) have more than $150 million.
48. a.
Industry
Frequency
% Frequency
Bank
26
13%
Cable
44
22%
Car
42
21%
Cell
60
30%
Collection
28
14%
Total
200
100%
b.
c. The cellular phone providers had the highest number of complaints.
d. The percentage frequency distribution shows that the two financial industries (banks and collection
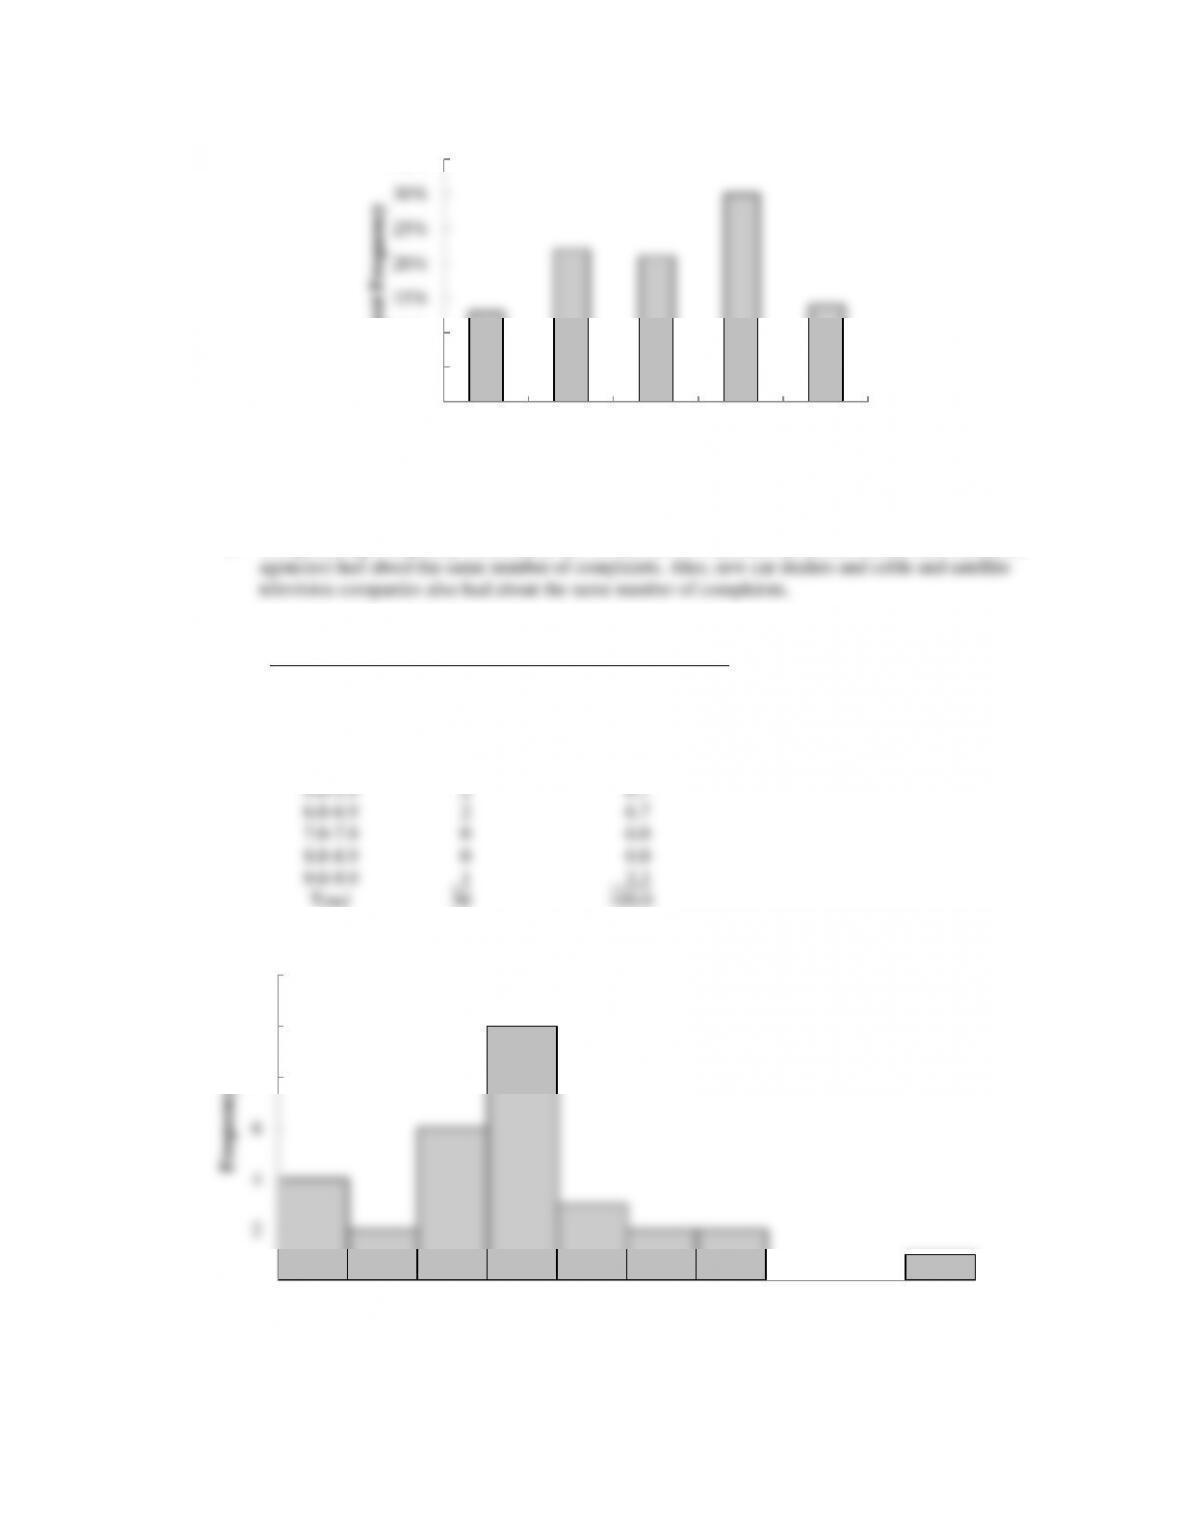
49. a.
Yield%
Frequency
Percent Frequency
0.0-0.9
4
13.3
1.0-1.9
2
6.7
2.0-2.9
6
20.0
3.0-3.9
10
33.3
4.0-4.9
3
10.0
5.0-5.9
2
6.7
6.0-6.9
2
6.7
7.0-7.9
0
0.0
8.0-8.9
0
0.0
9.0-9.9
1
3.3
Total
30
100.0
b.
0%
5%
10%
15%
20%
25%
30%
35%
Bank Cable Car Cell Collection
Percent Frequency
Industry
0
2
4
6
8
10
12
0.0-0.9 1.0-1.9 2.0-2.9 3.0-3.9 4.0-4.9 5.0-5.9 6.0-6.9 7.0-7.9 8.0-8.9 9.0-9.9
Frequency
c. The distribution is skewed to the right.
d. Dividend yield ranges from 0% to over 9%. The most frequent range is 3.0% to 3.9%. Average
dividend yields looks to be between 3% and 4%. Over 50% of the companies (16) pay from 2.0 % to
e. General Electric had an unusually high dividend yield of 9.2%. 500 shares at $14 per share is an