
Chapter 7 – Sampling and Sampling Distributions
c.
n ≥ 30
d.
Both np ≥ 5 and n(1 − p) ≥ 5 are true.
79. A sample of 25 observations is taken from a process (an infinite population). The sampling distribution of is
a.
not normal since n < 30
b.
approximately normal because is always normally distributed
c.
approximately normal if np ≥ 5 and n(1–p) ≥ 5
d.
approximately normal if np > 30 and n(1–p) > 30
c
80. A sample of 400 observations will be taken from a process (an infinite population). The population proportion equals
0.8. The probability that the sample proportion will be greater than 0.83 is
a.
0.4332
b.
0.9332
c.
0.0668
d.
0.5668
c
81. A sample of 66 observations will be taken from a process (an infinite population). The population proportion equals
0.12. The probability that the sample proportion will be less than 0.1768 is
a.
0.0568
b.
0.0778
c.
0.4222
d.
0.9222
82. A sample of 51 observations will be taken from a process (an infinite population). The population proportion equals
0.85. The probability that the sample proportion will be between 0.9115 and 0.946 is
a.
0.8633
b.
0.6900
c.
0.0819
d.
0.0345
c
83. Stratified random sampling is a method of selecting a sample in which
a.
the sample is first divided into groups, and then random samples are taken from each group
b.
various strata are selected from the sample
c.
the population is first divided into groups, and then random samples are drawn from each group
d.
None of the alternative answers is correct.

Chapter 7 – Sampling and Sampling Distributions
c
84. Cluster sampling is
a.
a nonprobability sampling method
b.
the same as convenience sampling
c.
a probability sampling method
d.
None of the alternative answers is correct.
c
85. Convenience sampling is an example of
a.
probabilistic sampling
b.
stratified sampling
c.
a nonprobability sampling technique
d.
cluster sampling
c
86. Which of the following is an example of a nonprobability sampling technique?
a.
simple random sampling
b.
stratified random sampling
c.
cluster sampling
d.
judgment sampling
87. Which of the following sampling methods does not lead to probability samples?
a.
stratified sampling
b.
cluster sampling
c.
systematic sampling
d.
convenience sampling
88. The population we want to make inferences about is the
a.
sampled population
b.
frame
c.
target population
d.
finite population
c
89. The standard error of the proportion will become larger as
a.
n increases

Chapter 7 – Sampling and Sampling Distributions
b.
p approaches 0
c.
p approaches .5
d.
p approaches 1
90. All of the following are true about the standard error of the mean except
a.
it is larger than the standard deviation of the population
b.
it decreases as the sample size increases
c.
its value is influenced by the standard deviation of the population
d.
it measures the variability in sample means
91. The extent of the sampling error might be affected by all of the following factors except
a.
the variability of the population
b.
the expected value of the sample statistic being used
c.
the sample size
d.
the sampling method used
92. The smallest sample size needed in order to assume the sampling distribution of the sample mean is normally
distributed is when
a.
the population is exponentially distributed
b.
the population is uniformly distributed
c.
the population is only slightly skewed
d.
the population is normally distributed
93. The desired situation is when
a.
the sampled population is smaller than the targeted population
b.
the sampled population is identical to the targeted population
c.
the sampled population is larger than the targeted population
d.
the sampled population is more varied than the targeted population
94. The expected value of the sample mean equals
a.
the mode of the population
b.
the median of the population
c.
the mean of the population
d.
the mid-range of the population
Chapter 7 – Sampling and Sampling Distributions
c
1
95. __________ is a property of a point estimator that is present when the expected value of the point estimator is equal to
the population parameter it estimates.
a.
Predictable
b.
Precise
c.
Symmetric
d.
Unbiased
d
1
96. Which of the following statements about cluster sampling is false?
a.
All elements within the randomly selected clusters form the sample.
b.
It generally requires a smaller total sample size than simple random sampling.
c.
Ideally, each cluster is a representative small-scale version of the entire population.
d.
It provides the best results when the elements within the clusters are not alike.
b
1
97. In stratified random sampling
a.
randomly selected elements within each of the strata form the sample.
b.
all elements within the randomly selected strata form the sample.
c.
randomly selected elements within the randomly selected strata form the sample.
d.
None of the alternatives is true.
a
1
Subjective Short Answer
98. A simple random sample of 8 employees of a corporation provided the following information.
Employee
1
2
3
4
5
6
7
8
Age
25
32
26
40
50
54
22
23
Gender
M
M
M
M
F
M
M
F
a.
Determine the point estimate for the average age of all employees.
b.
What is the point estimate for the standard deviation of the population?
c.
Determine a point estimate for the proportion of all employees who are female.
a.
34
b.
12.57
c.
0.25
1
99. Starting salaries of a sample of five management majors along with their genders are shown below.
Employee
Salary ($1000s)
Gender
1
30
F
Chapter 7 – Sampling and Sampling Distributions
2
28
M
3
22
F
4
26
F
5
19
M
a.
What is the point estimate for the starting salaries of all management majors?
b.
Determine the point estimate for the variance of the population.
c.
Determine the point estimate for the proportion of male employees.
a.
25 (thousands of dollars)
b.
20 (thousands of dollars)
c.
0.4
1
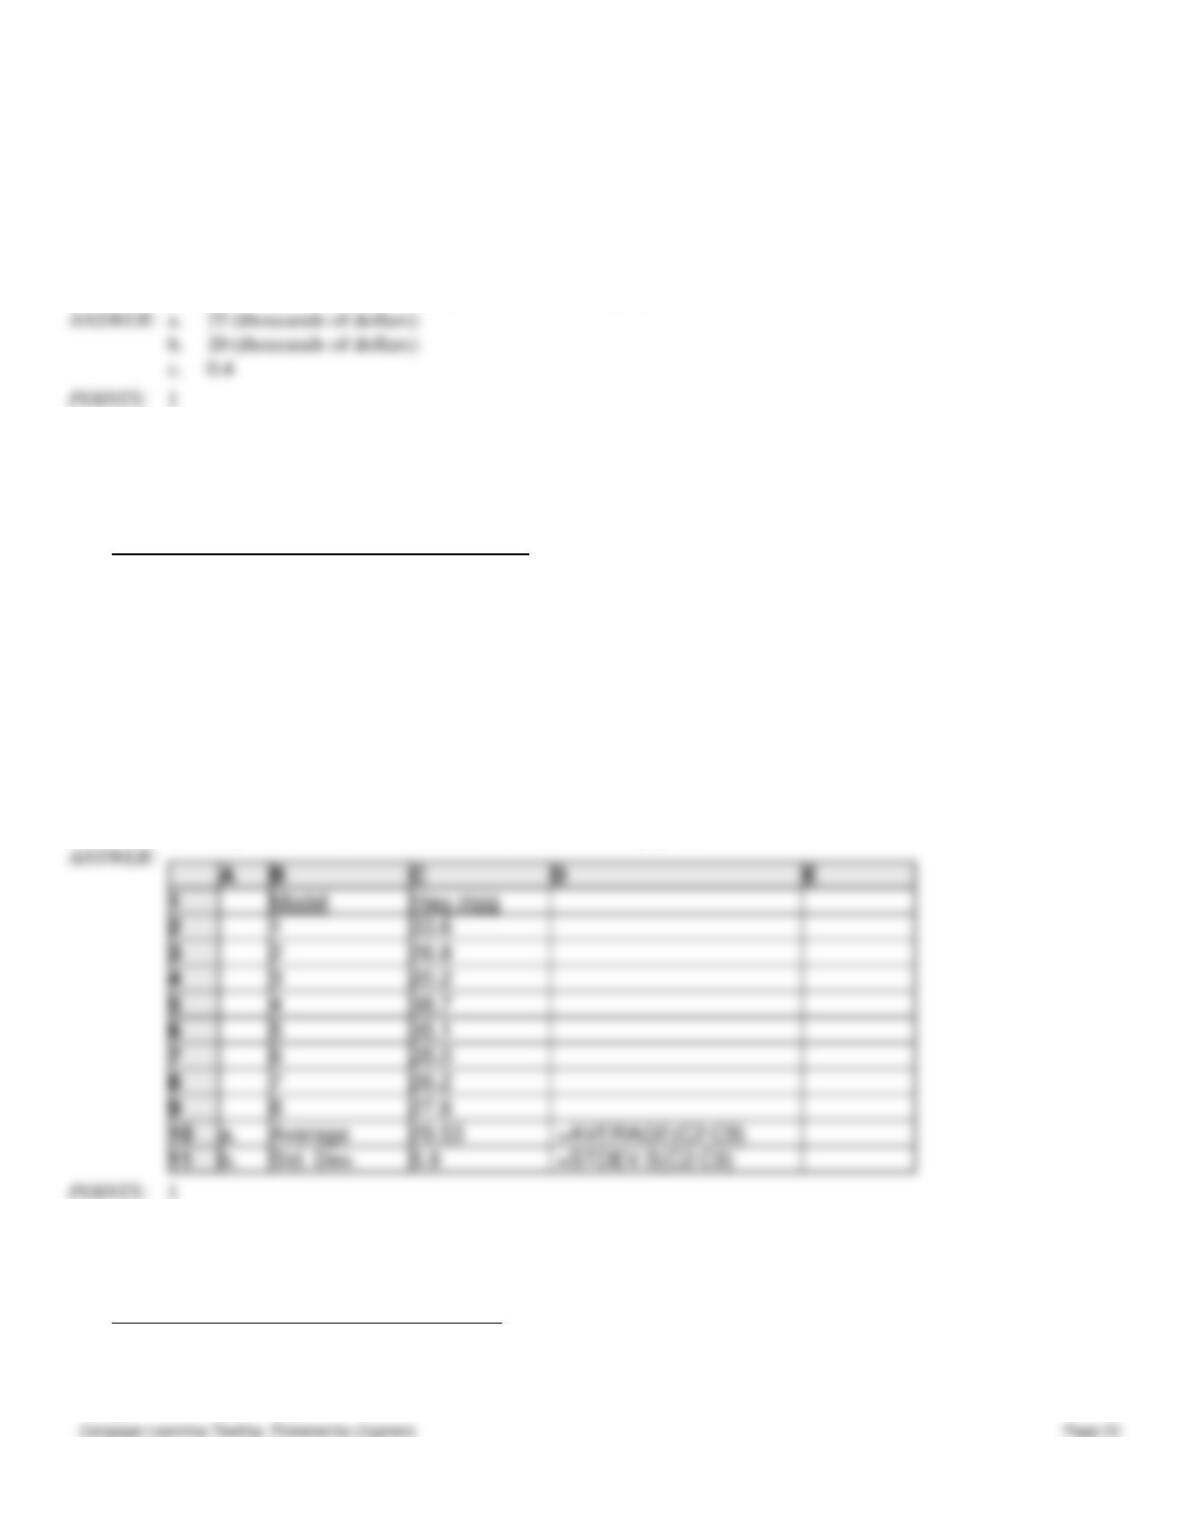
100. A sample of 8 new models of automobiles provides the following data on highway miles per gallon. Use Excel to
answer the questions that follow the data.
Highway Miles
Model
Per Gallon
1
33.6
2
26.8
3
20.2
4
38.7
5
35.1
6
28.0
7
26.2
8
27.6
a.
What is the point estimate for the average highway miles per gallon for all new models of
autos?
b.
Determine the point estimate for the standard deviation of the population.
1
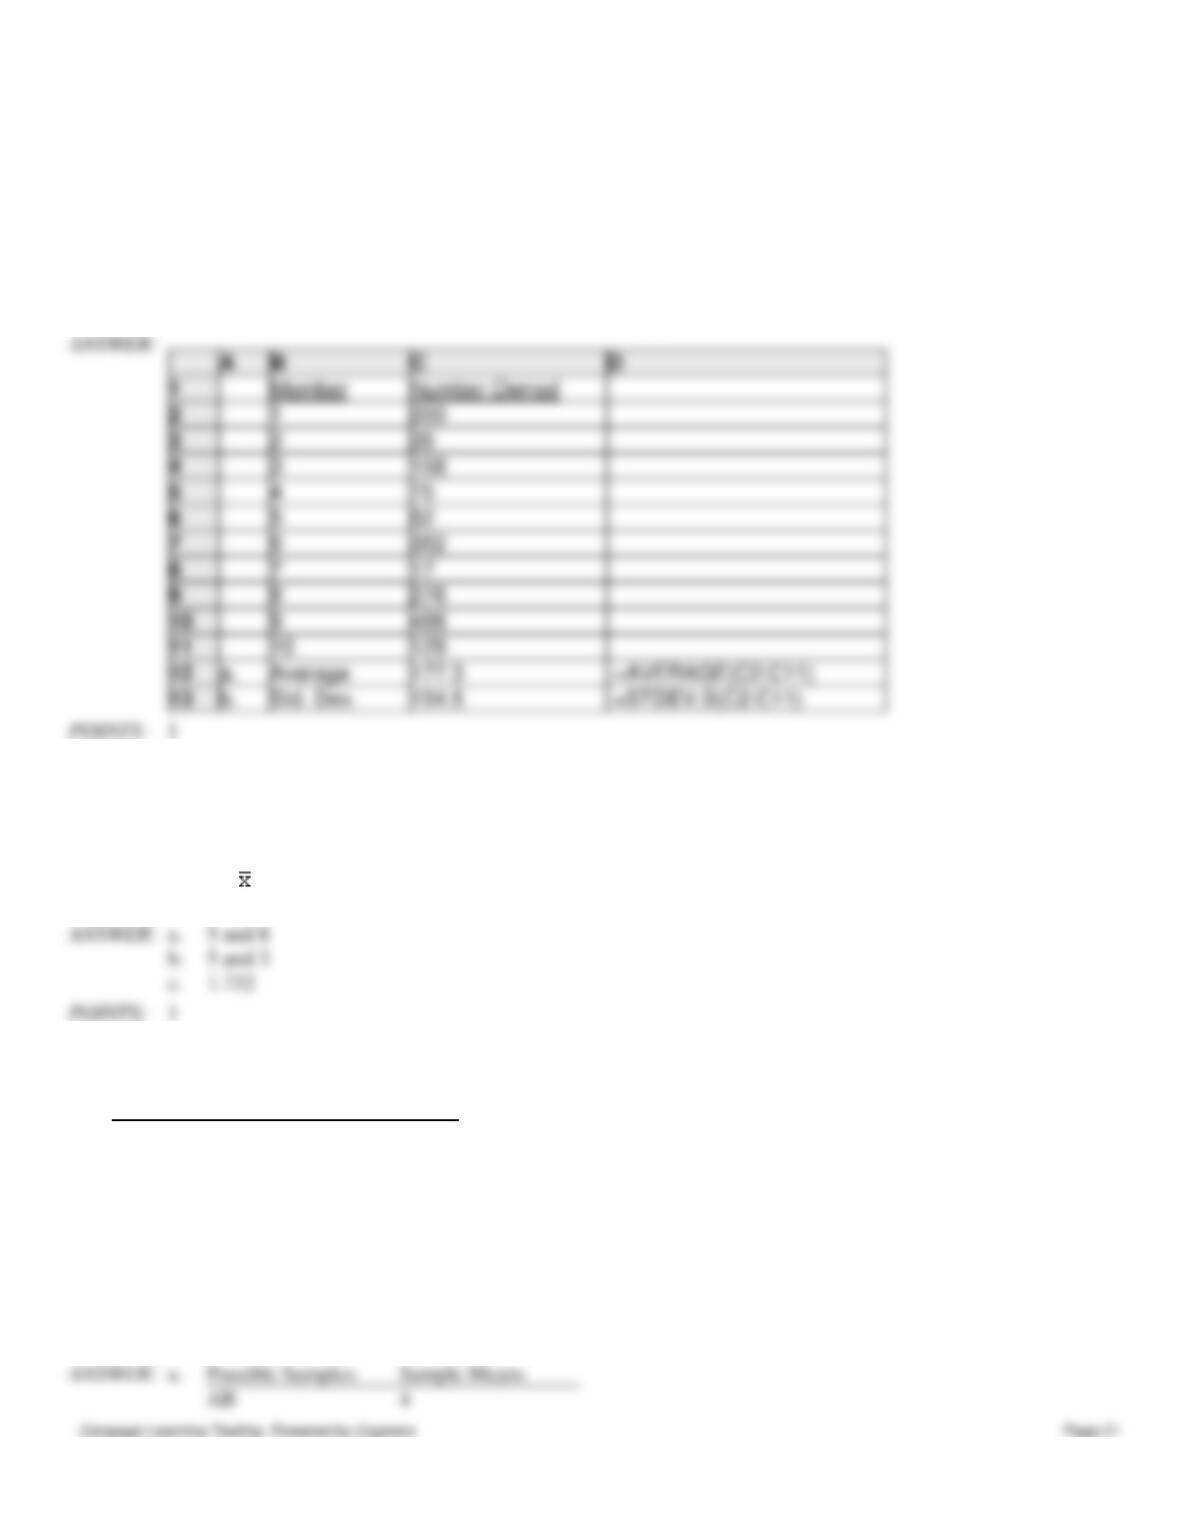
101. A sample of 10 members of a video club provides the following data on number of videos they own. Use Excel to
answer the questions that follow the data.
Member
Number Owned
1
200
2
26
3
158
4
75
Chapter 7 – Sampling and Sampling Distributions
5
52
6
352
7
17
8
276
9
488
10
129
a.
What is the point estimate for the mean number of videos owned by all video club members?
b.
Determine the point estimate for the standard deviation of the population.
1
102. Consider a population of five weights identical in appearance but weighing 1, 3, 5, 7, and 9 ounces.
a.
Determine the mean and the variance of the population.
b.
Sampling without replacement from the above population with a sample size of 2 produces ten
possible samples. Using the ten sample mean values, determine the mean of the population and
the variance of .
c.
Compute the standard error of the mean.
a.
5 and 8
b.
5 and 3
c.
1.732
1
103. Consider a population of five families with the following data representing the number of pets in each family.
Family
Number of Pets
A
2
B
6
C
4
D
3
E
1
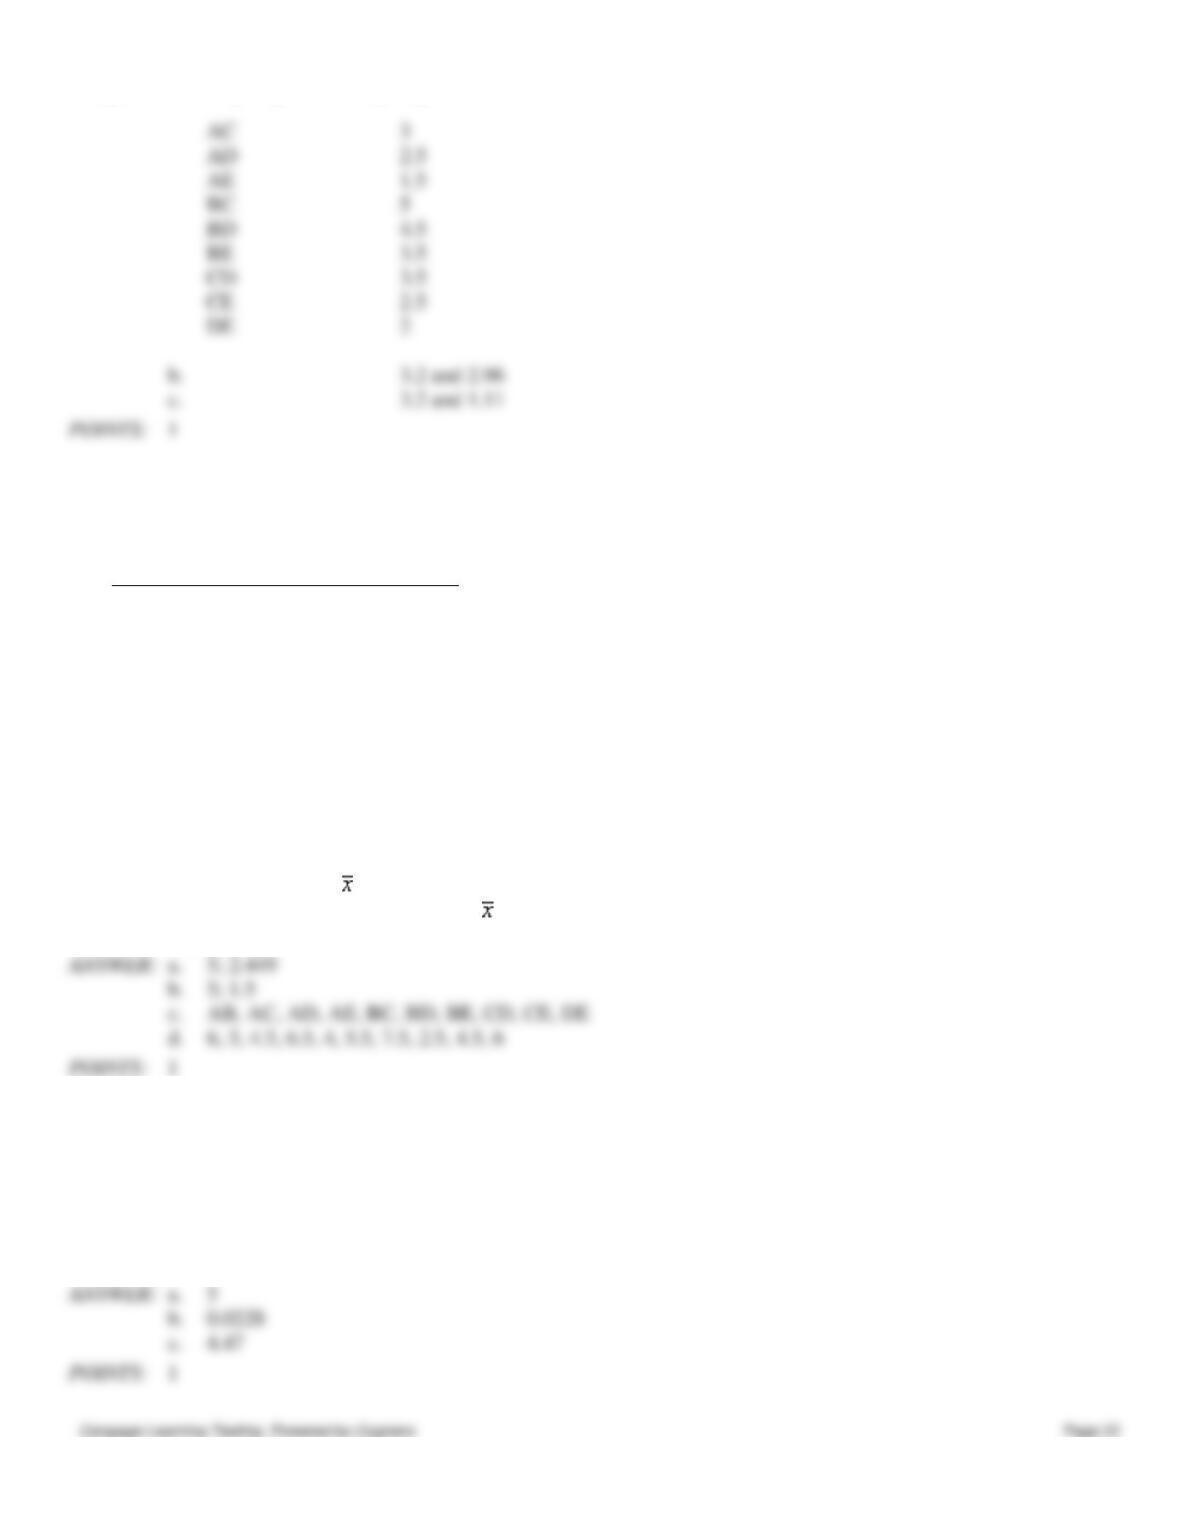
a.
There are ten possible samples of size 2 (sampling without replacement). List the 10 possible
samples of size 2, and determine the mean of each sample.
b.
Determine the mean and the variance of the population.
c.
Using the ten sample mean values, compute the mean and the standard error of the mean.
a.
Possible Samples
Sample Means
4
Chapter 7 – Sampling and Sampling Distributions
104. The following information gives the number of days absent from work for a population of 5 workers at a small
factory.
Number of
Worker
Days Absent
A
5
B
7
C
1
D
4
E
8
a.
Find the mean and the standard deviation for the population.
b.
Samples of size 2 will be drawn from the population. Use the answers in part a to calculate
the expected value and the standard deviation of the sampling distribution of the sample
mean.
c.
Find all the samples of 2 workers that can be extracted from this population. Choose the
samples without replacement.
d.
Compute the sample mean for each of the samples in Part c.
e.
Graph the sample means with the values of on the horizontal axis and the corresponding
relative frequency on the vertical axis.
a.
5; 2.449
b.
5; 1.5
c.
d.
6, 3, 4.5, 6.5, 4, 5.5, 7.5, 2.5, 4.5, 6
1
105. The average weekly earnings of bus drivers in a city are $950 (that is μ) with a standard deviation of $45 (that is σ).
Assume that we select a random sample of 81 bus drivers.
a.
Assume the number of bus drivers in the city is large compared to the sample size. Compute
the standard error of the mean.
b.
What is the probability that the sample mean will be greater than $960?
c.
If the population of bus drivers consisted of 400 drivers, what would be the standard error of
the mean?
a.
b.
0.0228
c.
4.47
1
3
2.5
1.5
5
4.5
3.5
3.5
2.5
2
b.
3.2 and 2.96
c.
3.2 and 1.11
1
106. An automotive repair shop has determined that the average service time on an automobile is 2 hours with a standard
deviation of 32 minutes. A random sample of 64 services is selected.
a.
What is the probability that the sample of 64 will have a mean service time greater than 114
minutes?
b.
Assume the population consists of 400 services. Determine the standard error of the mean.
a.
0.9332
b.
3.67
107. A population of 1,000 students spends an average of $10.50 a day on dinner. The standard deviation of the
expenditure is $3. A simple random sample of 64 students is taken.
a.
What are the expected value, standard deviation, and shape of the sampling distribution of the
sample mean?
b.
What is the probability that these 64 students will spend a combined total of more than
$715.21?
c.
What is the probability that these 64 students will spend a combined total between $703.59 and
$728.45?
a.
10.5; 0.363; normal
b.
0.0314
c.
0.0794
108. There are 8,000 students at the University of Tennessee at Chattanooga. The average age of all the students is 24
years with a standard deviation of 9 years. A random sample of 36 students is selected.
a.
Determine the standard error of the mean.
b.
What is the probability that the sample mean will be larger than 19.5?
c.
What is the probability that the sample mean will be between 25.5 and 27 years?
a.
1.5
b.
0.9986
c.
0.1359
109. The life expectancy in the United States is 75 with a standard deviation of 7 years. A random sample of 49
individuals is selected.
a.
What is the probability that the sample mean will be larger than 77 years?
b.
What is the probability that the sample mean will be less than 72.7 years?
c.
What is the probability that the sample mean will be between 73.5 and 76 years?
d.
What is the probability that the sample mean will be between 72 and 74 years?
e.
What is the probability that the sample mean will be larger than 73.46 years?
a.
0.0228
b.
0.0107
c.
0.7745
d.
0.1573
e.
0.9382
110. SAT scores have an average of 1200 with a standard deviation of 60. A sample of 36 scores is selected.
a.
What is the probability that the sample mean will be larger than 1224?
b.
What is the probability that the sample mean will be less than 1230?
c.
What is the probability that the sample mean will be between 1200 and 1214?
d.
What is the probability that the sample mean will be greater than 1200?
Chapter 7 – Sampling and Sampling Distributions
e.
What is the probability that the sample mean will be larger than 73.46?
a.
b.
c.
d.
e.
111. A bank has kept records of the checking balances of its customers and determined that the average daily balance of
its customers is $300 with a standard deviation of $48. A random sample of 144 checking accounts is selected.
a.
What is the probability that the sample mean will be more than $306.60?
b.
What is the probability that the sample mean will be less than $308?
c.
What is the probability that the sample mean will be between $302 and $308?
d.
What is the probability that the sample mean will be at least $296?
a.
b.
c.
d.
112. Students of a large university spend an average of $5 a day on lunch. The standard deviation of the expenditure is $3.
A simple random sample of 36 students is taken.
a.
What are the expected value, standard deviation, and shape of the sampling distribution of the
sample mean?
b.
What is the probability that the sample mean will be at least $4?
c.
What is the probability that the sample mean will be at least $5.90?
a.
5.0; 0.5; normal
b.
c.
113. The average lifetime of a light bulb is 3,000 hours with a standard deviation of 696 hours. A simple random sample
of 36 bulbs is taken.
a.
What are the expected value, standard deviation, and shape of the sampling distribution of ?
b.
What is the random variable in this problem? Define it in words.
c.
What is the probability that the average life in the sample will be between 2,670.56 and
2,809.76 hours?
d.
What is the probability that the average life in the sample will be greater than 3,219.24 hours?
e.
What is the probability that the average life in the sample will be less than 3,180.96 hours?
a.
3,000; 116; normal
c.
d.
e.
114. MNM Corporation gives each of its employees an aptitude test. The scores on the test are normally distributed with a
mean of 75 and a standard deviation of 15. A simple random sample of 25 is taken from a population of 500.
a.
What are the expected value, the standard deviation, and the shape of the sampling distribution
of ?
b.
What is the random variable in this problem? Define it in words.
Chapter 7 – Sampling and Sampling Distributions
c.
What is the probability that the average aptitude test score in the sample will be between 70.14
and 82.14?
d.
What is the probability that the average aptitude test score in the sample will be greater than
82.68?
e.
What is the probability that the average aptitude test score in the sample will be less than
78.69?
f.
Find a value, C, such that P( ) = .015.
a.
75; 3; normal
c.
0.9387
d.
0.0052
e.
0.8907
81.51
115. The price of a particular brand of jeans has a mean of $37.99 and a standard deviation of $7. A sample of 49 pairs of
jeans is selected. Use Excel to answer the following questions.
a.
What is the probability that the sample of jeans will have a mean price less than $40?
b.
What is the probability that the sample of jeans will have a mean price between $38 and $39?
c.
What is the probability that the sample of jeans will have a mean price within $3 of the
population mean?
a.
.97778
=NORM.DIST(40,37.99,1,TRUE)
b.
.339763
=NORM.DIST(39,37.99,1,TRUE)-NORM.DIST(38,37,99,1,TRUE)
c.
.9973
=NORM.DIST(40.99,37.99,1,TRUE)-NORM.DIST(34.99,37.99,1,TRUE)
116. The mean diameter of a ball bearing produced by a certain manufacturer is 0.80 cm with a standard deviation of 0.03
cm. A sample of 36 ball bearings is randomly selected from a production run. Use Excel to answer the following
questions.
a.
What is the probability that the sample of ball bearings will have a mean less than 0.798 cm?
b.
What is the probability that the sample of ball bearings will have a mean of at least 0.815 cm?
c.
What is the probability that the sample of ball bearings will have a mean between 0.798 and
0.815 cm?
d.
For samples of size 36, 15% of all sample means are at most what diameter?
a.
.344578
=NORM.DIST(0.798,0.8,0.005,TRUE)
b.
.00135
c.
.654072
=NORM.DIST(0.815,0.8,0.005,TRUE)-
NORM.DIST(0.798,0.8,0.005,TRUE)
d.
.794818
=NORM.INV(0.15,0.8,0.005)
117. There are 500 employees in a firm, 45% are female. A sample of 60 employees is selected randomly.
a.
Determine the standard error of the proportion.
b.
What is the probability that the sample proportion of females is between 0.40 and 0.55?
Chapter 7 – Sampling and Sampling Distributions
a.
0.0603
b.
0.7482
118. Ten percent of the items produced by a machine are defective. A random sample of 100 items is selected and
checked for defects.
a.
Determine the standard error of the proportion.
b.
What is the probability that the sample will contain more than 2.5% defective units?
c.
What is the probability that the sample will contain more than 13% defective units?
a.
0.03
b.
0.9938
c.
0.1587
119. A new soft drink is being market tested. It is estimated that 60% of consumers will like the new drink. A sample of
96 taste-tested the new drink.
a.
Determine the standard error of the proportion
b.
What is the probability that more than 70.4% of consumers will indicate they like the drink?
c.
What is the probability that more than 30% of consumers will indicate they do not like the
drink?
a.
0.05
b.
0.0188
c.
0.9772
120. In a large university, 20% of the students are business majors. A random sample of 100 students is selected, and their
majors are recorded.
a.
Compute the standard error of the proportion.
b.
What is the probability that the sample contains at least 12 business majors?
c.
What is the probability that the sample contains less than 15 business majors?
d.
What is the probability that the sample contains between 12 and 14 business majors?
a.
0.04
b.
0.9772
c.
0.1056
d.
0.044
121. In a local university, 10% of the students live in the dormitories. A random sample of 100 students is selected for a
particular study.
a.
What is the probability that the sample proportion of students living in the dormitories is
between 0.172 and 0.178?
b.
What is the probability that the sample proportion of students living in the dormitories is
greater than 0.025?
a.
0.0035
b.
0.9938
122. A department store has determined that 25% of all their sales are credit sales. A random sample of 75 sales is
selected.
a
What is the probability that the sample proportion will be greater than 0.34?
b.
What is the probability that the sample proportion will be between 0.196 and 0.354?
Chapter 7 – Sampling and Sampling Distributions
c.
What is the probability that the sample proportion will be less than 0.25?
d.
What is the probability that the sample proportion will be less than 0.10?
a.
0.0359
b.
0.8411
c.
0.5
d.
0.0014
123. Candidate A is running for president of the student government at a large university. The proportion of voters who
favor the candidate is 0.8. A simple random sample of 100 voters is taken.
a.
What are the expected value, standard deviation, and shape of the sampling distribution of ?
b.
What is the probability that the number of voters in the sample who will not favor Candidate A
will be between 26 and 30?
c.
What is the probability that the number of voters in the sample who will not favor Candidate A
will be more than 16?
a.
0.8; 0.04; normal
b.
0.0606
c.
0.8413
124. In a restaurant, the proportion of people who order coffee with their dinner is 0.9. A simple random sample of 144
patrons of the restaurant is taken.
a.
What are the expected value, standard deviation, and shape of the sampling distribution of ?
b.
What is the random variable in this problem? Define it in words.
c.
What is the probability that the proportion of people who will order coffee with their meal is
between 0.85 and 0.875?
d.
What is the probability that the proportion of people who will order coffee with their meal is at
least 0.945?
a.
0.9; 0.025; normal
the sample proportion of people who order coffee with their dinners out of 144 patrons
c.
0.1359
d.
0.0359
125. Thirty percent of a magazine’s subscribers are female. A random sample of 50 subscribers is taken. Answer the
following questions using Excel.
a.
What is the probability that the proportion of females from this sample is at most 0.25?
b.
What is the probability that the proportion of females from this sample is between 0.22 and
0.28?
c.
What is the probability that the proportion of females from this sample is within .03 of the
population proportion?
a.
.220
=NORM.DIST(0.25,0.3,0.0648,TRUE)
b.
.270
=NORM.DIST(0.28,0.3,0.0648,TRUE)-NORM.DIST(0.22,0.3,0.0648,TRUE)
c.
.357
=NORM.DIST(0.33,0.3,0.0648,TRUE)-NORM.DIST(0.27,0.3,0.0648,TRUE)
126. The proportion of Americans who support the death penalty is 0.53. A sample of 1000 randomly selected Americans
is surveyed by telephone interview. Use Excel to answer the following questions.
Chapter 7 – Sampling and Sampling Distributions
a.
What is the probability that the sample proportion of those supporting the death penalty will be
less than 0.50?
b.
What is the probability that the sample proportion of those supporting the death penalty will be
at least 0.55?
c.
What is the probability that the sample proportion of those supporting the death penalty will be
between 0.50 and 0.55?
d.
For samples of size 1000, 15% of all sample proportions are at most what value?
a.
.028
=NORM.DIST(0.5,0.53,0.0157,TRUE)
b.
.101
c.
.871
=NORM.DIST(0.55,0.53,0.0157,TRUE)-NORM.DIST(0.5,0.53,0.0157,TRUE)
d.
.514
=NORM.INV(0.15,0.53,0.0157)
1
127. A random sample of nine telephone calls in an office provided the following information.
Call Number
Duration (Minutes)
Type of Call
1
3
local
2
8
long distance
3
4
local
4
3
local
5
5
long distance
6
6
local
7
3
local
8
5
local
9
8
local
a.
Determine the point estimate for the average duration of all calls.
b.
What is the point estimate for the standard deviation of the population?
c.
What is the point estimate for the proportion of all calls that were long distance?
a.
b.
1.97
c.
0.222
1
128. A random sample of ten examination papers in a course that was given on a pass or fail basis showed the following
scores.
Paper Number
Grade
Status
1
65
Pass
2
87
Pass
3
92
Pass
4
35
Fail
5
79
Pass
6
100
Pass
7
48
Fail
8
74
Pass
9
79
Pass
10
91
Pass
Chapter 7 – Sampling and Sampling Distributions
a.
What is the point estimate for the mean of the population?
b.
What is the point estimate for the standard deviation of the population?
c.
What is the point estimate for the proportion of all students who passed the course?
a.
75
b.
20.48
c.
0.8
129. Roger Hall, who oversees six Ford dealerships, believes that the colors chosen by customers who special-order their
cars best reflect most customers’ true color preferences. For that reason, he has tabulated the color requests specified in a
sample of 56 Mustang coupe special orders placed this year. The sample data are listed below.
Black
Red
White
Blue
Blue
Green
Red
Black
Red
White
Blue
White
Red
Red
Black
Black
Green
Black
Red
Black
Blue
Black
White
Green
Blue
Red
Black
White
Black
Red
Black
Blue
Blue
Black
Green
White
Black
Red
Red
White
Red
Red
Blue
Black
Red
Black
Green
Black
Green
Red
Black
White
Black
Red
Black
White
a. What is the point estimate of the proportion of all Mustang coupe special orders that specify a color preference of
black?
b. Describe the sampling distribution of , where is the proportion of Mustang coupe special orders that specify a
color preference of black. Assume that the proportion of all Mustang coupe special orders having a color preference of
black is .36.
c. What is the probability that a simple random sample of 56 special orders will provide an estimate of the population
proportion of special orders specifying the color black that is within plus or minus .05 of the actual population proportion,
assuming p = .36? In other words, what is the probability that will be between .31 and .41?
130. Missy Walters owns a mail-order business specializing in baby clothes. Missy is confident the dollar amounts of all
her orders are normally distributed or nearly so. Assume she knows the mean and standard deviation are $249 and $46,
respectively, for all orders she receives.
a. Describe the sampling distribution of , where is the mean dollar-amount of an order for a sample of 10 orders.
b. What is the probability that a simple random sample of 30 orders will provide an estimate of the population mean
dollar-amount of an order that is within plus or minus $10 of the actual population mean?
c. What happens to the sampling distribution of when the sample size is increased from 30 to 90? With a sample size of
90, what is the probability that will be between $239 and $259?