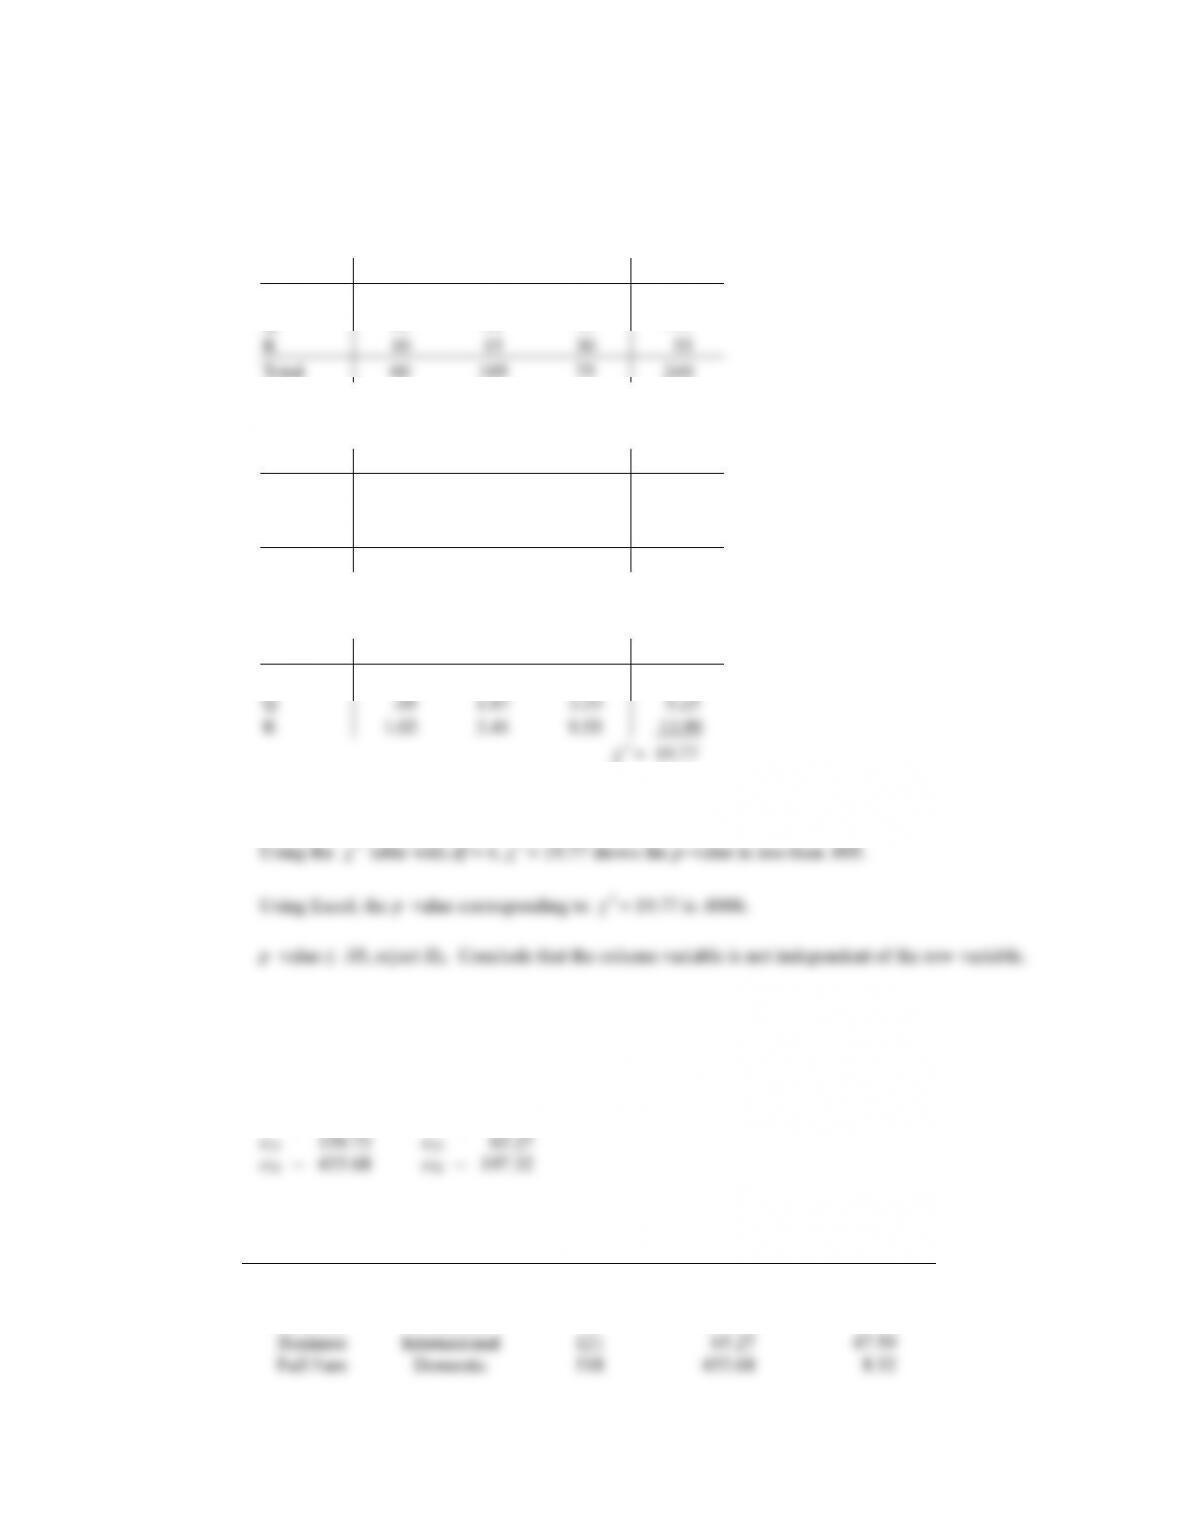
20. H0: The column variable is independent of the row variable
Ha: The column variable is dependent on the row variable
Observed Frequencies (fij)
A
B
C
Total
P
20
30
20
70
Q
30
60
25
115
R
10
15
30
55
Total
60
105
75
240
Expected Frequencies (eij)
A
B
C
Total
P
17.50
30.63
21.88
70
Q
28.75
50.31
35.94
115
R
13.75
24.06
17.19
55
Total
60
105
75
240
Chi–Square Calculations (fij – eij)2 / eij
A
B
C
Total
P
.36
.01
.16
.53
Q
.05
5.25
R
Degrees of freedom = (r – 1)(c – 1) = (3 – 1)(3– 1) = 4
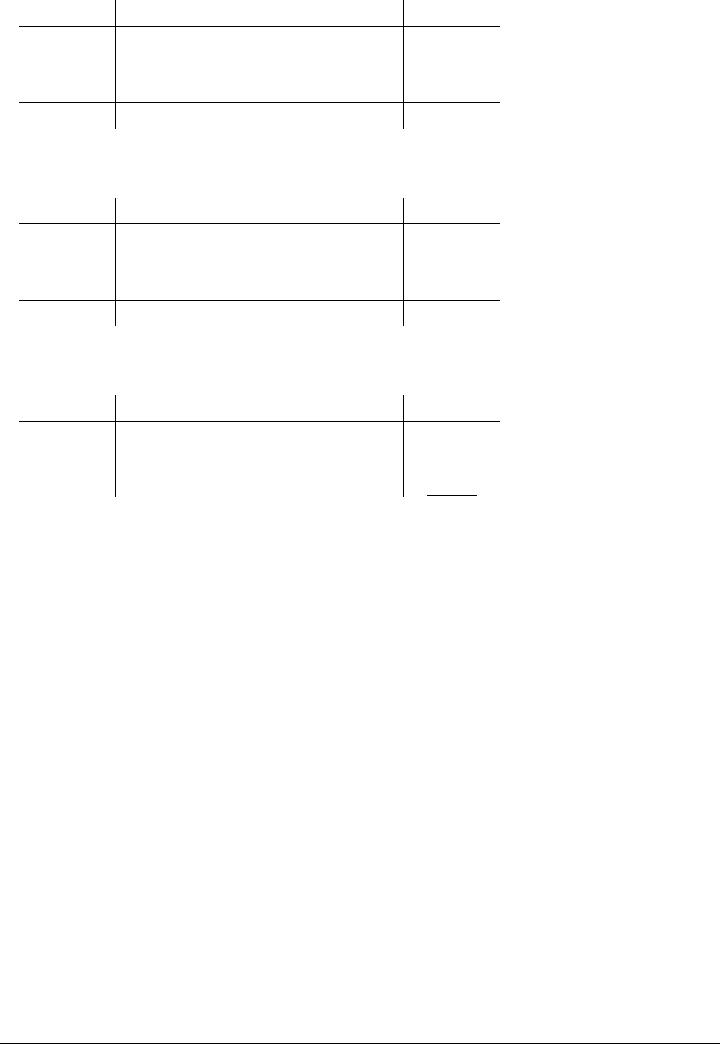
21. a. H0: Type of ticket purchased is independent of the type of flight
Ha: Type of ticket purchased is not independent of the type of flight
Expected Frequencies:
e11 = 35.59 e12 = 15.41
Observed
Expected
Frequency
Frequency
Chi–square
Ticket
Flight
(fi)
(ei)
(fi – ei)2 / ei
First
Domestic
29
35.59
1.22
First
International
22
15.41
2.82
Business
Domestic
95
150.73
20.61
Business
International
65.27
47.59
Full Fare
Domestic
455.68
8.52
Full Fare
Degrees of freedom = (r – 1)(c – 1) = (3 – 1)(2 – 1) = 2
Using the
2
table with df = 2,
2
= 100.43 shows the p–value is less than .005.
2
b. Column Percentages
Type of Flight
Type of Ticket
Domestic
International
First Class
4.5%
7.9%
Business Class
14.8%
43.5%
Economy Class
80.7%
48.6%
A higher percentage of first class and business class tickets are purchased for international flights
compared to domestic flights. Economy class tickets are purchased more for domestic flights. The
22. a. H0: Employment plan is independent of the type of company
Ha: Employment plan is not independent of the type of company
Observed Frequency (fij)
Employment Plan
Private
Public
Total
Add Employees
37
32
69
No Change
19
34
53
Lay Off Employees
16
42
58
Total
72
Expected Frequency (eij)
Employment Plan
Private
Public
Total
Add Employees
27.6
41.4
69
No Change
21.2
31.8
53
Lay Off Employees
23.2
34.8
58
Total
Chi Square Calculations (fij – eij)2 / eij
Employment Plan
Private
Public
Total
Add Employees
3.20
2.13
5.34
No Change
0.23
0.15
0.38
Lay Off Employees
2.23
1.49
3.72

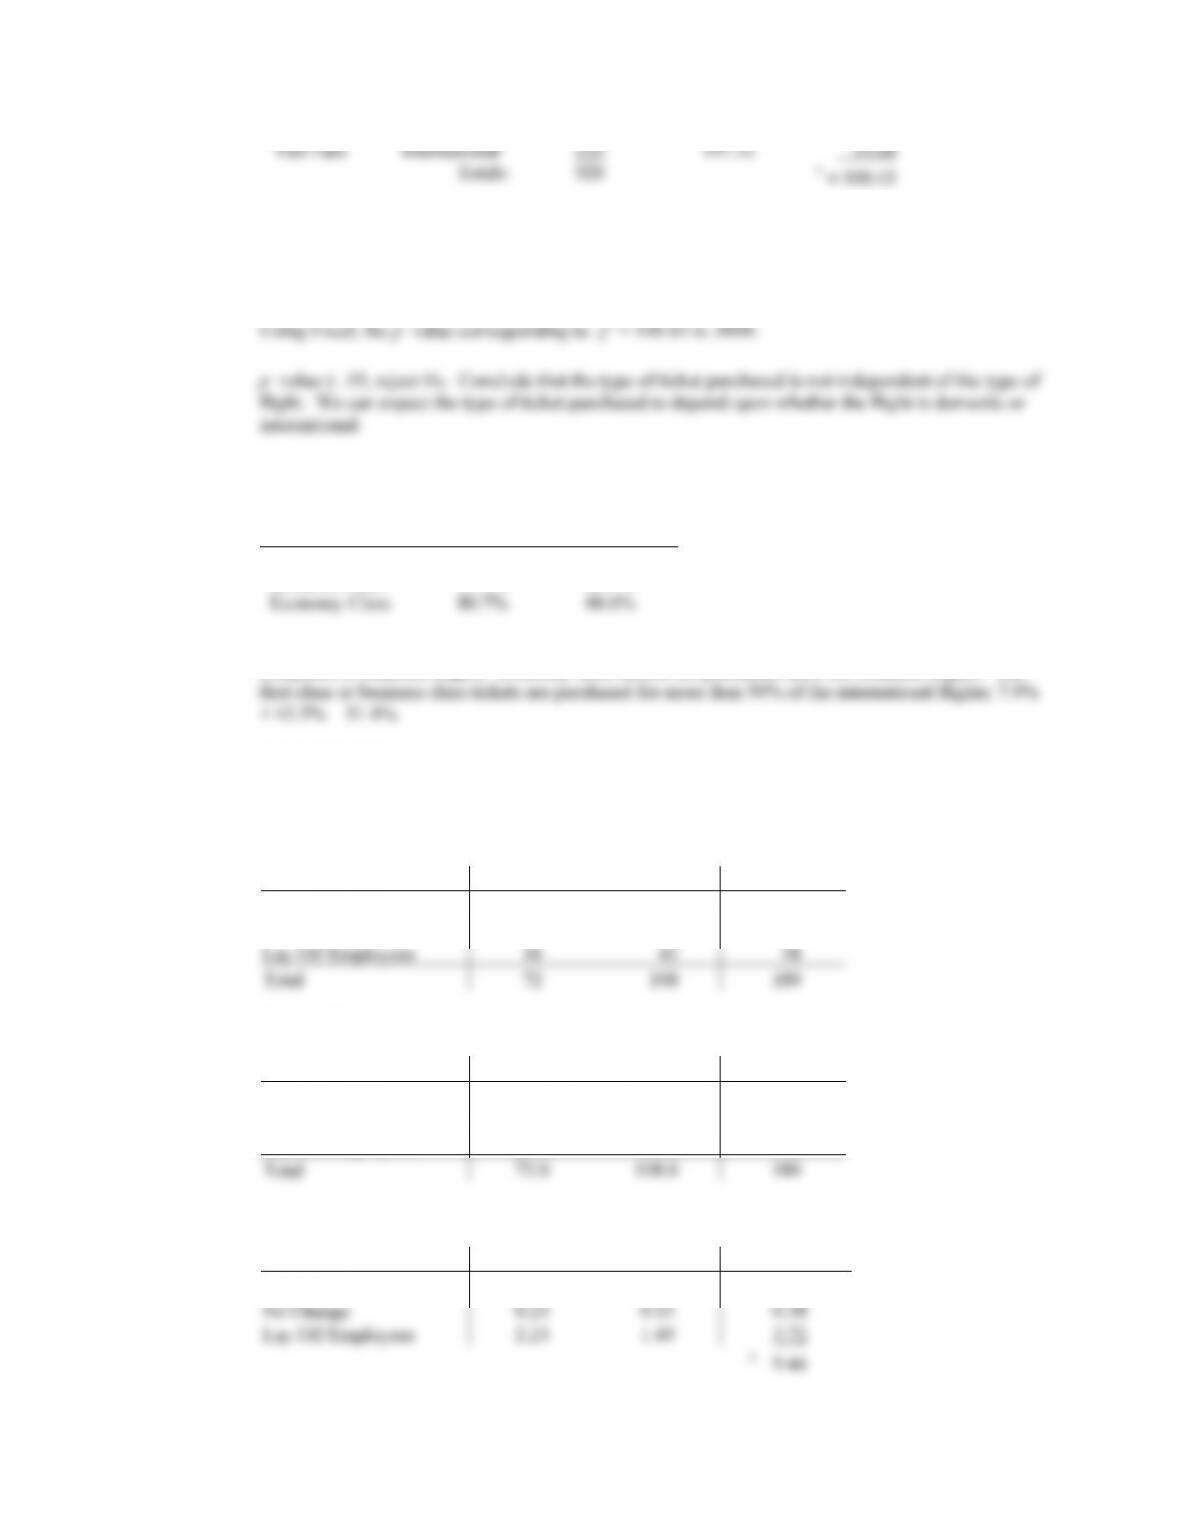
Degrees of freedom = (r – 1)(c – 1) = (3 – 1)(2 – 1) = 2
Using the
2
table with df = 2,
2
= 9.44 shows the p–value is less than .01
2
Employment Plan
Private
Public
Add Employees
.5139
.2963
No Change
.2639
.3148
Lay Off Employees
.2222
.3889
no change and lay off employees planned. 38.89% of public companies are planning to lay off
employees over the next 12 months. 69/180 = .3833, or 38.33% of the companies in the survey are
planning to hire and add employees during the next 12 months.
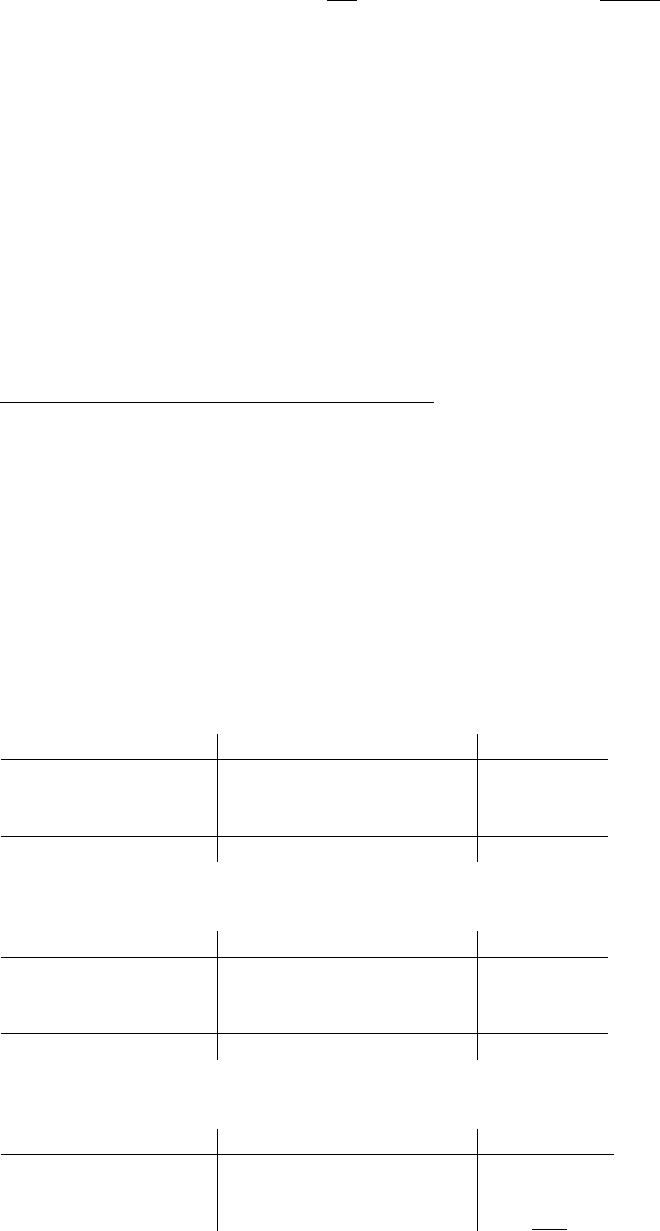
Observed Frequencies (fij)
Health Insurance
Small
Medium
Large
Total
Yes
36
65
88
189
No
14
10
12
36
Total
50
75
100
225
Health Insurance
Small
Medium
Large
Total
Yes
42
63
84
189
No
8
12
16
36
Total
50
75
100
225
Health Insurance
Small
Medium
Large
Total
Yes
.86
.06
.19
1.11
No
4.50
.33
1.00
5.83
2
= 6.94
Using the
2
table with df = 2,
2
= 6.94 shows the p–value is between .025 and .05.
Using Excel, the p–value corresponding to
2
= 6.94 is .0311.
p–value
.05, reject H0. Conclude health insurance coverage is not independent of the size of
Small 14/50 = 28%
Medium 10/75 = 13%
Large 12/100 = 12%
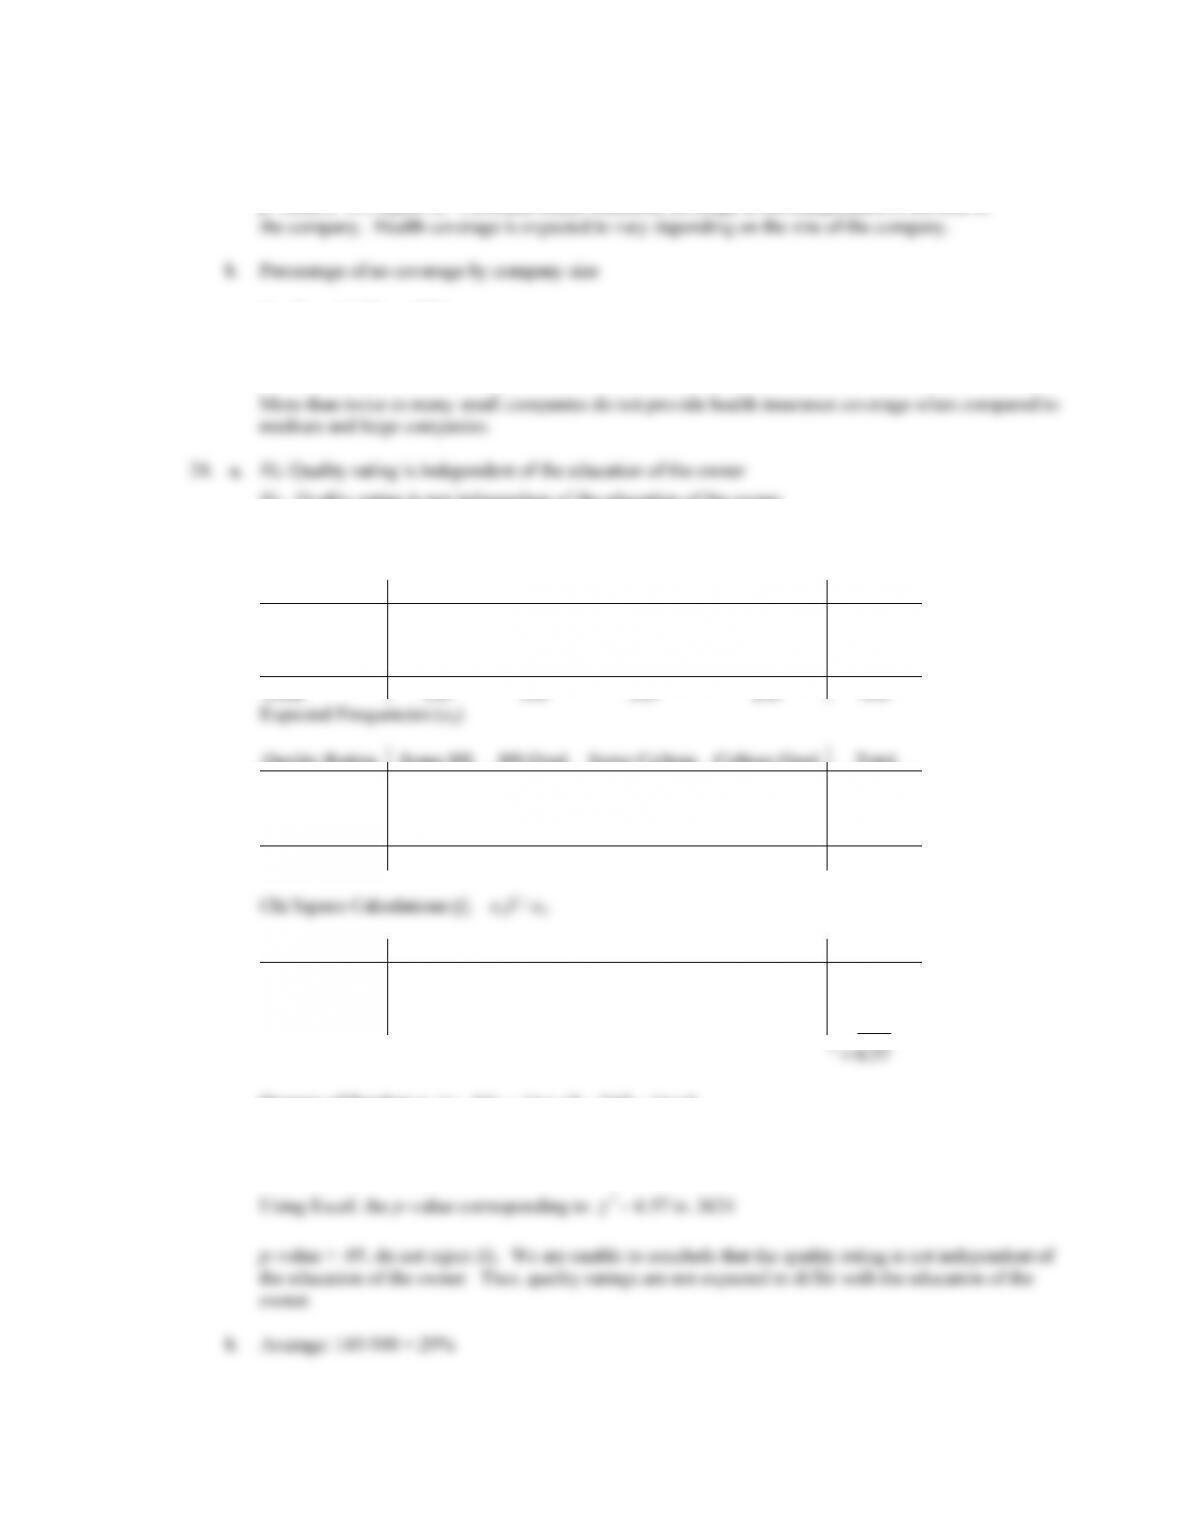
Ha: Quality rating is not independent of the education of the owner
Observed Frequencies (fij)
Quality Rating
Some HS
HS Grad
Some College
College Grad
Total
Average
35
30
20
60
145
Outstanding
45
45
50
90
230
Exceptional
20
25
30
50
125
Total
100
100
100
200
500
Quality Rating
Some HS
HS Grad
Some College
College Grad
Total
Average
29
29
29
58
145
Outstanding
46
46
46
92
230
Exceptional
25
25
25
50
125
Total
100
100
100
200
500
Quality Rating
Some HS
HS Grad
Some College
College Grad
Total
Average
1.24
.03
2.79
.07
4.14
Outstanding
.02
.02
.35
.04
.43
Exceptional
1.00
.00
1.00
.00
2.00
Degrees of freedom = (r – 1)(c – 1) = (3 – 1)(4 – 1) = 6
Using the
2
table with df = 6,
2
= 6.57 shows the p–value is greater than .10
2
Outstanding: 230/500 = 46%
Exceptional: 125/500 = 25%
New owners look to be pretty satisfied with their new automobiles with almost 50% rating the
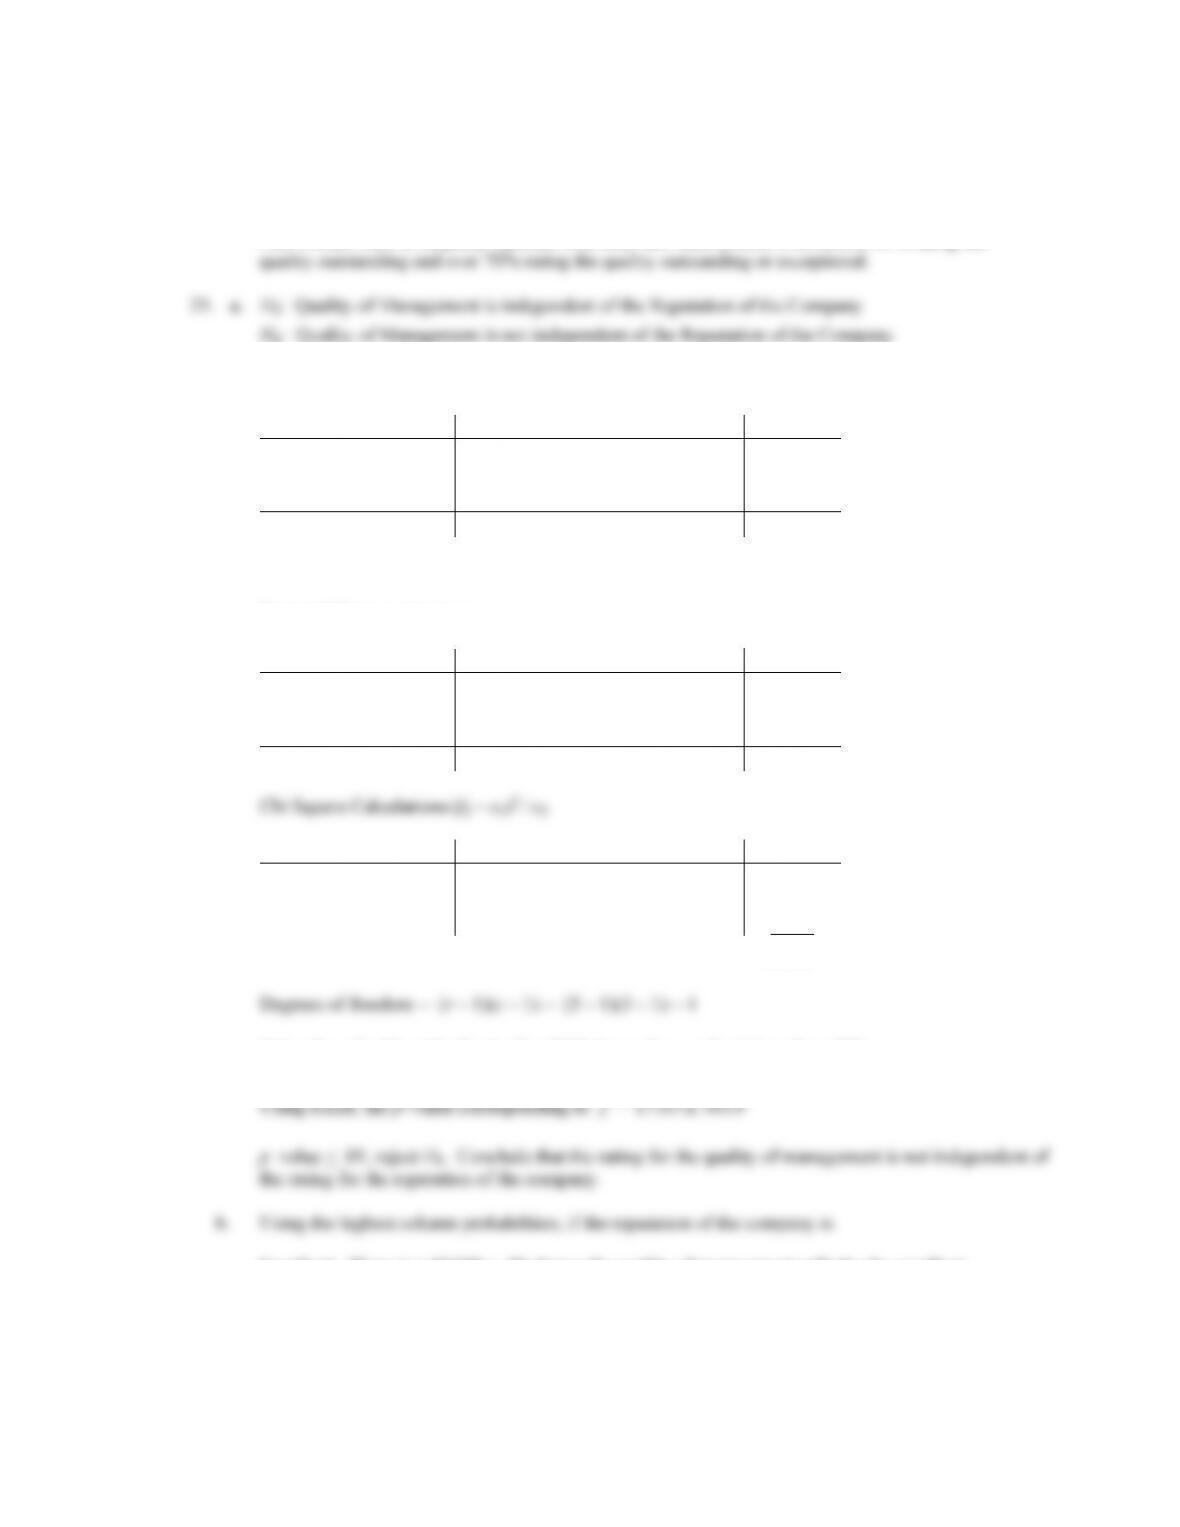
Observed Frequencies (fij)
Quality of Management
Excellent
Good
Fair
Total
Excellent
40
25
5
70
Good
35
35
10
80
Fair
25
10
15
50
Total
100
70
30
200
Expected Frequencies (eij)
Quality of Management
Excellent
Good
Fair
Total
Excellent
35.0
24.5
10.5
70
Good
40.0
28.0
12.0
80
Fair
25.0
17.5
7.5
50
Total
100
70
30
200
Quality of Management
Excellent
Good
Fair
Total
Excellent
.71
.01
2.88
3.61
Good
.63
1.75
.33
2.71
Fair
.00
3.21
7.50
10.71
c
2=17.03
Using the
2
table with df = 4,
2
= 17.03 shows the p–value is less than .005
2
Excellent: There is a 40/100 = .40 chance the quality of management will also be excellent.
Good: There is a 35/70 = .50 chance the quality of management will also be good.
Fair: There is a 15/30 = .50 chance the quality of management will also be fair.
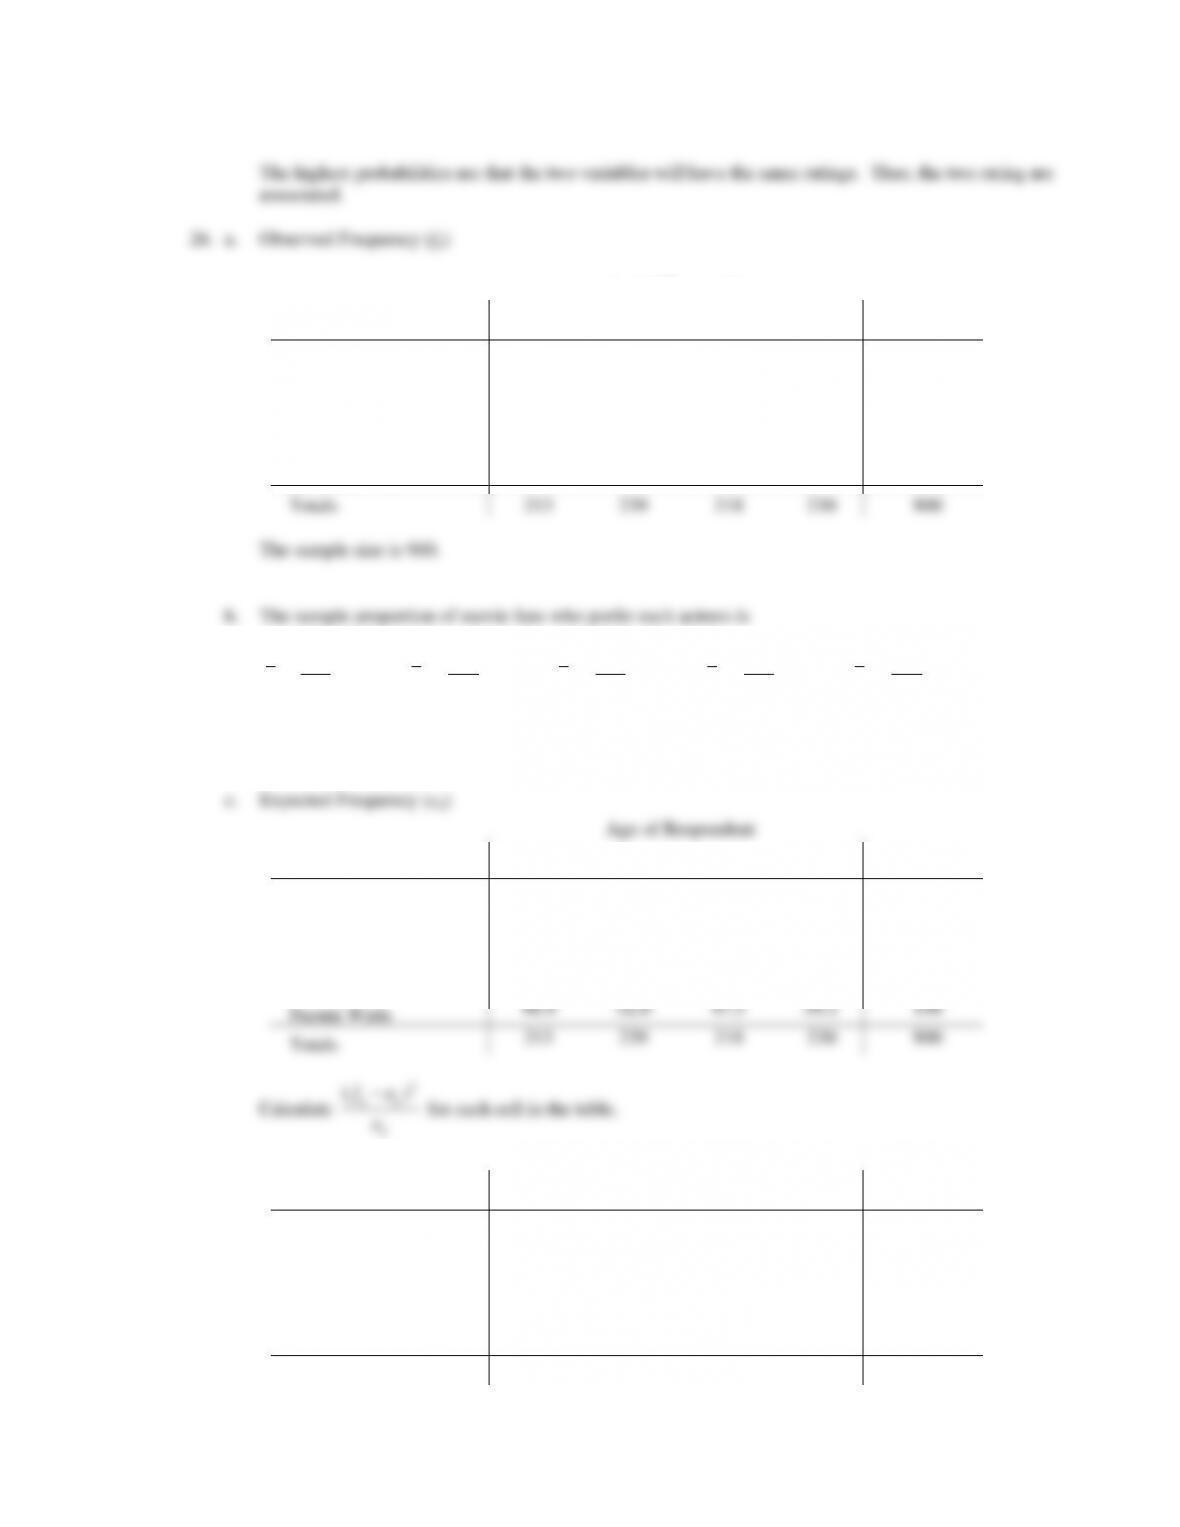
Age of Respondent
Actress
18–30
31–44
45–58
Over 58
Totals
Jessica Chastain
51
50
41
42
184
Jennifer Lawrence
63
55
37
50
205
Emmanuelle Riva
15
44
56
74
189
Quvenzhané Wallis
48
25
22
31
126
Naomi Watts
36
65
62
33
196
Totals
239
900
1
184 .2044
900
p==
,
2
205 .2278
900
p==
,
3
189 .2100
900
p==
,
4
126 .1400
900
p==
,
5
196 .2178
900
p==
The movie fans favored Jennifer Lawrence, but three other nominees (Jessica Chastain, Emmanuelle
Riva, and Naomi Watts) each were favored by almost as many of the fans.
Age of Respondent
Actress
18–30
31–44
45–58
Over 58
Totals
Jessica Chastain
43.5
48.9
44.6
47.0
184
Jennifer Lawrence
48.5
54.4
49.7
52.4
205
Emmanuelle Riva
44.7
50.2
45.8
48.3
189
Quvenzhané Wallis
29.8
33.5
30.5
32.2
126
Naomi Watts
46.4
52.0
47.5
50.1
196
Totals
Age of Respondent
Actress
18–30
31–44
45–58
Over 58
Totals
Jessica Chastain
1.28
0.03
0.29
0.54
2.12
Jennifer Lawrence
4.32
0.01
3.23
0.11
7.66
Emmanuelle Riva
19.76
0.76
2.28
13.67
36.48
Quvenzhané Wallis
11.08
2.14
2.38
0.04
15.65
Naomi Watts
2.33
3.22
4.44
5.83
15.82
Totals
38.77
6.16
12.61
20.20
77.74
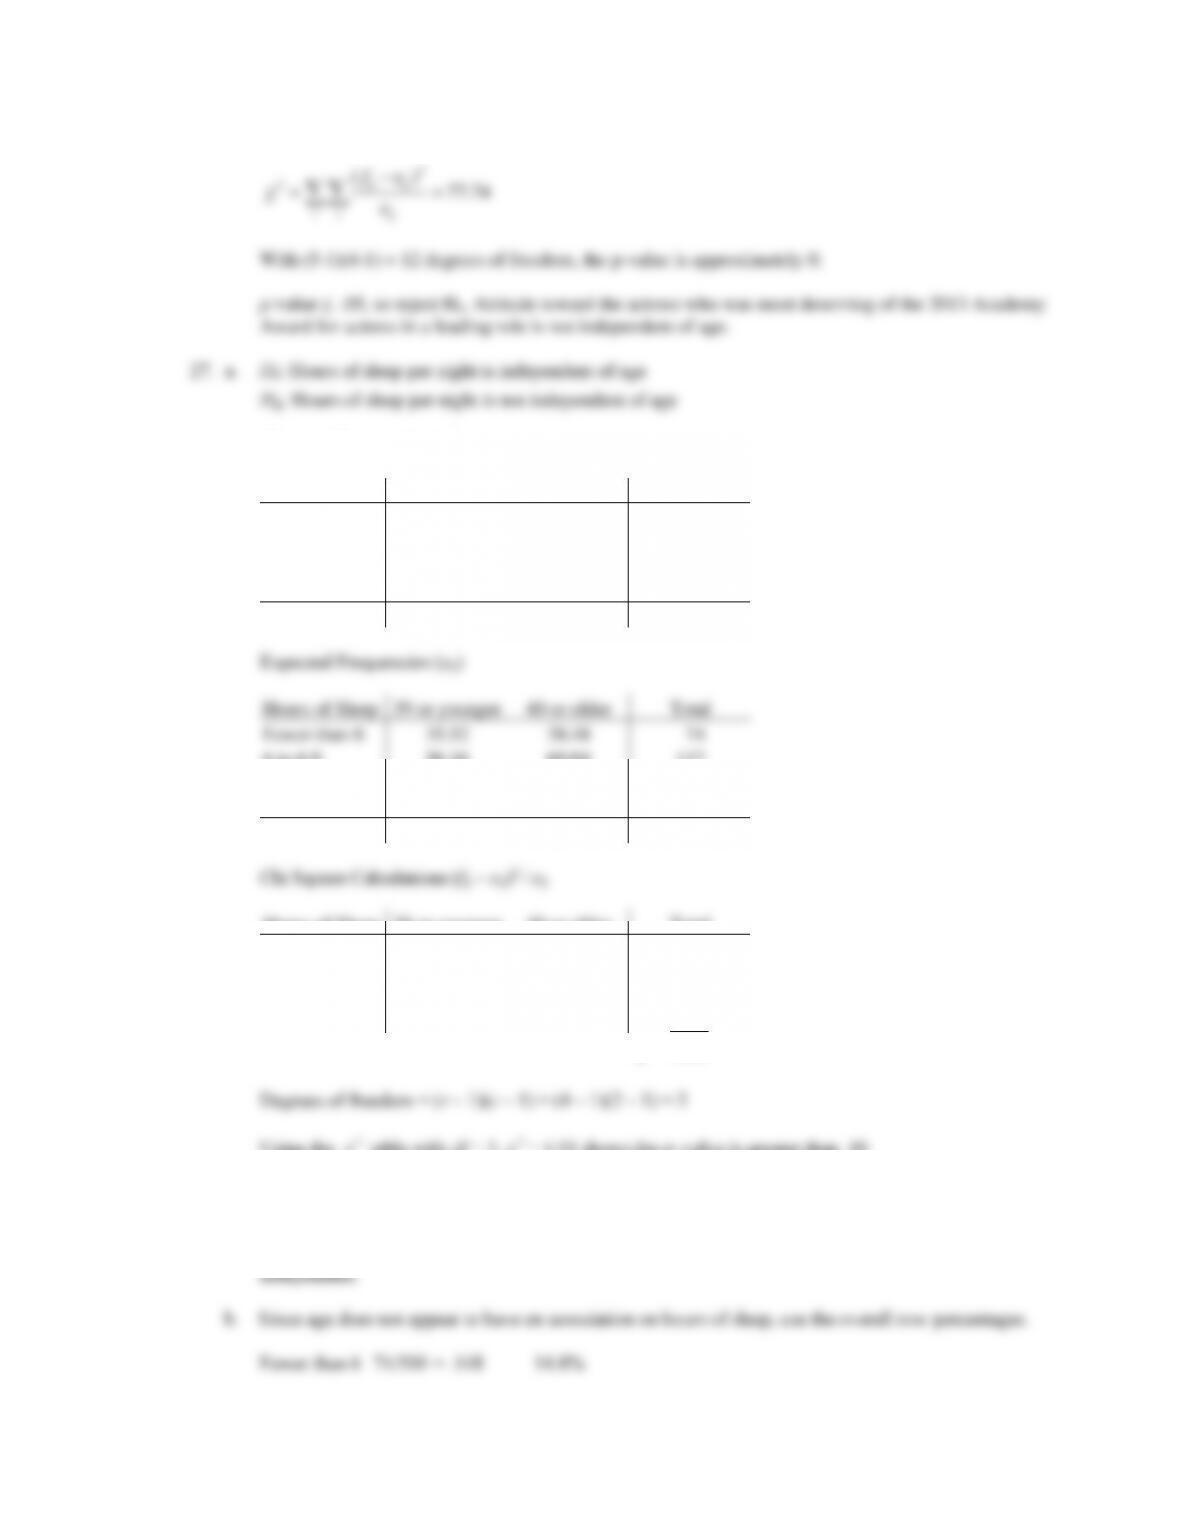
Observed Frequencies (fij)
Hours of Sleep
39 or younger
40 or older
Total
Fewer than 6
38
36
74
6 to 6.9
60
57
117
7 to 7.9
77
75
152
8 or more
65
92
157
Total
240
260
500
Hours of Sleep
39 or younger
40 or older
Total
Fewer than 6
35.52
38.48
74
6 to 6.9
56.16
60.84
117
7 to 7.9
72.96
79.04
152
8 or more
75.36
81.64
157
Total
240
260
500
Hours of Sleep
39 or younger
40 or older
Total
Fewer than 6
.17
.16
.33
6 to 6.9
.26
.24
.50
7 to 7.9
.22
.21
.43
8 or more
1.42
1.31
2.74
2
= 4.01
Using the
2
table with df = 3,
2
= 4.01 shows the p–value is greater than .10.
Using Excel, the p–value corresponding to
2
= 4.01 is .2604.
p–value > .05, do not reject H0. Cannot reject the assumption that age and hours of sleep are

6 to 6.9 117/500 = .234 23.4%
7 to 7.9 152/500 = .304 30.4%
8 or more 157/500 = .314 31.4%
30.4% + 31.4% = 61.8% of individuals get seven or more hours of sleep a night.
28. Expected Frequencies:
e11 = 11.81 e12 = 8.44 e13 = 24.75
e21 = 8.40 e22 = 6.00 e23 = 17.60
e31 = 21.79 e32 = 15.56 e33 = 45.65
Observed
Expected
Con
Con
24
11.81
12.57
Con
Mixed
8
8.44
.02
Con
Pro
13
24.75
5.58
Mixed
Con
8
8.40
.02
Mixed
Mixed
13
6.00
8.17
Mixed
Pro
11
17.60
2.48
Pro
Con
10
21.79
6.38
Pro
Mixed
9
15.56
2.77
Pro
Pro
64
45.65
7.38
Using Excel, the p–value corresponding to
2
= 45.36 is .0000.
p–value
.01, reject H0. Conclude that the ratings of the two hosts are not independent. The host
responses are more similar than different and they tend to agree or be close in their ratings.
a. H0: p1 – p2 = 0
Ha: p1 – p2 ≠ 0
b.
p1
= 312/1200 = .26
2
p
= 512/1600 = .32
c.
1 1 2 2
12
1200(.26) 1600(.32) .2943
1200 1600
n p n p
pnn
++
= = =
++
( ) ( )
12
(.26 .32) 3.45
11
11 .2943 1 .2943
11200 1600
pp
z
pp
−−
= = = −
−+
−+
.26(1 .26) .32(1 .32)
(.26 .32) 1.96 1200 1600
−−
− +
2
p
= 90/900 = .10
1 1 2 2
12
76 90 .1277
400 900
n p n p
pnn
++
= = =
++
( ) ( )
12
12
.19 .10 4.49
11
11 .1277 1 .1277
1400 900
pp
z
pp
nn
−−
= = =
−+
−+
.19(1 .19) .10(1 .10)
.19 .10 1.96 400 900
−−
− +
.09 .0432 (.0468 to .1332)
2
p
1 1 2 2
12
95 .0341
142 268
n p n p
pnn
++
= = =
++
( ) ( )
12
12
.0634 .0187 2.37
11
11 .0341 1 .0341
1142 268
pp
z
pp
nn
−−
= = =
−+
−+
b. Using
21
pp−
to express the difference as an increase for March 2008,
21
.4667 .35 .1167pp− = − =
12
.35(1 .35) .4667(1 .4667) .0529
200 150
pp
s−
−−
= + =