
Chapter 14
Time Series Analysis and Forecasting
Learning Objectives
1. Be able to construct a time series plot and identify the underlying pattern in the data.
2. Understand how to measure forecast accuracy.
3. Be able to use smoothing techniques such as moving averages and exponential smoothing to forecast a
time series with a horizontal pattern.
4. Know how simple linear regression can be used to forecast a time series with a linear trend.
5. Be able to develop a quadratic trend equation and an exponential trend equation to forecast a time
series with a curvilinear or nonlinear trend.
6. Know how to develop forecasts for a time series that has a seasonal pattern.
7. Know how time series decomposition can be used to separate or decompose a time series into season,
trend, and irregular components.
8. Be able to deseasonalize a time series.
9. Know the definition of the following terms:
time series
mean squared error
time series plot
mean absolute percentage error
horizontal pattern
moving average
stationary time series
weighted moving average
trend pattern
smoothing constant
seasonal pattern
time series decomposition
cyclical pattern
additive model
mean absolute error
multiplicative model
Solutions:
1. The following table shows the calculations for parts (a), (b), and (c).
Week
Time Series
Value
Forecast
Forecast
Error
Absolute
Value of
Forecast
Error
Squared
Forecast
Error
Percentage
Error
Absolute Value
of Percentage
Error
1
18
2
13
18
-5
5
25
-38.46
38.46
3
16
13
3
3
9
18.75
18.75
4
11
16
-5
5
25
-45.45
45.45
5
17
11
6
6
36
35.29
35.29
6
14
17
-3
3
9
-21.43
21.43
Totals
22
104
-51.30
159.38
a. MAE = 22/5 = 4.4
b. MSE = 104/5 = 20.8
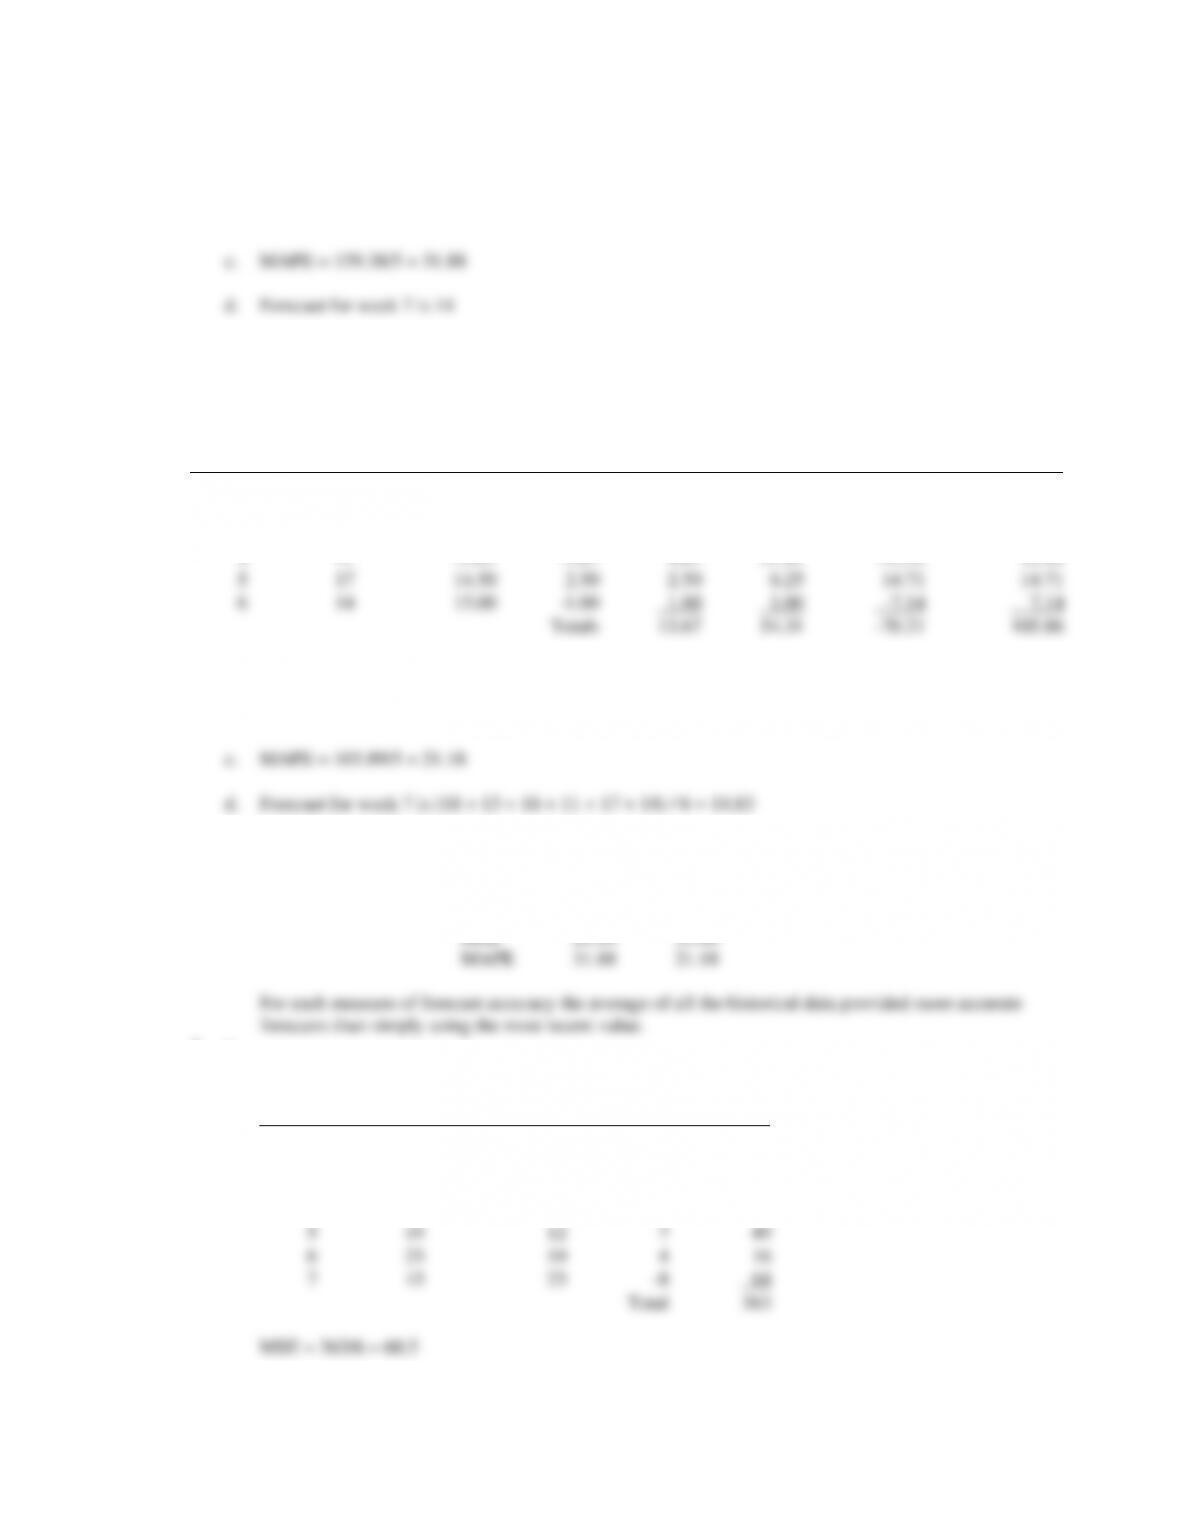
2. The following table shows the calculations for parts (a), (b), and (c).
Week
Time Series
Value
Forecast
Forecast
Error
Absolute
Value of
Forecast
Error
Squared
Forecast
Error
Percentage
Error
Absolute Value
of Percentage
Error
1
18
2
13
18.00
-5.00
5.00
25.00
-38.46
38.46
3
16
15.50
0.50
0.50
0.25
3.13
3.13
4
11
15.67
-4.67
4.67
21.81
-42.45
42.45
5
17
14.50
2.50
2.50
6.25
14.71
14.71
6
14
15.00
-1.00
1.00
1.00
-7.14
7.14
Totals
13.67
54.31
-70.21
105.86
a. MAE = 13.67/5 = 2.73
b. MSE = 54.31/5 = 10.86
3. The following table shows the measures of forecast error for both methods.
Exercise 1
Exercise 2
MAE
4.40
2.73
MSE
20.80
10.86
MAPE
31.88
21.18
4. a.
Month
Time Series
Value
Forecast
Forecast
Error
Squared
Forecast
Error
1
24
2
13
24
–11
121
3
20
13
7
49
4
12
20
-8
64
5
19
12
7
49
6
23
19
4
16
7
15
23
-8
64
Total
363
Forecast for month 8 = 15
b.
Week
Time Series
Value
Forecast
Forecast
Error
Squared
Forecast
Error
1
24
2
13
24.00
-11.00
121.00
3
20
18.50
1.50
2.25
4
12
19.00
-7.00
49.00
5
19
17.25
1.75
3.06
6
23
17.60
5.40
29.16
7
15
18.50
-3.50
12.25
Total
216.72
MSE = 216.72/6 = 36.12
c. The average of all the previous values is better because MSE is smaller.
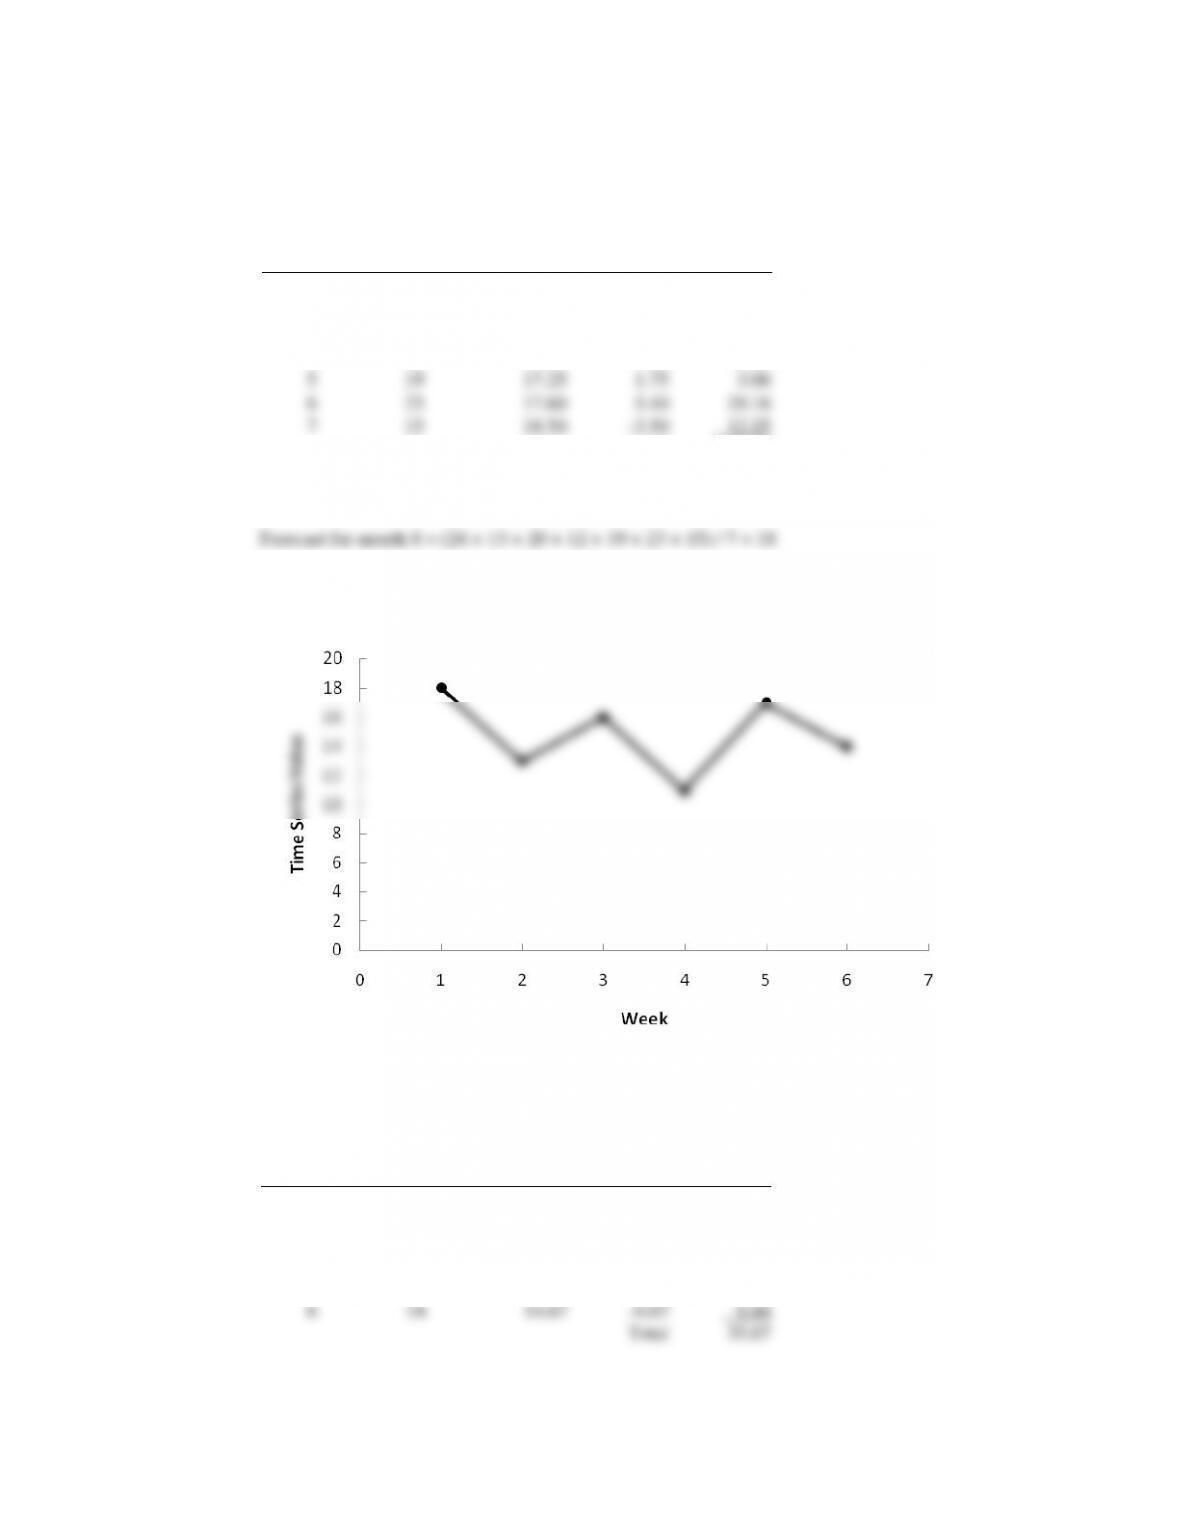
5. a.
The data appear to follow a horizontal pattern.
b. Three-week moving average.
Week
Time Series
Value
Forecast
Forecast
Error
Squared
Forecast
Error
1
18
2
13
3
16
4
11
15.67
-4.67
21.78
5
17
13.33
3.67
13.44
6
14
14.67
-0.67
0.44
Total
35.67
MSE = 35.67/3 = 11.89.

The forecast for week 7 = (11 + 17 + 14) / 3 = 14
c. Smoothing constant = .2
Week
Time Series
Value
Forecast
Forecast
Error
Squared
Forecast
Error
1
18
2
13
18.00
-5.00
25.00
3
16
17.00
-1.00
1.00
4
11
16.80
-5.80
33.64
5
17
15.64
1.36
1.85
6
14
15.91
-1.91
3.66
Total
65.15
MSE = 65.15/5 = 13.03
The forecast for week 7 is .2(14) + (1 – .2)15.91 = 15.53
d. The three-week moving average provides a better forecast since it has a smaller MSE.
e. Smoothing constant = .4
Week
Time Series
Value
Forecast
Forecast
Error
Squared
Forecast
Error
1
18
2
13
18.00
-5.00
25.00
3
16
16.00
0.00
0.00
4
11
16.00
-5.00
25.00
5
17
14.00
3.00
9.00
6
14
15.20
-1.20
1.44
Total
60.44
MSE = 60.44/5 = 12.09
The exponential smoothing forecast using α = .4 provides a better forecast than the exponential
smoothing forecast using α = .2 since it has a smaller MSE.
6. a.
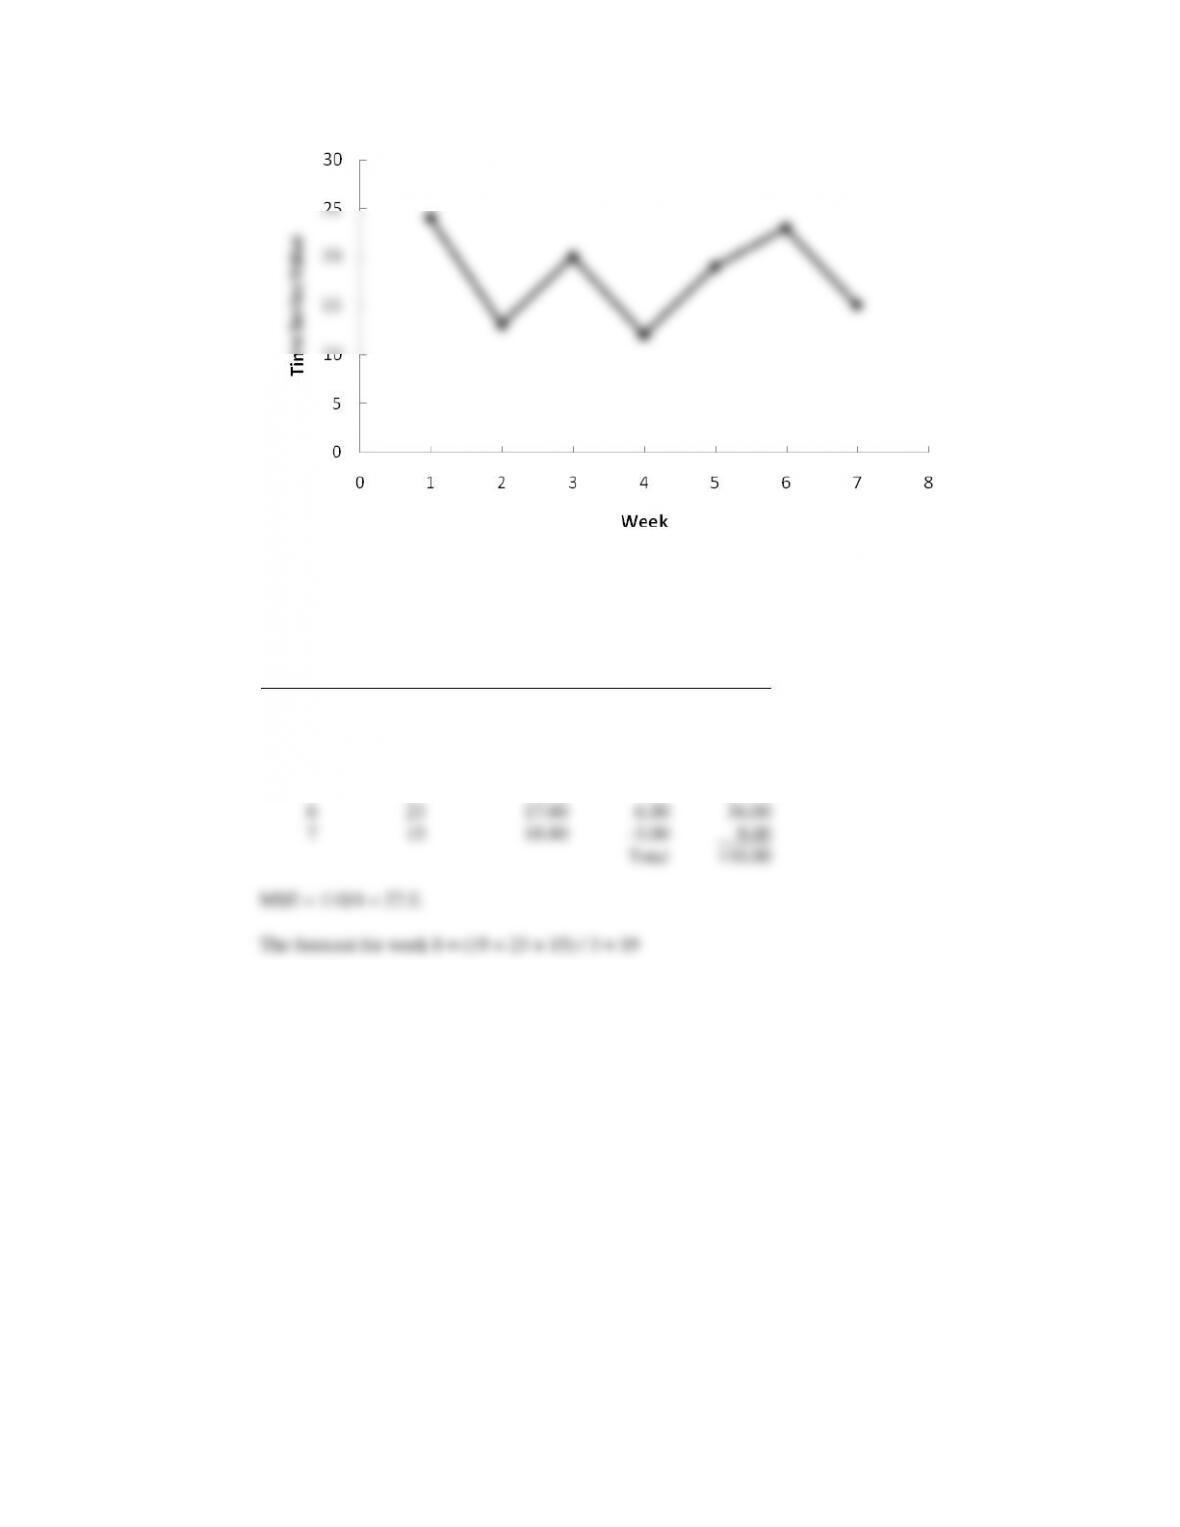
The data appear to follow a horizontal pattern.
Three-week moving average.
Week
Time Series
Value
Forecast
Forecast
Error
Squared
Forecast
Error
1
24
2
13
3
20
4
12
19.00
-7.00
49.00
5
19
15.00
4.00
16.00
6
23
17.00
6.00
36.00
7
15
18.00
-3.00
9.00
Total
110.00
MSE = 110/4 = 27.5.
The forecast for week 8 = (19 + 23 + 15) / 3 = 19

b. Smoothing constant = .2
Week
Time Series
Value
Forecast
Forecast
Error
Squared
Forecast
Error
1
24
2
13
24.00
-11.00
121.00
3
20
21.80
-1.80
3.24
4
12
21.44
-9.44
89.11
5
19
19.55
-0.55
0.30
6
23
19.44
3.56
12.66
7
15
20.15
-5.15
26.56
Total
252.87
MSE = 252.87/6 = 42.15
The forecast for week 8 is .2(15) + (1 – .2)20.15 = 19.12
Week
Time Series
Value
Forecast
Forecast
Error
Squared
Value of
Forecast
Error
1
24
2
13
24.00
-11.00
121.00
3
20
19.60
0.40
0.16
4
12
19.76
-7.76
60.22
5
19
16.66
2.34
5.49
6
23
17.59
5.41
29.23
7
15
19.76
-4.76
22.62
Total
238.72
The exponential smoothing forecast using α = .4 provides a better forecast than the exponential
smoothing forecast using α = .2 since it has a smaller MSE.
7. a.
Week
Time-Series
Value
4-Week
Moving
Average
Forecast
(Error)2
5-Week
Moving
Average
Forecast
(Error)2
1
17
2
21
3
19
4
23
5
18
20.00
4.00
6
16
20.25
18.06
19.60
12.96
7
20
19.00
1.00
19.40
0.36
8
18
19.25
1.56
19.20
1.44
9
22
18.00
16.00
19.00
9.00
10
20
19.00
1.00
18.80
1.44
11
15
20.00
25.00
19.20
17.64
12
22
18.75
10.56
19.00
9.00
Totals
77.18
51.84
b. MSE(4-Week) = 77.18 / 8 = 9.65
8. a.
Week
Time-Series
Value
Weighted Moving
Average Forecast
Forecast
Error
(Error)2
1
17
2
21
3
19
4
23
19.33
3.67
13.47
5
18
21.33
-3.33
11.09
6
16
19.83
-3.83
14.67
7
20
17.83
2.17
4.71
8
18
18.33
-0.33
0.11
9
22
18.33
3.67
13.47
10
20
20.33
-0.33
0.11
11
15
20.33
-5.33
28.41
12
22
17.83
4.17
17.39
Total
103.43
b. MSE = 103.43 / 9 = 11.49
Prefer the unweighted moving average here; it has a smaller MSE.
Week
Time Series
Value
Forecast
Forecast
Error
Absolute
Value of
Forecast
Error
Squared
Forecast
Error
Percentage
Error
Absolute Value
of Percentage
Error
1
17
2
21
17.00
4.00
4.00
16.00
19.05
19.05
3
19
17.40
1.60
1.60
2.56
8.42
8.42
4
23
17.56
5.44
5.44
29.59
23.65
23.65
5
18
18.10
-0.10
0.10
0.01
-0.56
0.56
6
16
18.09
-2.09
2.09
4.37
-13.06
13.06
7
20
17.88
2.12
2.12
4.49
10.60
10.60
8
18
18.10
-0.10
0.10
0.01
-0.56
0.56
9
22
18.09
3.91
3.91
15.29
17.77
17.77
10
20
18.48
1.52
1.52
2.31
7.60
7.60
11
15
18.63
-3.63
3.63
13.18
-24.20
24.20
12
22
18.27
3.73
3.73
13.91
16.95
16.95
Totals
28.24
101.72
65.67
142.42

Week
Time Series
Value
Forecast
Forecast
Error
Absolute
Value of
Forecast
Error
Squared
Forecast
Error
Percentage
Error
Absolute Value
of Percentage
Error
1
17
2
21
17.00
4.00
4.00
16.00
19.05
19.05
3
19
17.80
1.20
1.20
1.44
6.32
6.32
4
23
18.04
4.96
4.96
24.60
21.57
21.57
5
18
19.03
-1.03
1.03
1.06
-5.72
5.72
6
16
18.83
-2.83
2.83
8.01
-17.69
17.69
7
20
18.26
1.74
1.74
3.03
8.70
8.70
8
18
18.61
-0.61
0.61
0.37
-3.39
3.39
9
22
18.49
3.51
3.51
12.32
15.95
15.95
10
20
19.19
0.81
0.81
0.66
4.05
4.05
11
15
19.35
-4.35
4.35
18.92
-29.00
29.00
12
22
18.48
3.52
3.52
12.39
16.00
16.00
Totals
28.56
98.80
35.84
147.44
a. MSE for
= .1 = 101.72/11 = 9.25
MSE for
= .2 = 98.80/11 = 8.98
= .2 provides more accurate forecasts based upon MSE
b. MAE for
= .1 = 28.24/11 = 2.57
MAE for
= .2 = 28.56/11 = 2.60
= .1 provides more accurate forecasts based upon MAE; but, they are very close.
c. MAPE for
= .1 = 142.42/11 = 12.95%
MAPE for
= .2 = 147.44/11 = 13.40%
= .1 provides more accurate forecasts based upon MAPE
10. a. F13 = .2Y12 + .16Y11 + .64(.2Y10 + .8F10) = .2Y12 + .16Y11 + .128Y10 + .512F10
F13 = .2Y12 + .16Y11 + .128Y10 + .512(.2Y9 + .8F9) = .2Y12 + .16Y11 + .128Y10 + .1024Y9 + .4096F9
F13 = .2Y12 + .16Y11 + .128Y10 + .1024Y9 + .4096(.2Y8 + .8F8) = .2Y12 + .16Y11 + .128Y10 + .1024Y9 +
.08192Y8 + .32768F8
b. The more recent data receives the greater weight or importance in determining the forecast. The moving
averages method weights the last n data values equally in determining the forecast.
11. a.
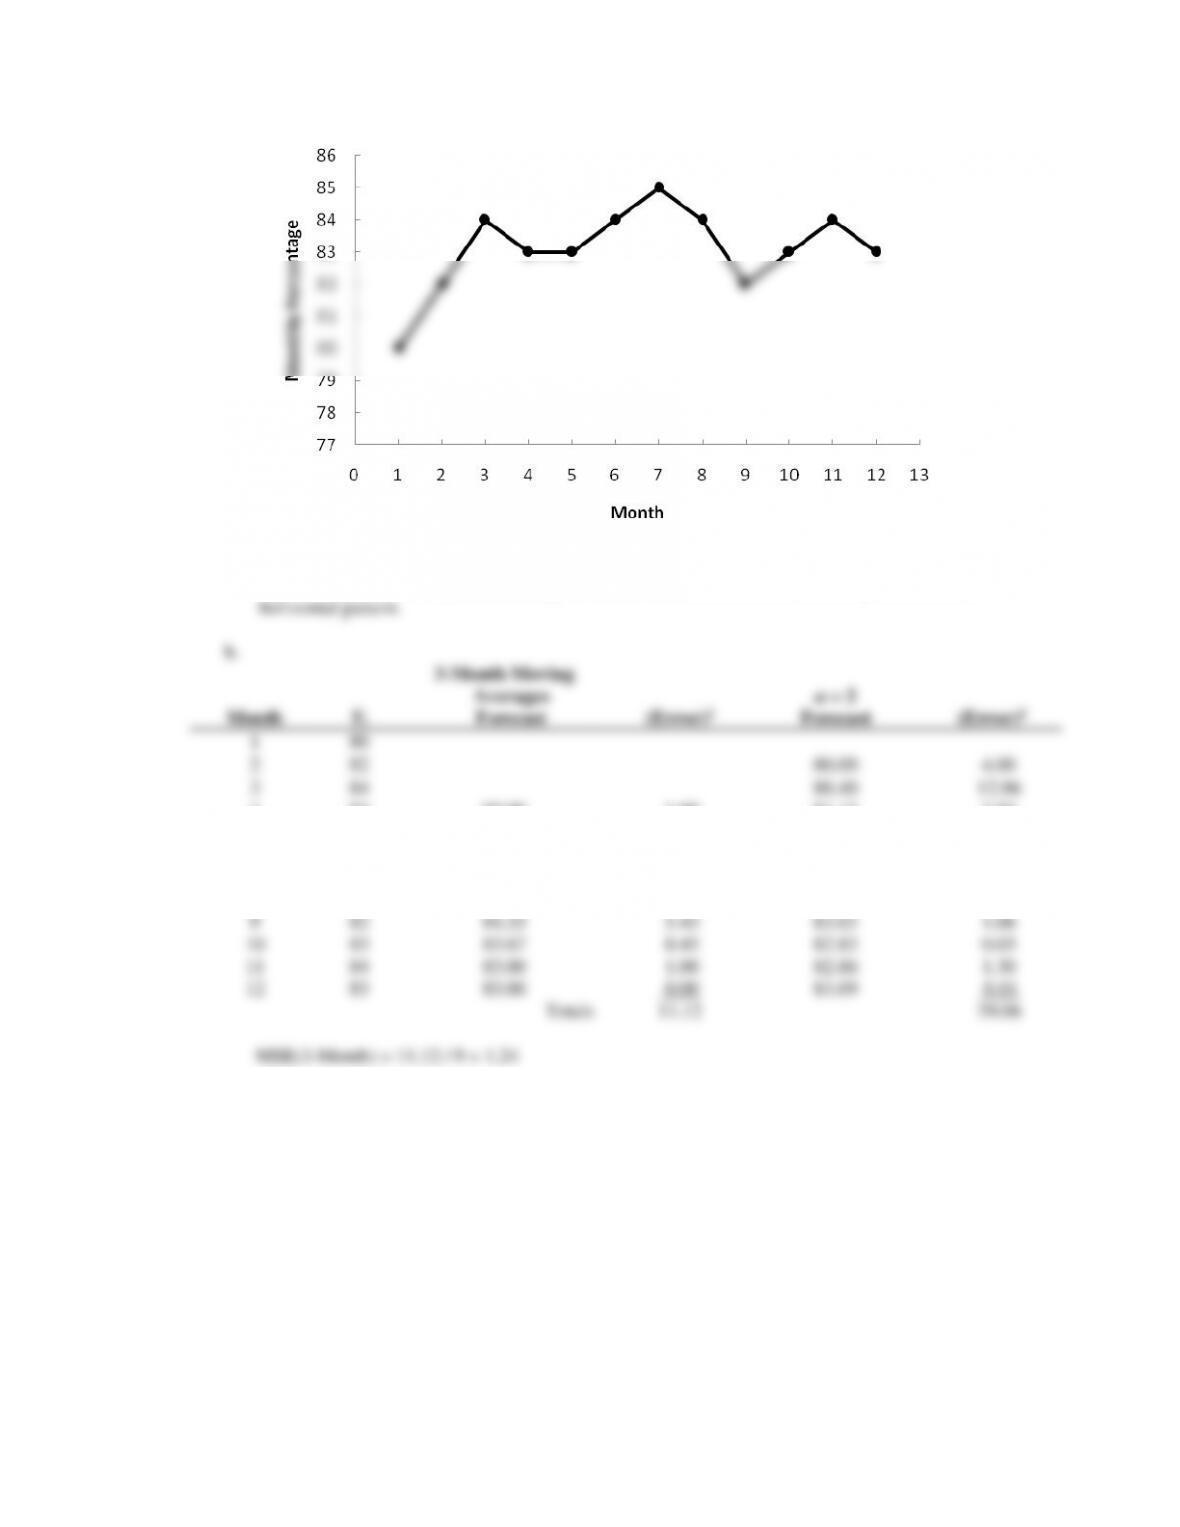
The first two time series values may be an indication that the time series has shifted to a new
higher level, as shown by the remainig 10 values. But, overall, the time series plot exhibits a
Month
Time-Series
Value
3-Month Moving
Average Forecast
(Error)2
4-Month Moving
Average Forecast
(Error)2
1
9.5
2
9.3
3
9.4
4
9.6
9.40
0.04
5
9.8
9.43
0.14
9.45
0.12
6
9.7
9.60
0.01
9.53
0.03
7
9.8
9.70
0.01
9.63
0.03
8
10.5
9.77
0.53
9.73
0.59
9
9.9
10.00
0.01
9.95
0.00
10
9.7
10.07
0.14
9.98
0.08
11
9.6
10.03
0.18
9.97
0.14
12
9.6
9.73
0.02
9.92
0.10
Totals
1.08
1.09
MSE(3-Month) = 1.08 / 9 = .12
MSE(4-Month) = 1.09 / 8 = .14
Use 3-Month moving averages.
c. Forecast = (9.7 + 9.6 + 9.6) / 3 = 9.63
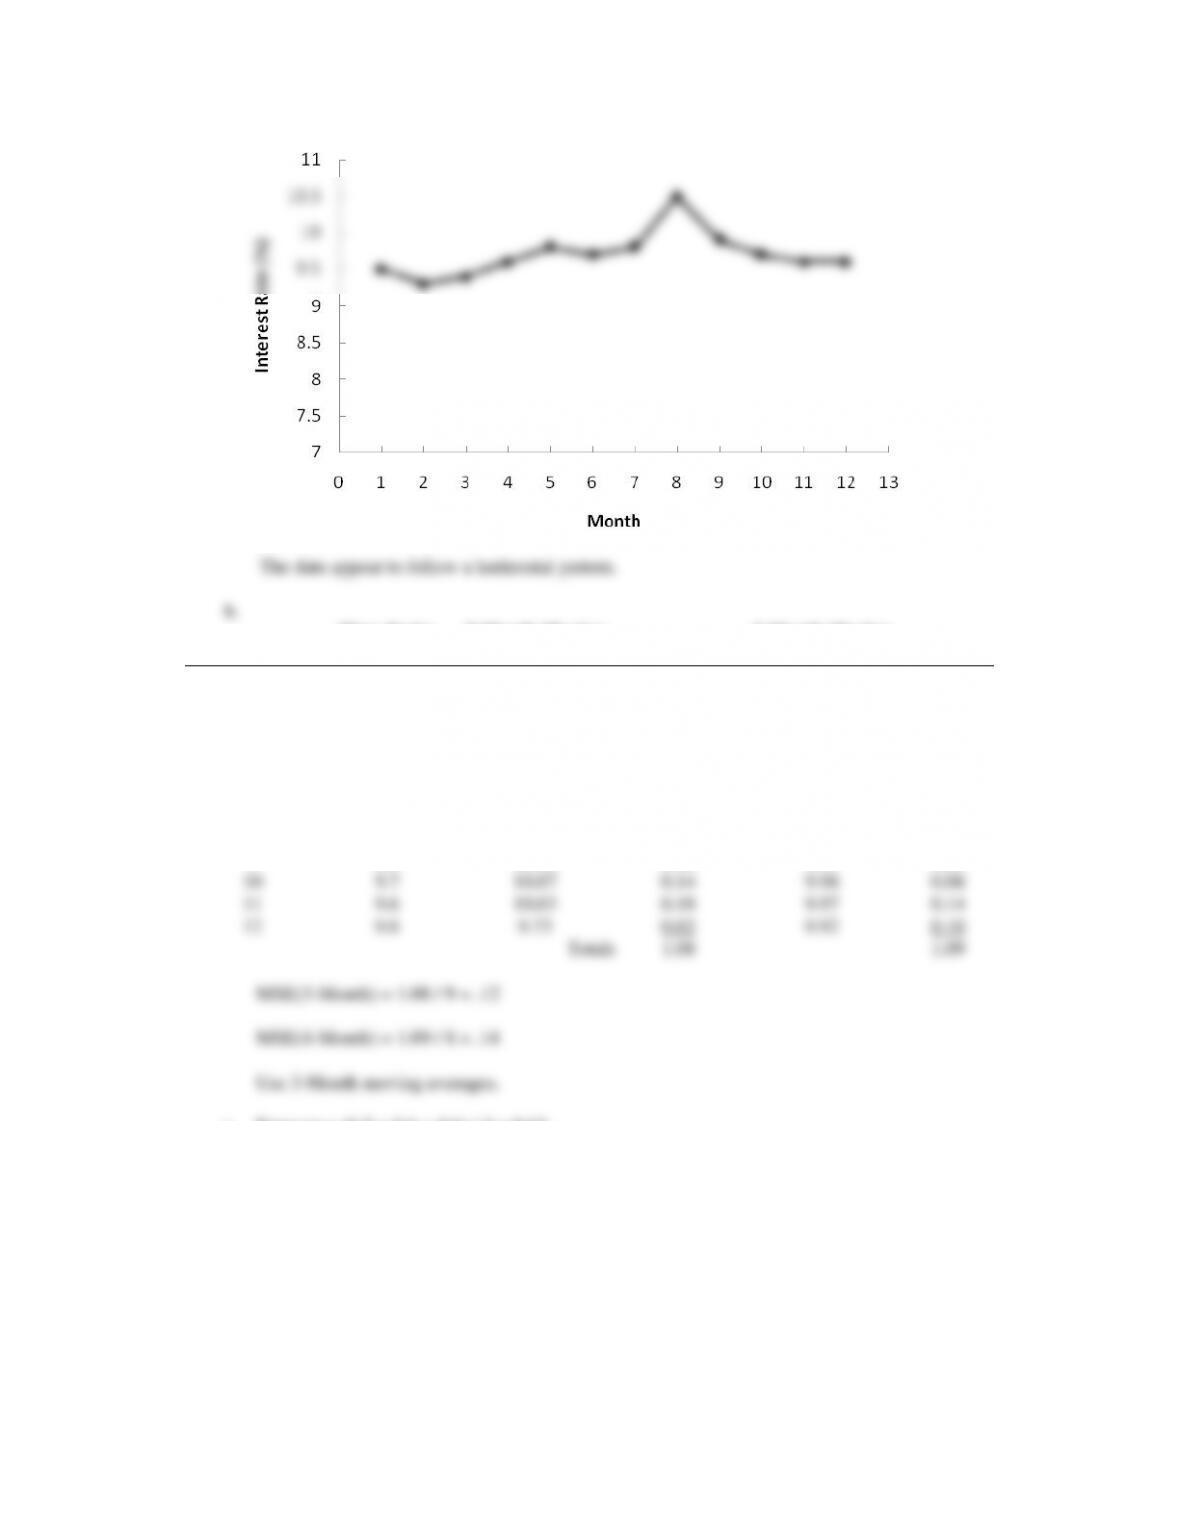
13. a.
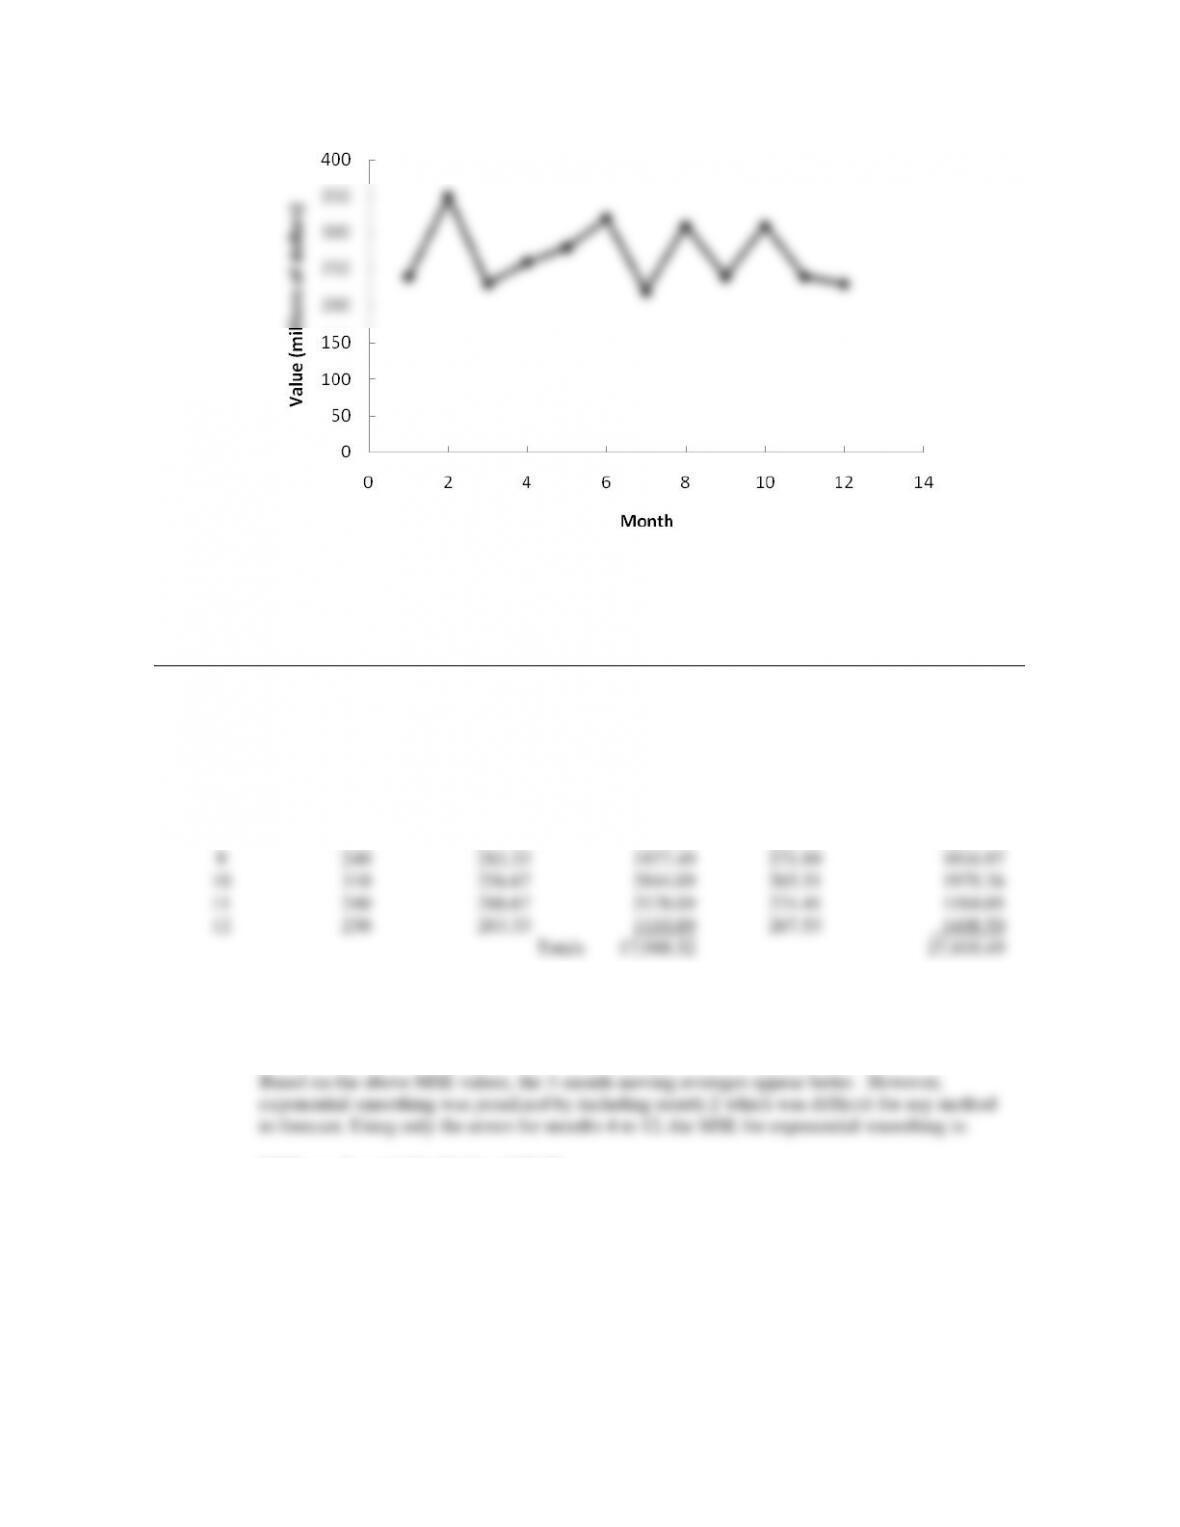
The data appear to follow a horizontal pattern.
b.
Month
Time-Series
Value
3-Month Moving
Average Forecast
(Error)2
α = .2
Forecast
(Error)2
1
240
2
350
240.00
12100.00
3
230
262.00
1024.00
4
260
273.33
177.69
255.60
19.36
5
280
280.00
0.00
256.48
553.19
6
320
256.67
4010.69
261.18
3459.79
7
220
286.67
4444.89
272.95
2803.70
8
310
273.33
1344.69
262.36
2269.57
9
240
283.33
1877.49
271.89
1016.97
10
310
256.67
2844.09
265.51
1979.36
11
240
286.67
2178.09
274.41
1184.05
12
230
263.33
1110.89
267.53
1408.50
Totals
17,988.52
27,818.49
MSE(3-Month) = 17,988.52 / 9 = 1998.72
MSE(α = .2) = 27,818.49 / 11 = 2528.95
MSE(α = .2) = 14,694.49 / 9 = 1632.72
Thus, exponential smoothing was better considering months 4 to 12.
c. Using exponential smoothing,
F13 = α Y12 + (1 – α)F12 = .20(230) + .80(267.53) = 260