29. a. Range = 60 – 28 = 32
b.
x= =
435
94833.
2
( ) 742
i
xx − =
2
2()
742 92.75
i
xx
−
c. The average air quality is about the same. But, the variability is greater in Anaheim.
30. Dawson Supply: Range = 11 – 9 = 2
4.1 0.67
9
31. a.
18–34
35–44
45+
mean
1368.0
1330.1
1070.4
median
1423.0
1382.5
1163.5
standard deviation
540.8
431.7
334.5
b. The 45+ group appears to spend less on coffee than the other two groups, and the 18–34 and 35–44
groups spend similar amounts of coffee.
32. a. Automotive :
39201 1960.05
20
i
x
xn
= = =
Department store:
13857 692.85
20
i
x
xn
= = =
2
()4,407,720.95 481.65
i
xx
−
Department Store: 1011 – 448 = 563
d. Order the data for each variable from the lowest to highest.
Automotive
Department Store
1
598
448
2
1512
472
3
1573
474
4
1642
573
5
1714
589
6
1720
597
7
1781
598
8
1798
622
9
1813
629
10
2008
669
11
2014
706
12
2024
714
13
2058
746
14
2166
760
15
2202
782
16
2254
824
17
2366
840
18
2526
856
19
2531
947
20
2901
1011
25
( 1) (21) 5.25
100 100
p
in= + = =
Automotive: First quartile or 25th percentile = 1714 + .25(1720 – 1714) = 1715.5
Department Store: First quartile or 25th percentile = 589 + .25(597 – 589) = 591
75
( 1) (21) 15.75
100 100
p
in= + = =
Automotive: Third quartile or 75th percentile = 2202 + .75(2254 – 2202) = 2241
Department Store: First quartile or 75th percentile = 782 + .75(824 – 782) = 813.5
e. Automotive spends more on average, has a larger standard deviation, larger max and min, and larger
range than Department Store. Autos have all new model years and may spend more heavily on
advertising.
33. a. For 2011
608 76
8
i
x
xn
= = =
2
()30 2.07
17
i
xx
sn
−
= = =
−
golf scores ranging from 71 to 85. The increase in variation might be explained by the golfer trying
to change or modify the golf swing. In general, a loss of consistency and an increase in the standard
deviation could be viewed as a poorer performance in 2012. The optimism in 2012 is that three of
the eight scores were better than any score reported for 2011. If the golfer can work for consistency,
s = 0.0564
Coefficient of Variation = (s/
x
)100% = (0.0564/0.966)100% = 5.8%
Milers
s = 0.1295
Coefficient of Variation = (s/
x
)100% = (0.1295/4.534)100% = 2.9%
n
515
sx x
n
i
22
1
64
44=−
−= =
( )
10
10 15 1.25
4
z−
= = −
4
4
20 15 1.25
4
650 500 1.50
100
z−
= = +
500 500 0.00
100
z−
==
450 500 .50
100
z−
= = −
b.
15 30 45 30
3, 3
55
zz
−−
= = − = =
2
1
1 .89
3
−=
At least 89%
c.
22 30 38 30
1.6, 1.6
55
zz
−−
= = − = =
2
1
1 .61
1.6
−=
At least 61%
d.
18 30 42 30
2.4, 2.4
55
zz
−−
= = − = =
2
1
1 .83
2.4
−=
At least 83%
1
1 1 1
d.
13000 3100 8.25
1200
x
z
−−
= = =
Mode = 10.7
b. Range = 11.8 – 8.3 = 3.5
2
2( ) 8.085 .8983
19
i
xx
sn
−
= = =
−
.8983 .9478s==
d. The national standard of six minutes is not being met for this neighborhood. The city should
consider making changes in its response strategy including relocating stations to reduce the travel
time.
44. a.
765 76.5
10
i
x
xn
= = =
1 10 1
−−
b.
84 76.5 1.07
7
xx
zs
−−
= = =
Approximately one standard deviation above the mean. Approximately 68% of the scores are within
one standard deviation. Thus, half of (100–68), or 16%, of the games should have a winning score of
84 or more points.
zs
= = =
90 76.5 1.93
7
xx
−−
10
2
()559.6 7.89
1 10 1
i
xx
−
−−
Largest margin 24:
24 12.2 1.50
7.89
xx
zs
−−
= = =
. No outliers.
15
50
50
( 1) (15 1) 8
100 100
p
Ln= + = + =
Median is the value in position 8 or 55.
b.
25
25
( 1) (15 1) 4
100 100
p
Ln= + = + =
100 100
Third quartile or 75th percentile is the value in position 12 or 60.
c. The range is 69 – 36 = 33 and the interquartile range is 60 – 44 = 16.
2
2( ) 1402 100.1429
1 14
i
xx
−
−
100.1429 10.0071s==
e. The z-score values do not indicate any outliers.
f. The sample mean of 52% indicates that Wal-Mart does appear to be meeting its goal of reducing the
number of hourly employees by about 50%.
46. 15, 20, 25, 25, 27, 28, 30, 34
50
50
( 1) (8 1) 4.5
100 100
p
Ln= + = + =
Second quartile or median = 25 + .5(27 25) = 26
75
75
( 1) (8 1) 6.75
100 100
p
Ln= + = + =
48. 5, 6, 8, 10, 10, 12, 15, 16, 18
Smallest = 5
25
25
( 1) (9 1) 2.5
100 100
p
Ln= + = + =
First quartile or 25th percentile = 6 + . 5(8 6) = 7
50
50
( 1) (9 1) 5.0
100 100
p
Ln= + = + =
Second quartile or median = 10
75
75
( 1) (9 1) 7.5
100 100
p
Ln= + = + =
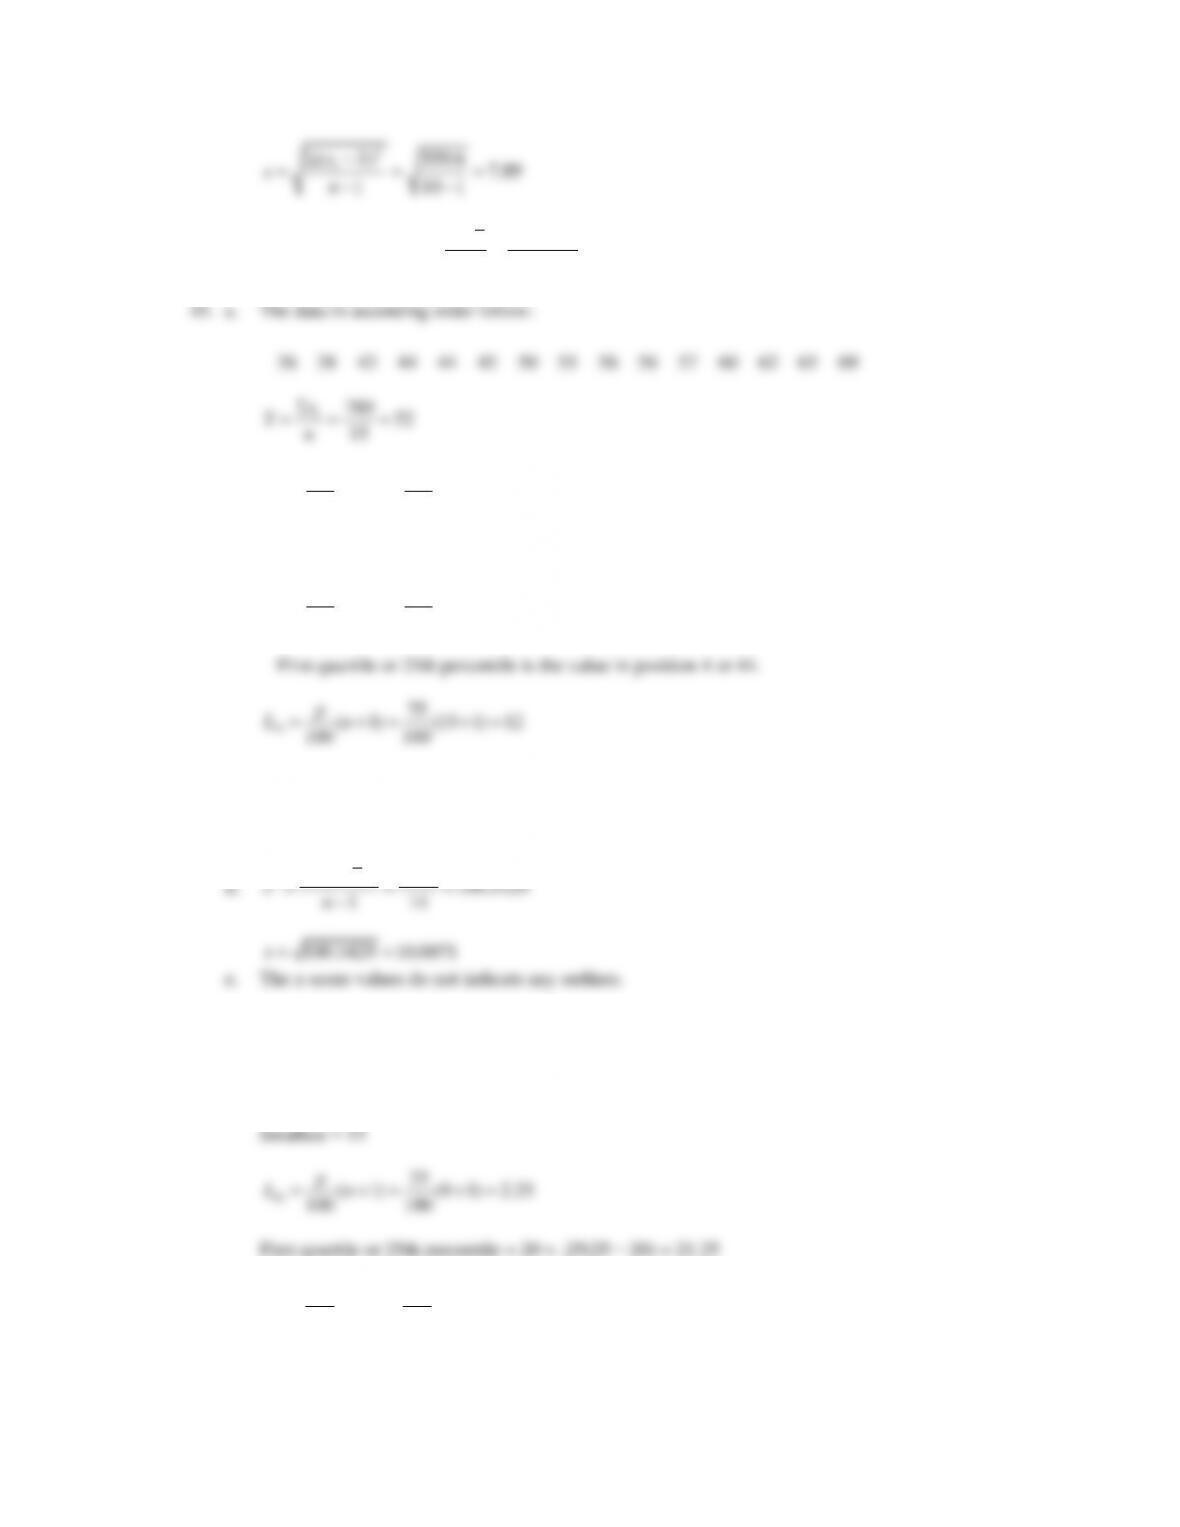
0 5 10 15 20 25 30 35 40
0 5 10 15 20
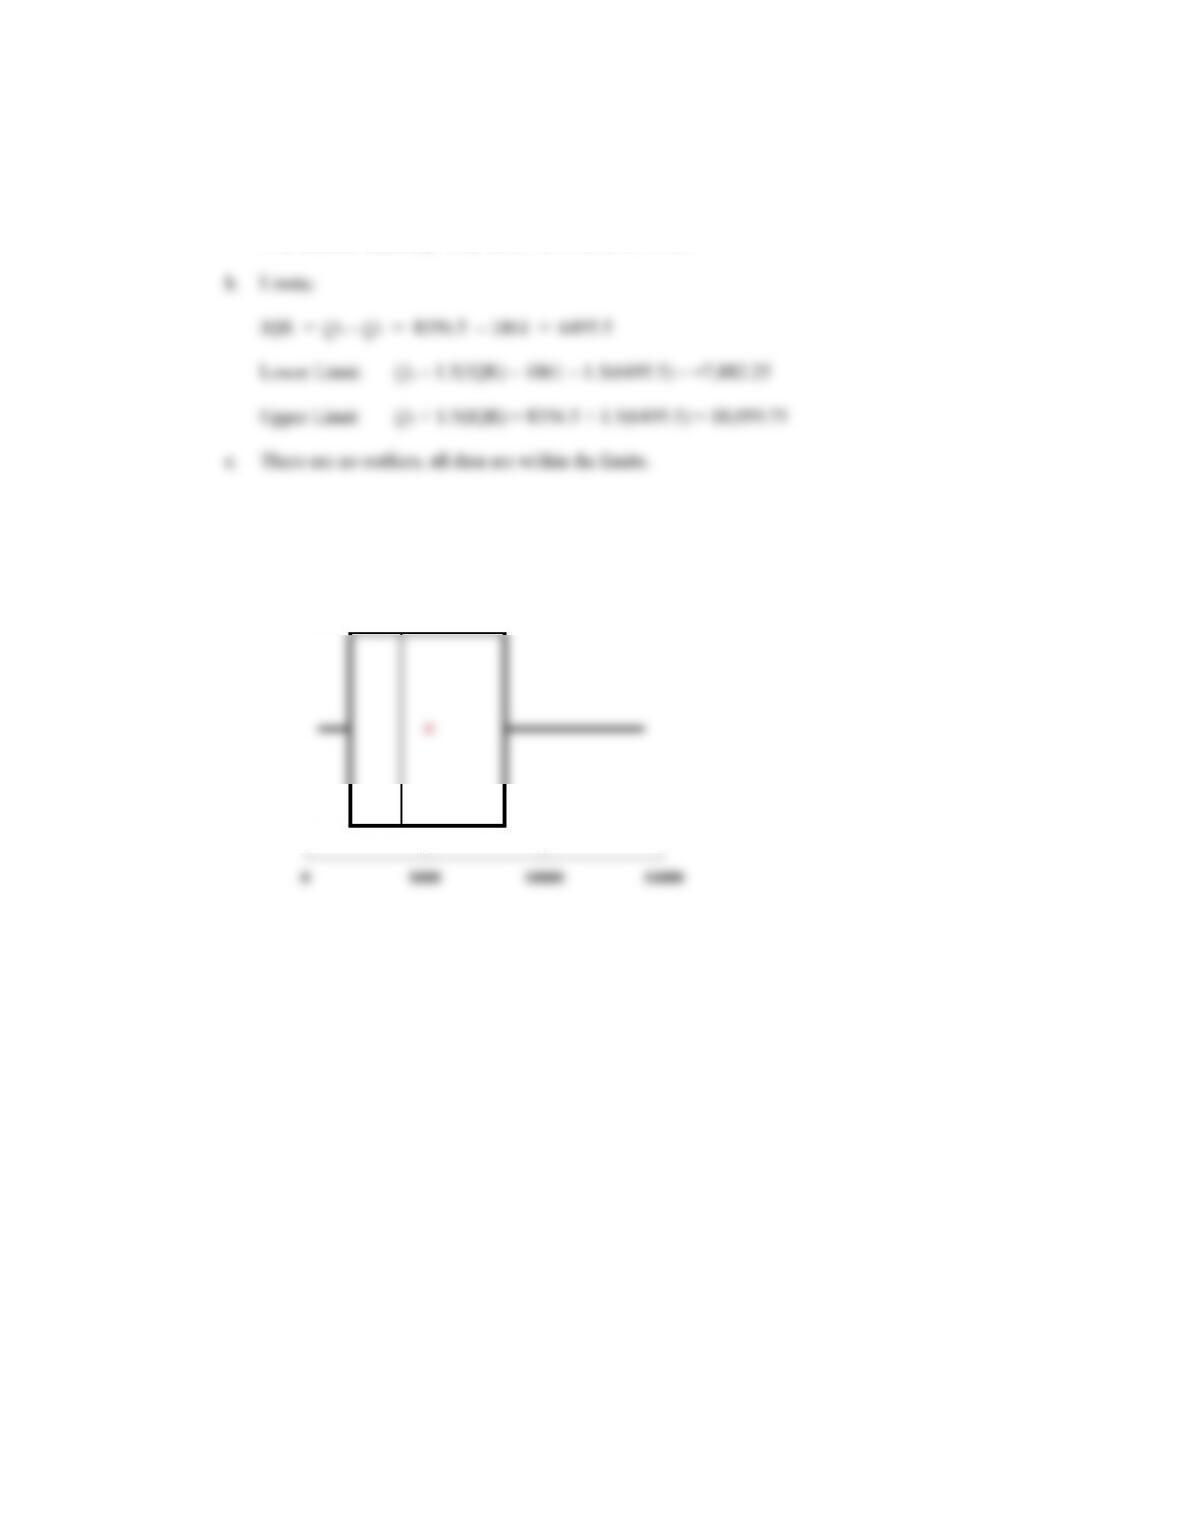
49. IQR = 50 – 42 = 8
Lower Limit: Q1 – 1.5 IQR = 42 – 12 = 30
Upper Limit: Q3 + 1.5 IQR = 50 + 12 = 62
65 is an outlier
50. a. The first place runner in the men’s group finished
109.03 65.30 43.73−=
minutes ahead of the first
place runner in the women’s group. Lauren Wald would have finished in 11th place for the
combined groups.
Men
Women
109.64
131.67
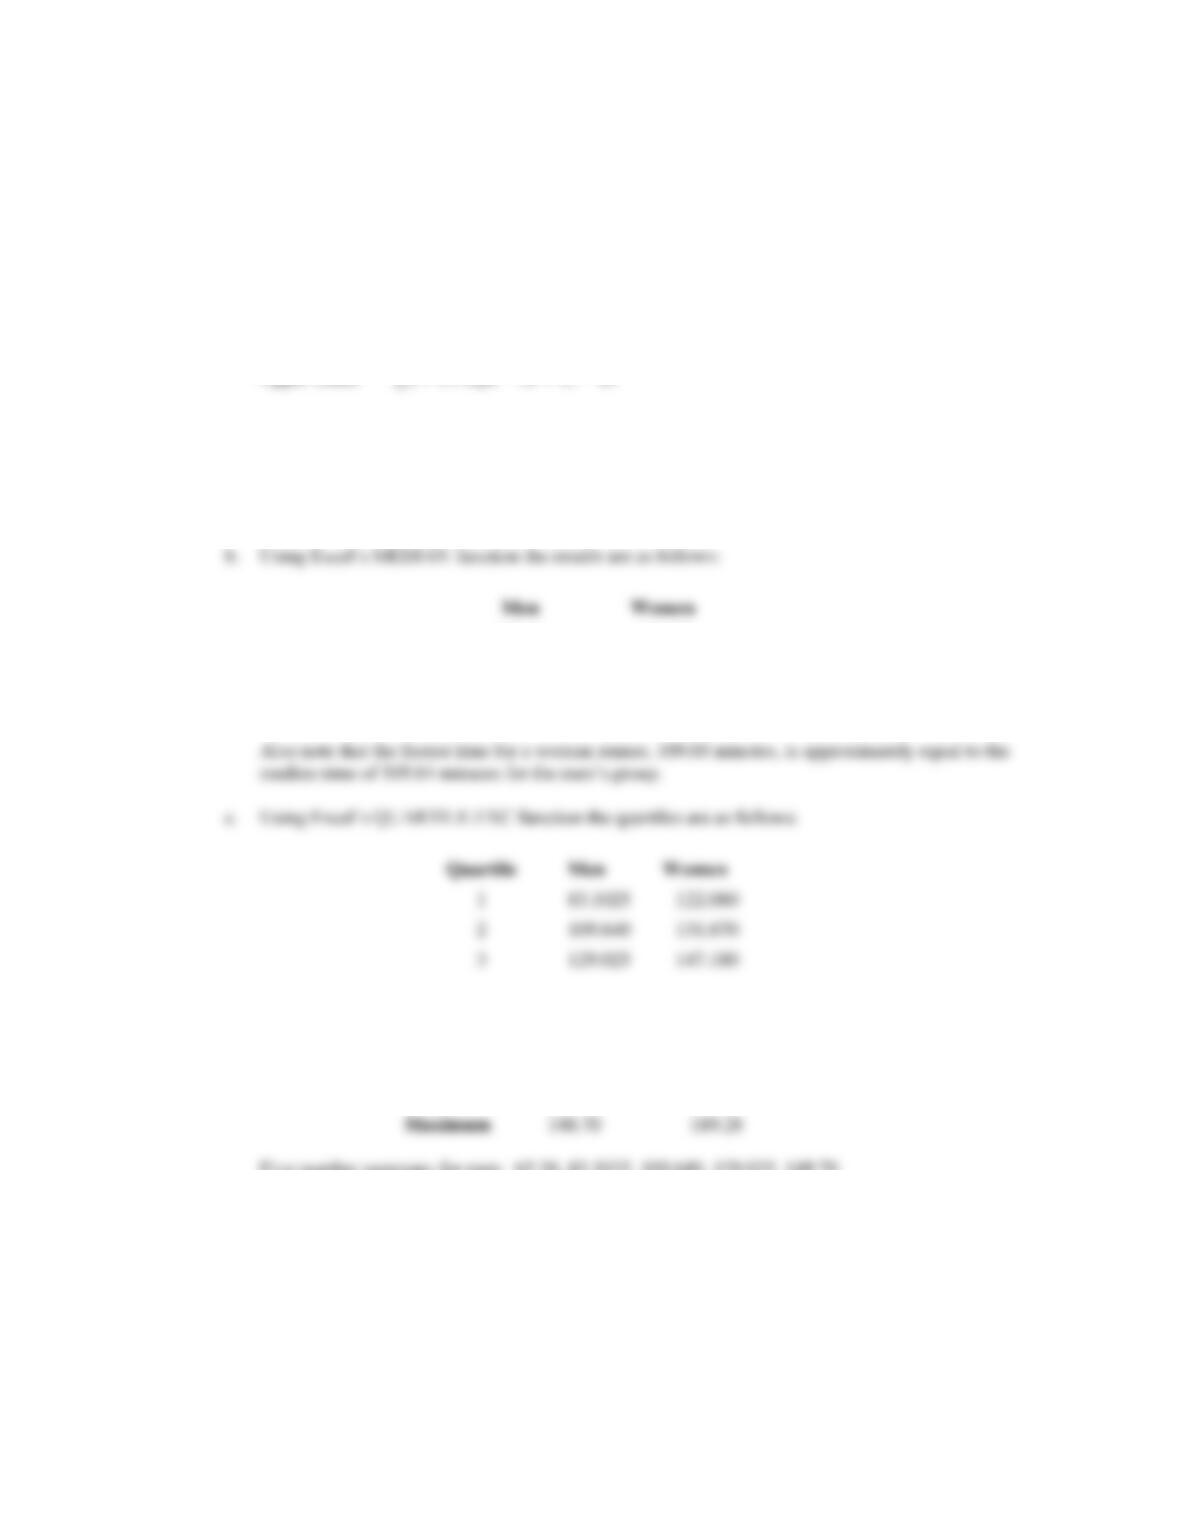
Using the median finish times, the men’s group finished
131.67 109.64 22.03−=
minutes ahead of
the women’s group.
1
2
3
Men
Women
109.03
148.70
189.28
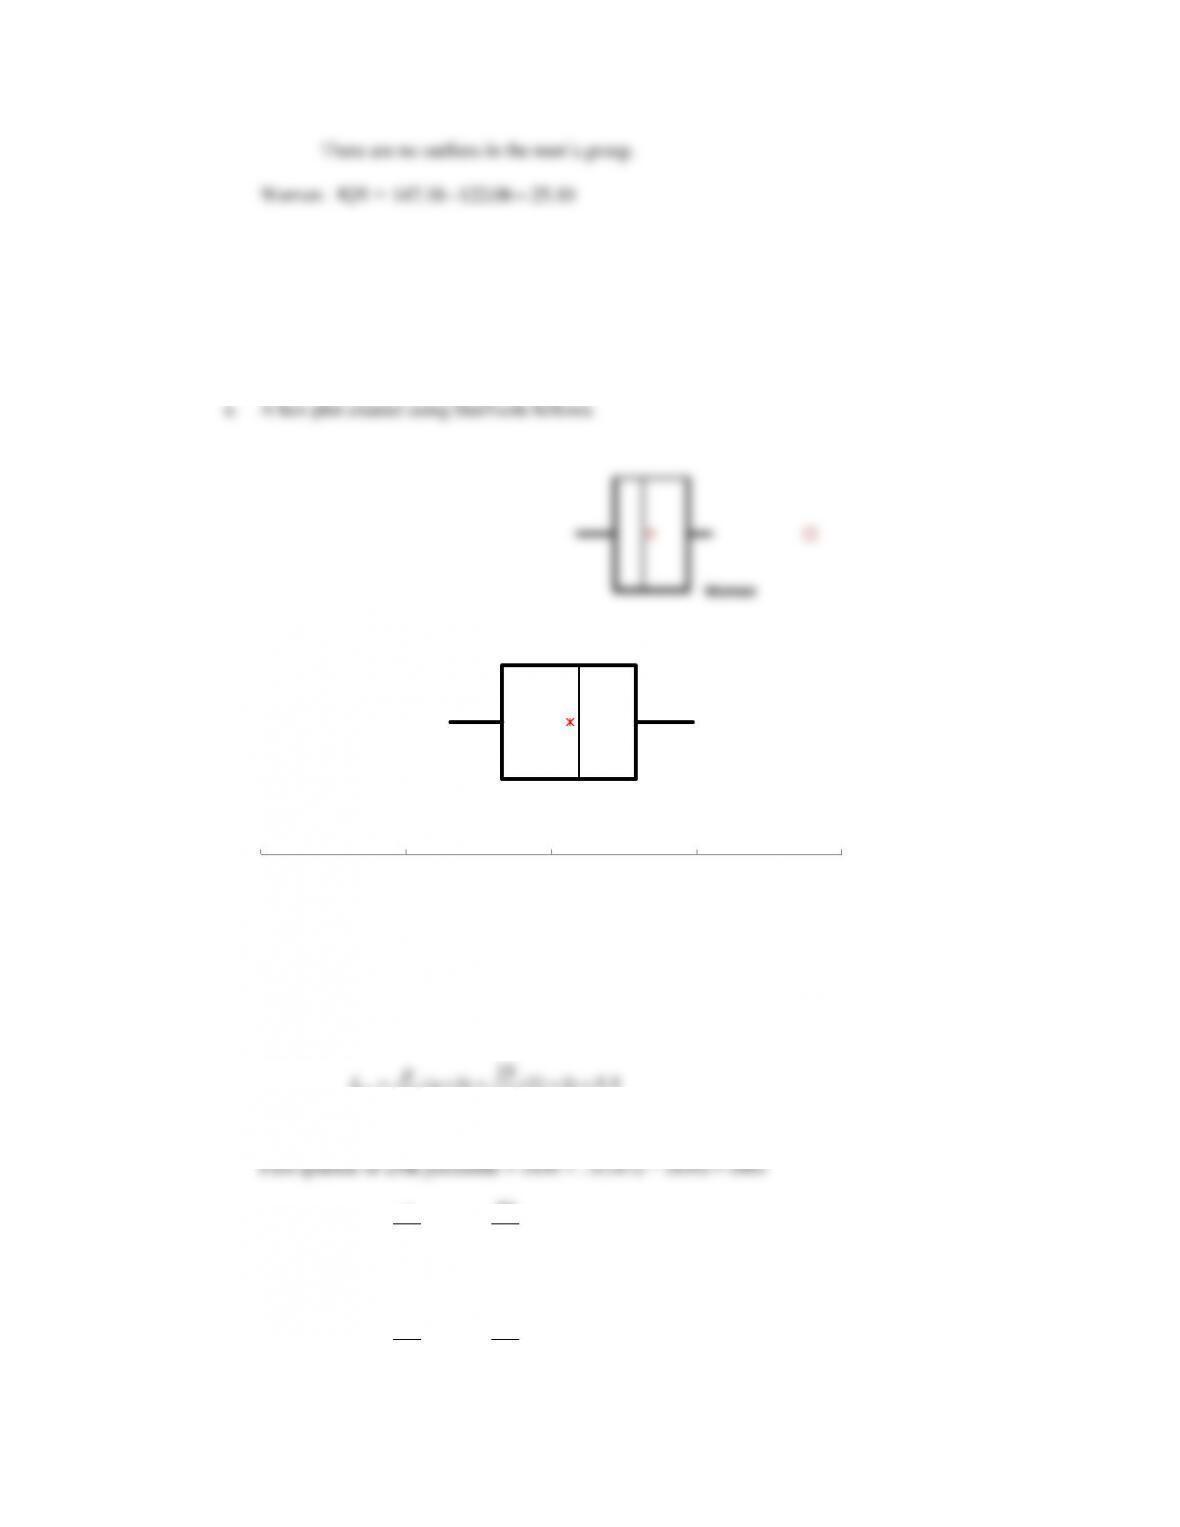
Lower Limit =
11.5(IQR)Q−
=
122.08 1.5(25.10) 84.43= − =
Upper Limit =
31.5(IQR)Q+
147.18 1.5(25.10) 184.83= + =
The two slowest women runners with times of 189.27 and 189.28 minutes are outliers in the
women’s group.
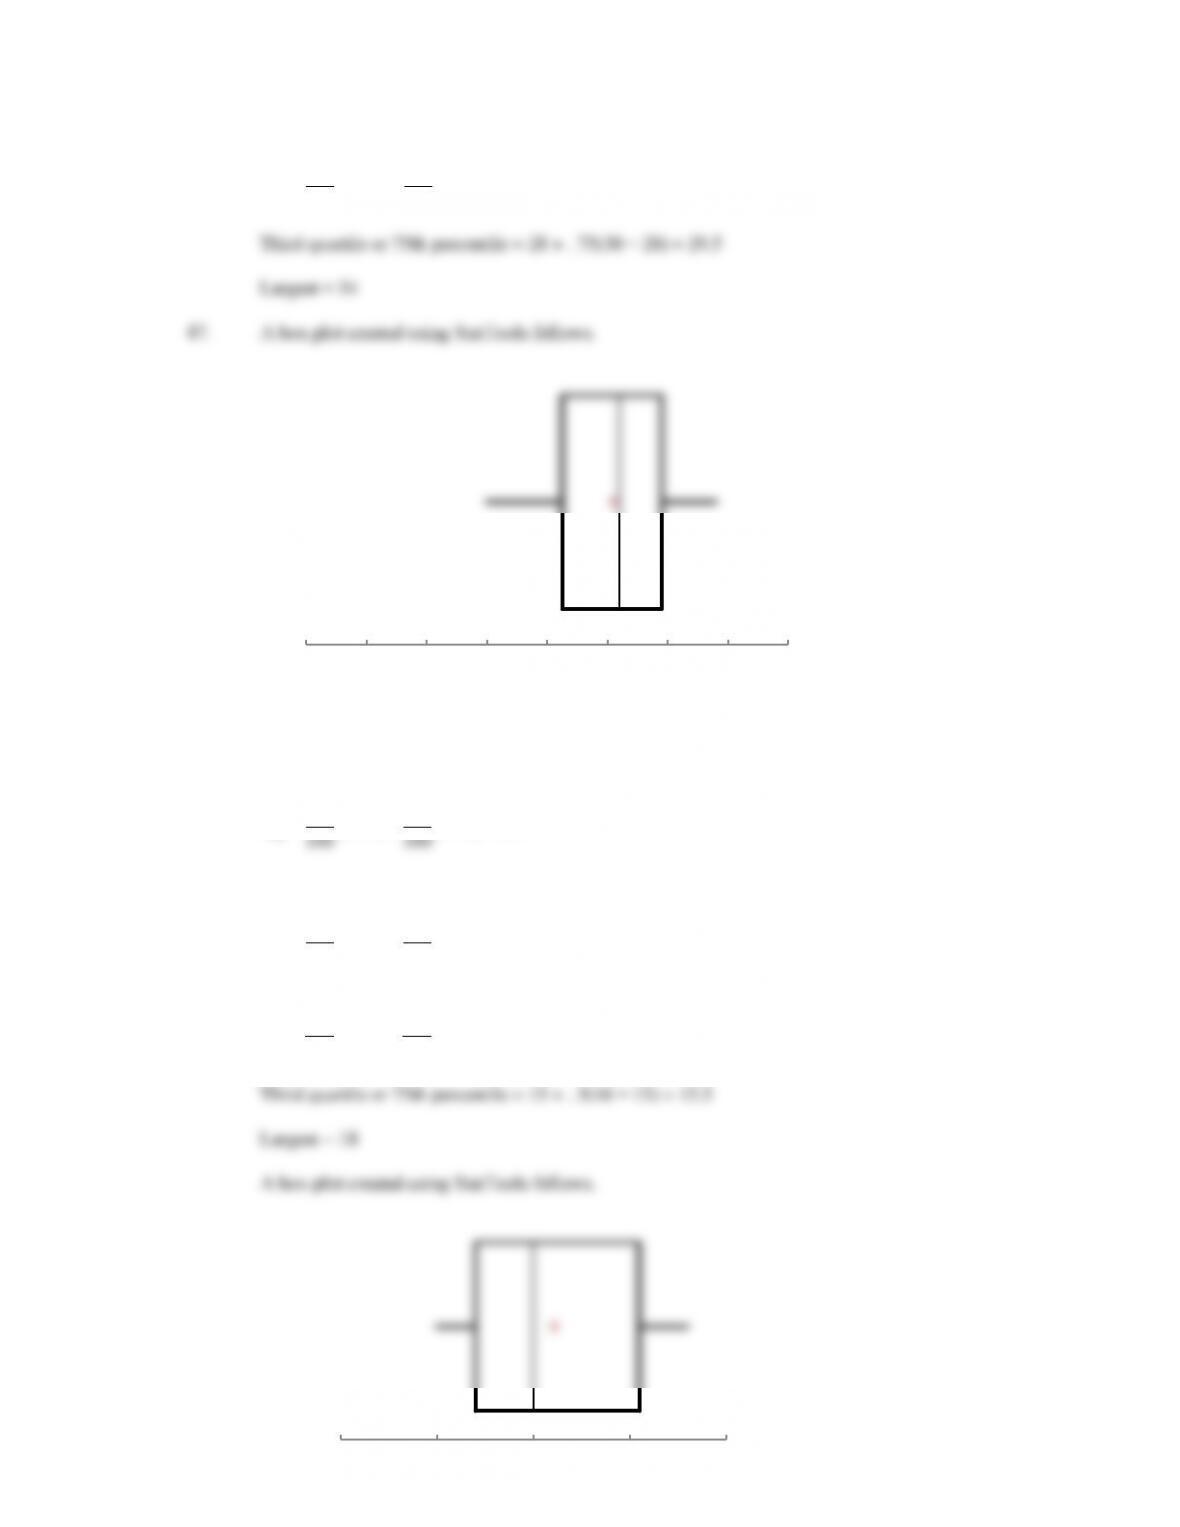
The box plots show the men runners with the faster or lower finish times. However, the box plots
show the women runners with the lower variation in finish times. The interquartile ranges of
45.9225 minutes for men and 25.10 minutes for women support this conclusion.
51. a. Smallest = 608
25
25
( 1) (21 1) 5.5
100 100
p
Ln= + = + =
50
( 1) (21 1) 11.0
50
100 100
p
Second quartile or median = 4019
75
75
( 1) (21 1) 16.5
100 100
p
Ln= + = + =
Men
Women
050 100 150 200
Third quartile or 75th percentile = 8305 + . 5(8408 8305) = 8356.5
Largest = 14138
Five-number summary: 608, 1861, 4019, 8365.5, 14138
d. Yes, if the first two digits in Johnson and Johnson’s sales were transposed to 41,138, sales would
have shown up as an outlier. A review of the data would have enabled the correction of the data.
e. A box plot created using StatTools follows.