Chapter 1
Data and Statistics
Learning Objectives
1. Obtain an appreciation for the breadth of statistical applications in business and economics.
2. Understand the meaning of the terms elements, variables, and observations as they are used in
statistics.
3. Obtain an understanding of the difference between categorical, quantitative, crossectional and time
series data.
4. Learn about the sources of data for statistical analysis both internal and external to the firm.
5. Be aware of how errors can arise in data.
6. Know the meaning of descriptive statistics and statistical inference.
7. Be able to distinguish between a population and a sample.
8. Understand the role a sample plays in making statistical inferences about the population.
9. Know the meaning of the term data mining.
10. Be aware of ethical guidelines for statistical practice.
Solutions:
1. Statistics can be referred to as numerical facts. In a broader sense, statistics is the field of study
dealing with the collection, analysis, presentation and interpretation of data.
2. a. The ten elements are the ten tablet computers
3. a. Average cost = 5829/10 = $582.90
b. Average cost with a Windows operating system = 3616/5 = $723.20
4. a. There are eight elements in this data set; each element corresponds to one of the eight models of
cordless telephones
b. Categorical variables: Voice Quality and Handset on Base
5. a. Average Price = 545/8 = $68.13
6. a. Categorical
b. Quantitative
7. a. Each question has a yes or no categorical response.
8. a. 762
b. Categorical
9. a. Categorical
10. a. Categorical
b. Percentages
11. a. Quantitative; ratio
b. Categorical; nominal
12. a. The population is all visitors coming to the state of Hawaii.
b. Since airline flights carry the vast majority of visitors to the state, the use of questionnaires for
passengers during incoming flights is a good way to reach this population. The questionnaire
13. a. Federal spending measured in trillions of dollars
b. Quantitative
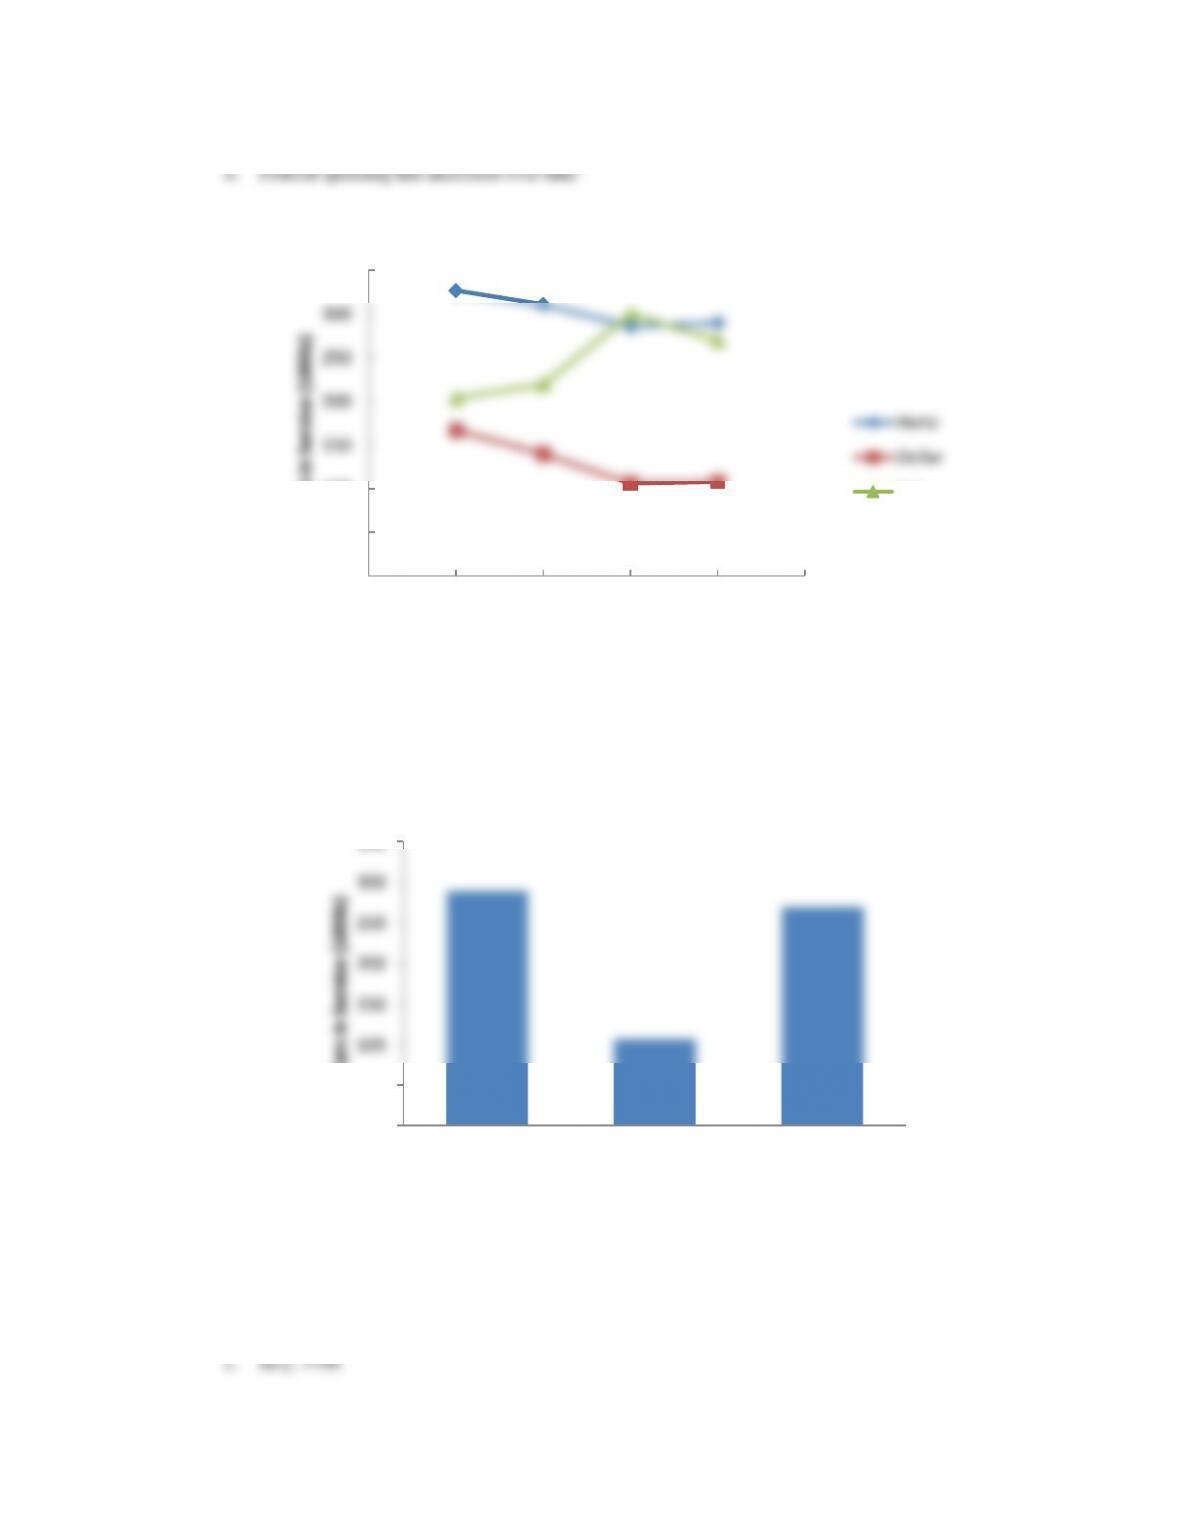
14. a. The graph of the time series follows:
b. In 2007 and 2008 Hertz was the clear market share leader. In 2009 and 2010 Hertz and Avis have
approximately the same market share. The market share for Dollar appears to be declining.
c. The bar chart for 2010 is shown below.
This chart is based on cross-sectional data.
15. a. Quantitative – number of new drugs approved
0
50
100
150
200
250
300
350
2006 2007 2008 2009 2010 2011
Cars in Service (1000s)
Year
Hertz
Dollar
Avis
0
50
100
150
200
250
300
350
Hertz Dollar Avis
Cars in Service (1000s)
Company
16. The answer to this exercise depends on updating the time series of the average price per gallon of
17. Internal data on salaries of other employees can be obtained from the personnel department.
External data might be obtained from the Department of Labor or industry associations.
19. a. All subscribers of Business Week in North America at the time the survey was conducted.
b. Quantitative
c. Categorical (yes or no)
20. a. 43% of managers were bullish or very bullish.
21% of managers expected health care to be the leading industry over the next 12 months.
21. a. The two populations are the population of women whose mothers took the drug DES during
pregnancy and the population of women whose mothers did not take the drug DES during
pregnancy.
b. It was a survey.
22. a. The population consists of all clients that currently have a home listed for sale with the agency or
have hired the agency to help them locate a new home.
b. Some of the ways that could be used to collect the data are as follows:
23. a. This finding is applicable to the population of all American adults.
b. This finding is applicable to the population of American adults that own a cellphone and/or a tablet
computer.
24. a. This is a statistically correct descriptive statistic for the sample.
b. An incorrect generalization since the data was not collected for the entire population.
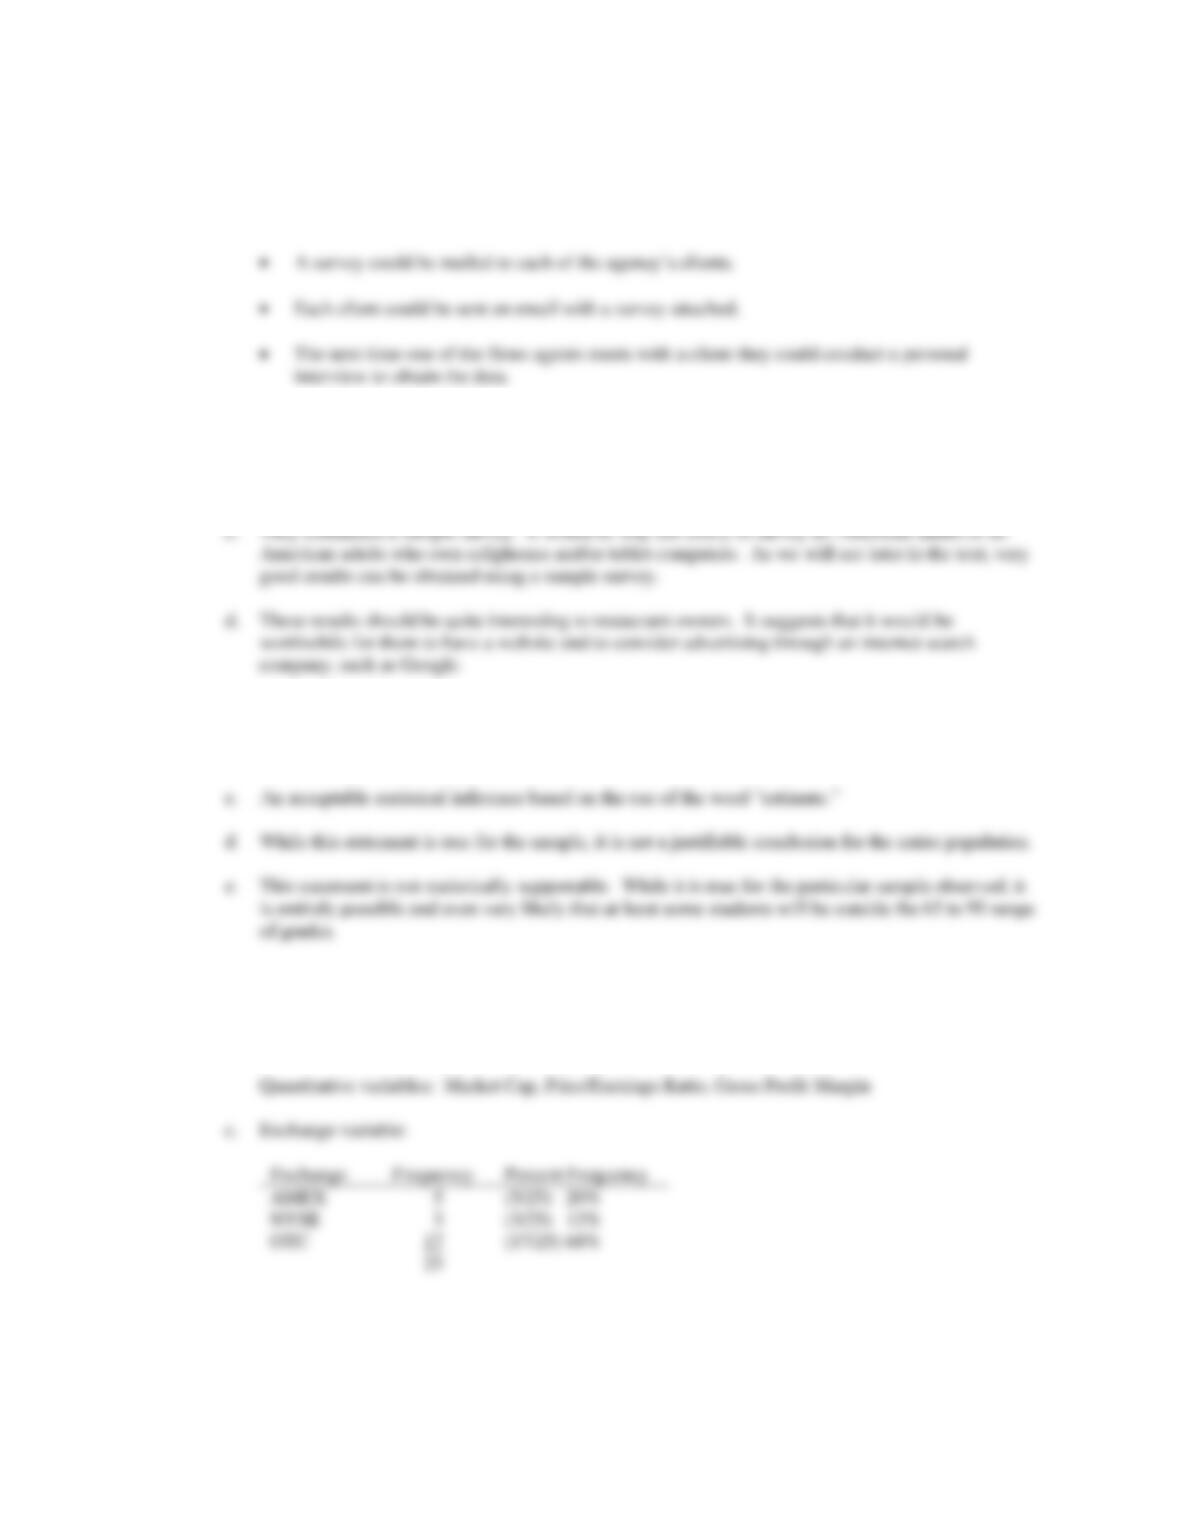
25. a. There are five variables: Exchange, Ticker Symbol, Market Cap, Price/Earnings Ratio and Gross
Profit Margin.
b. Categorical variables: Exchange and Ticker Symbol
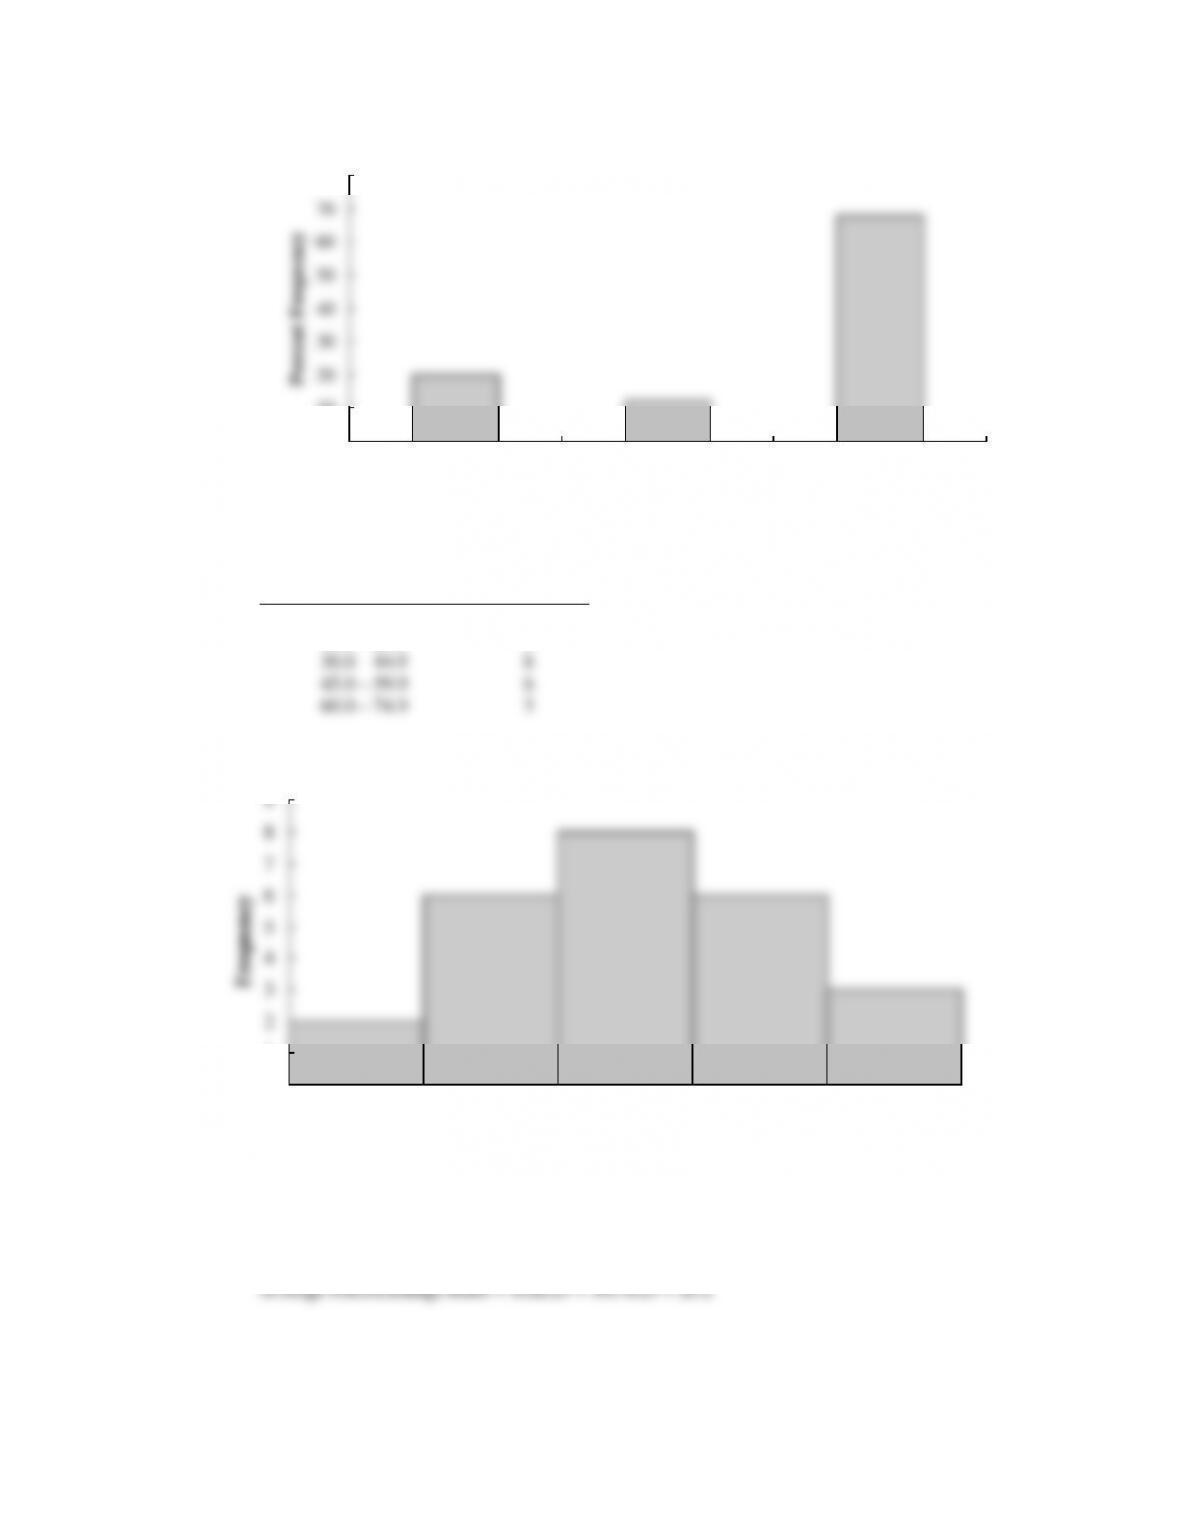
d. Gross Profit Margin variable:
Gross Profit Margin
Frequency
0.0 – 14.9
2
15.0 – 29.9
6
30.0 – 44.9
8
45.0 – 59.9
6
60.0 – 74.9
3
e. Sum the Price/Earnings Ratio data for all 25 companies.
Sum = 505.4
0
10
20
30
40
50
60
70
80
AMEX NYSE OTC
Exchange
Percent Frequency
0
1
2
3
4
5
6
7
8
9
0.0-14.9 15.0-29.9 30.0-44.9 45.0-59.9 60.0-74.9
Gross Profit Margin
Frequency