18. a. Let
m
1
= population mean minutes late for delayed AirTran flights
m
2
= population mean minutes late for delayed Southwest flights
H0:
12
0
−=
Ha:
1 22 0
−
b.
x1=xi
i=1
n
å
n1
=1265
25 =50.6
minutes
i=1
n
å

d
1 0
20. a. 3, -1, 3, 5, 3, 0, 1
b.
d d n
i
= = =/ /14 7 2
2
() 26 2.08
1 7 1
i
dd
−
−−
d.
d
= 2
e. With 6 degrees of freedom t.025 = 2.447
( )
2 2.447 2.082/ 7
2 1.93 (.07 to 3.93)
21. Difference = rating after – rating before
H0:
d 0
Ha:
d > 0
d
= .625 and
sd
= 1.30
.625 0 1.36
/ 1.30/ 8
d
d
d
tsn
−−
= = =
d
=ådi
n=85.25
25 =3.41
b.
sd=å(di–d)2
n–1=.428.26
25–1=4.22
With df = 24, t.025 = 2.064
.025 d
s
dt n
4.22
æ
With this as the sample mean price per share of stock at the beginning of 2012, the confidence
interval ($1.67 to $5.15) indicates the percentage change in the population mean price per share of
stock would have increased from
23. a.
1 = population mean grocery expenditures
2 = population mean dining-out expenditures
H0:
0
d
=
Ha:
0
d
b.
850 0 4.91
/ 1123/ 42
d
d
d
tsn
−−
= = =
s
H0:
m
d
≤ 0
Ha:
m
d
> 0
Differences 30, 63, -42, 10, 10, -27, 50, 60, 60, -30, 62, 30
Using t table, p–value is between .05 and .025
Exact p-value corresponding to t = 2.05 is .0325
Since p-value < .05, reject H0. We can conclude that there has been a significance increase in
business travel airfares over the one-year period.
b. Current year:
x= åxi/n=5844 /12 =$487
Previous year:
x=åxi/n=5568/12 =$464
H0:
m
d
= 0
Ha:
m
d
≠ 0
Use difference data: 66, 52, 65, –38, 28, -24, 50, 40, -5, 31, 55, –20

d=ådi
n=300
12 =25
sd=å(di–d)2
n–1=15,100
12 –1=37.05
t=d–
m
d
sd/n=25–0
37.05/ 12 = –2.34
d=25
xM=åxi
n=6168
12 =514
for the math test
xW=åxi
n=5868
12 =489
for the writing test
Differences: –2, -1, -5, 1, 1, 0, 4, -7, -6, 1, 0, 2, -3, -7, -2, 3, 1, 2, 1, -4
/ 21/ 20 1.05
i
d d n= = − = −
2
()
3.3162
1
i
d
dd
sn
−
==
−
Two-tail p-value must be between .10 and .20
Exact p-value corresponding to t = –1.42 is .1718

c. α = .05 df = 19 t = 1.729
Margin of error =
.025 d
s
tn
=
3.3162
1.729 1.28
20 =
Yes, just check to see if the 90% confidence interval includes a difference of zero. If it does, the
difference is not statistically significant.
H0:
d = 10
Ha:
d 10
d
= 8.86 and
sd
= 2.61
td
s n
d
d
=−=−= −
/
.
. / .
886 10
261 7116
df = n – 1 = 6
Using t table, area is between .10 and .20
.025 /
d
d t s n=
8.86 2.447(2.61)/ 7
8.86 2.41
or (6.45 to 11.27)
( )
2
1
SSTR k
jj
j
n x x
=
=−
= 6(156 – 144) 2 + 6(142 – 144) 2 + 6(134 – 144) 2 = 1,488
b. MSTR = SSTR /(k – 1) = 1488/2 = 744
c.
2
1
s
= 164.4
2
2
s
= 131.2
2
3
s
= 110.4
2
1
SSE ( 1)
k
jj
j
ns
=
=−
= 5(164.4) + 5(131.2) +5(110.4) = 2030
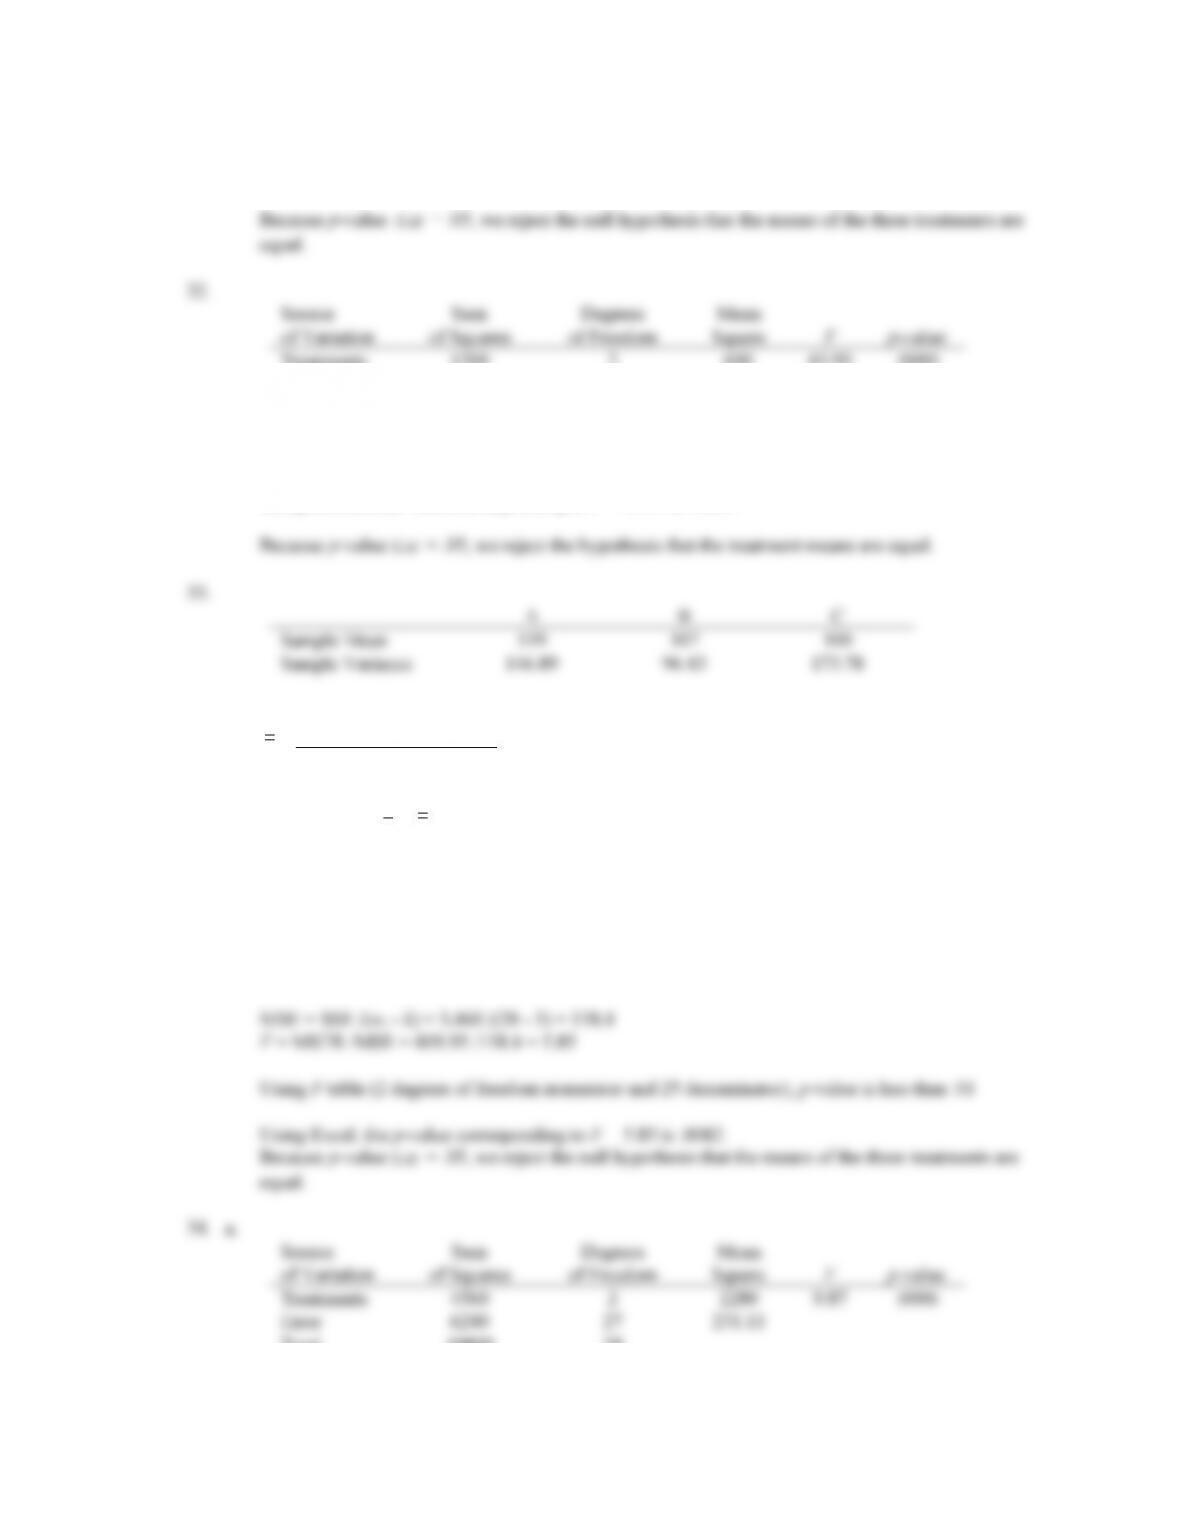
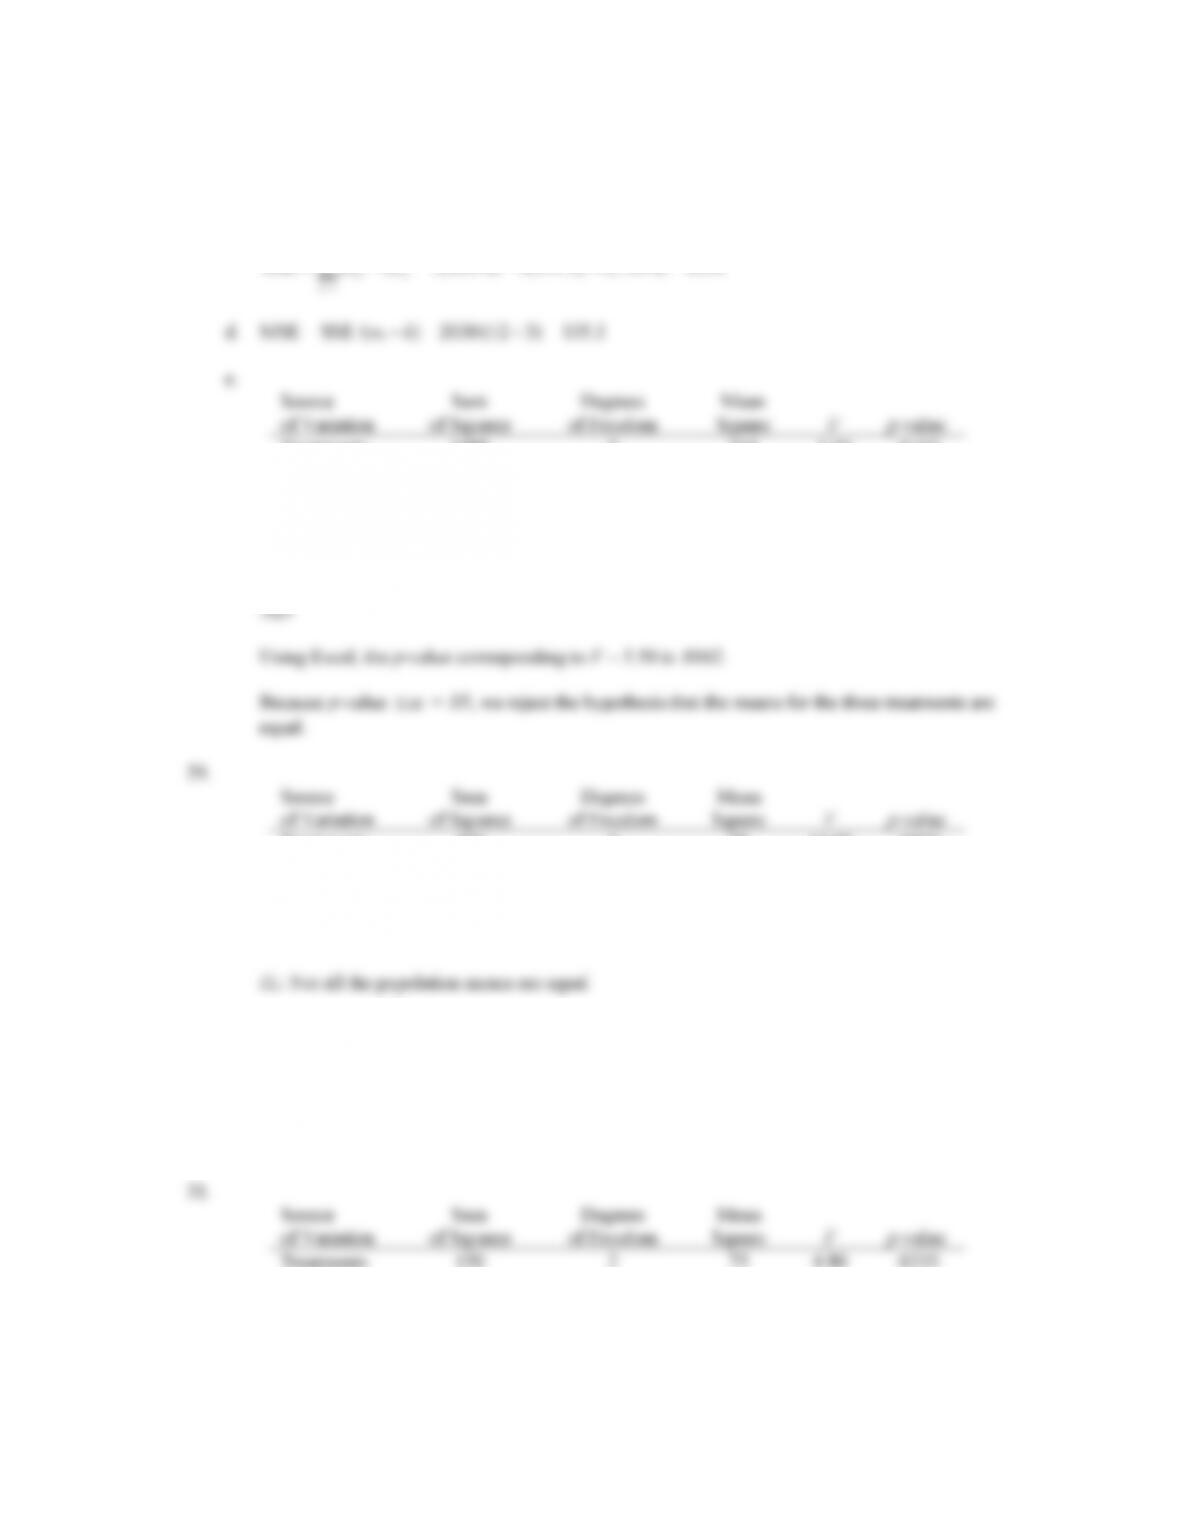
Using Excel, the p-value corresponding to F = 4.80 is .0233.
b. Using F table (2 degrees of freedom numerator and 27 denominator), p-value is less than .01
Using Excel, the p-value corresponding to F = 9.87 is .0006.
methods are equal.
35.
x
= (79 + 74 + 66)/3 = 73
1
j
=
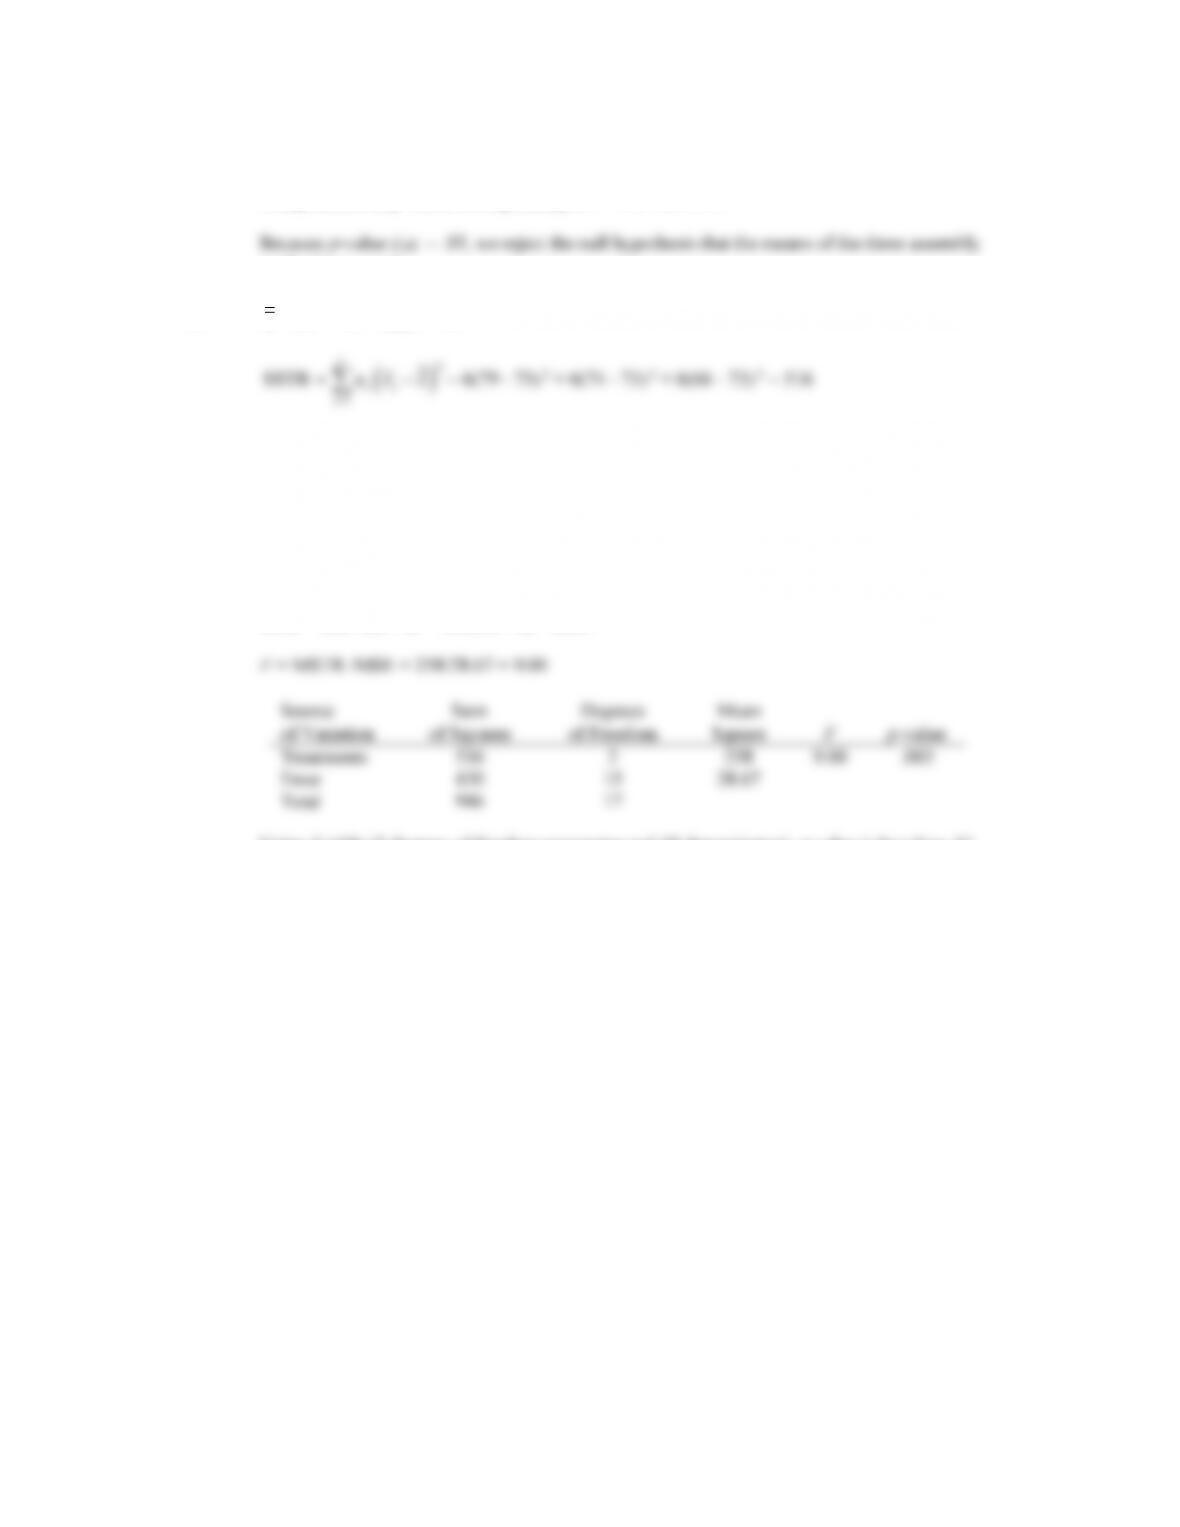
MSTR = SSTR /(k – 1) = 516/2 = 258
2
1
s
= 34
2
2
s
= 20
2
3
s
= 32
2
1
SSE ( 1)
k
jj
j
ns
=
=−
= 5(34) + 5(20) +5(32) = 430
MSE = SSE /(nT – k) = 430/(18 – 3) = 28.67
Using F table (2 degrees of freedom numerator and 15 denominator), p-value is less than .01
Using Excel the p-value corresponding to F = 9.00 is .003.
Because p-value
= .05, we reject the null hypothesis that the means for the three plants are
equal. In other words, analysis of variance supports the conclusion that the population mean
examination score at the three NCP plants are not equal.