Chapter 12 – Simple Linear Regression
Multiple Choice
1. The proportion of the variation in the dependent variable y that is explained by the estimated regression equation is
measured by the
a.
correlation coefficient
b.
standard error of the estimate
c.
coefficient of determination
d.
confidence interval estimate
c
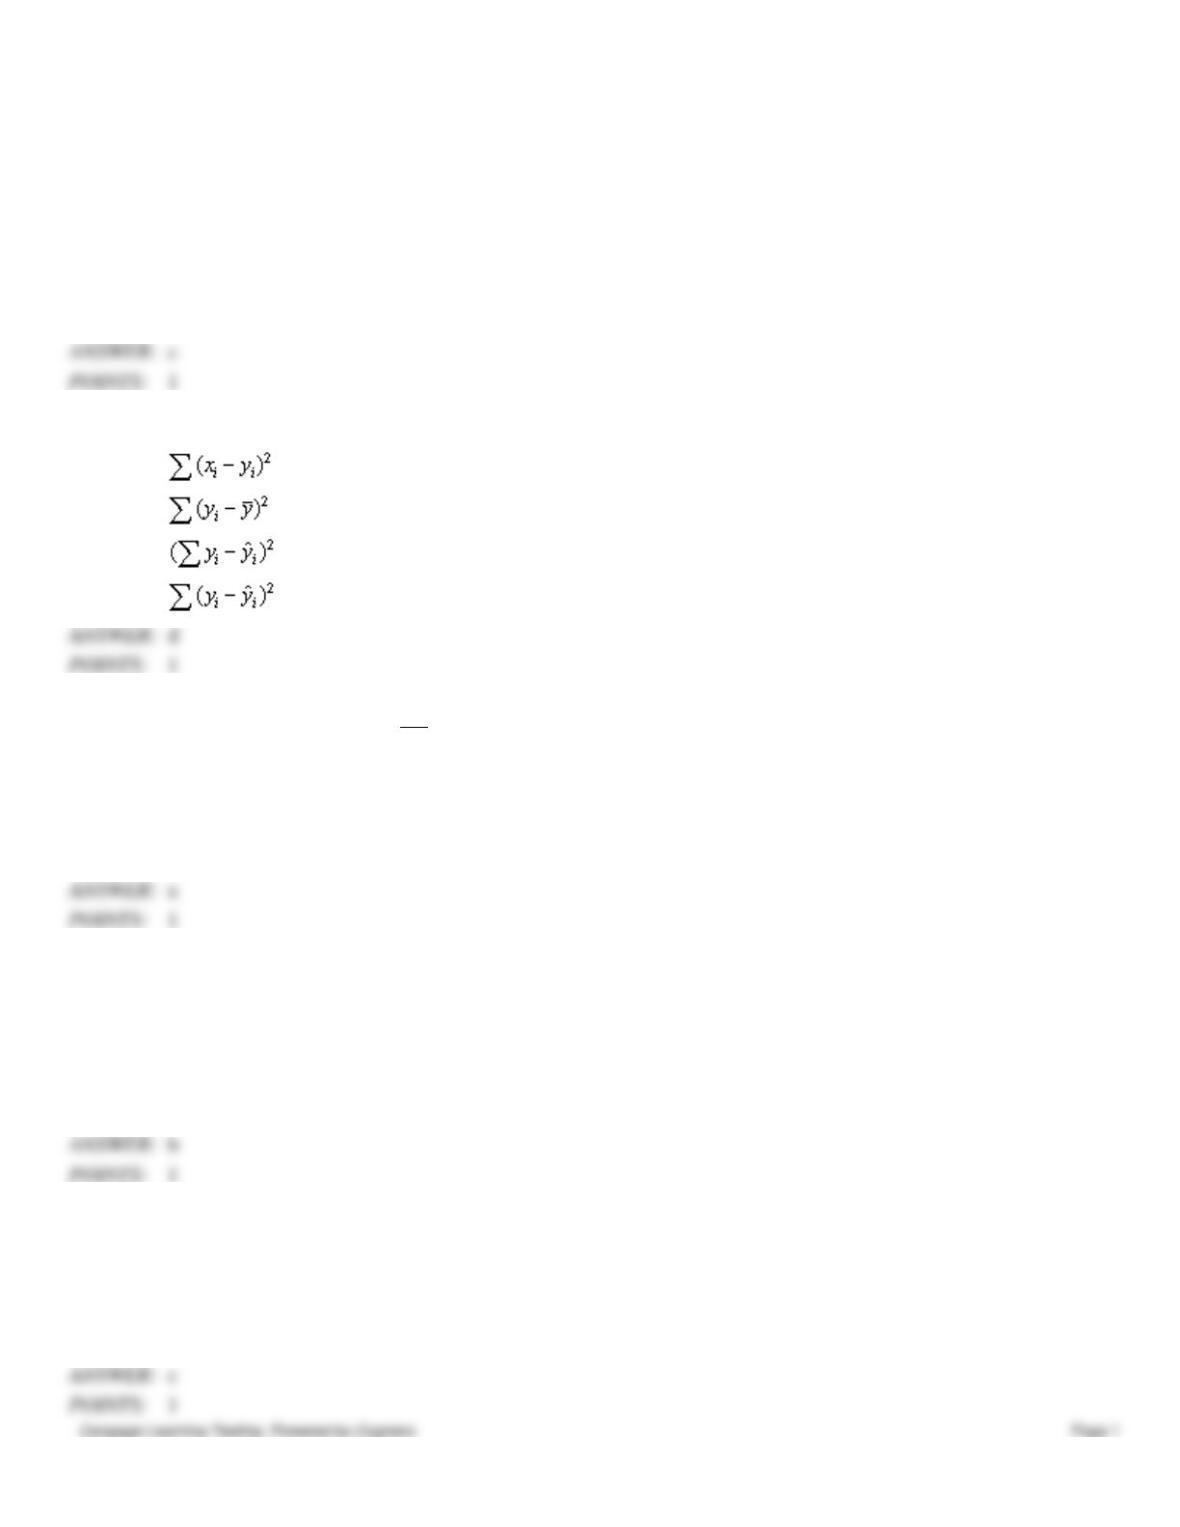
2. The least squares criterion is
a.
min
b.
min
c.
min
d.
min
3. In a residual plot against x that does not suggest we should challenge the assumptions of our regression model, we
would expect to see
a.
a horizontal band of points centered near zero
b.
a widening band of points
c.
a band of points having a slope consistent with that of the regression equation
d.
a parabolic band of points
a
4. The difference between the observed value of the dependent variable and the value predicted by using the estimated
regression equation is the
a.
standard error
b.
residual
c.
prediction interval
d.
variance
5. As the goodness of fit for the estimated regression equation increases,
a.
the absolute value of the regression equation’s slope increases
b.
the value of the regression equation’s y intercept decreases
c.
the value of the coefficient of determination increases
d.
the value of the correlation coefficient increases
c
6. A measure of the strength of the relationship between two variables is the
a.
coefficient of determination
b.
slope b1 of the estimated regression line
c.
standard error of the estimate
d.
correlation coefficient
7. The interval estimate of the mean value of y for a given value of x is the
a.
confidence interval
b.
prediction interval
c.
residual interval
d.
correlation interval
8. Regression analysis is a statistical procedure for developing a mathematical equation that describes how
a.
one independent and one or more dependent variables are related
b.
several independent and several dependent variables are related
c.
one dependent and one or more independent variables are related
d.
None of these answers is correct.
9. In regression analysis, the variable that is being predicted is the
a.
dependent variable
b.
independent variable
c.
intervening variable
d.
None of these answers is correct.
10. In a regression analysis, the variable that is being predicted
a.
must have the same units as the variable doing the predicting
b.
is the independent variable
c.
is the dependent variable
d.
usually is denoted by x
11. In regression analysis, the independent variable is
a.
used to predict other independent variables
b.
used to predict the dependent variable
c.
called the intervening variable

Chapter 12 – Simple Linear Regression
d.
None of these answers is correct.
b
1
12. The equation that describes how the dependent variable (y) is related to the independent variable (x) is called
a.
the correlation model
b.
the regression model
c.
correlation analysis
d.
None of these answers is correct.
b
1
13. In a simple regression analysis (where y is a dependent and x an independent variable), if the y intercept is positive,
then
a.
there is a positive correlation between x and y
b.
there is a negative correlation between x and y
c.
if x is increased, y must also increase
d.
None of these answers is correct.
d
1
14. A procedure used for finding the equation of a straight line that provides the best approximation for the relationship
between the independent and dependent variables is the
a.
correlation analysis
b.
mean squares method
c.
least squares method
d.
most squares method
1
15. Application of the least squares method results in values of the y intercept and the slope that minimizes the sum of the
squared deviations between the
a.
observed values of the independent variable and the predicted values of the independent variable
b.
actual values of the independent variable and predicted values of the dependent variable
c.
observed values of the dependent variable and the predicted values of the dependent variable
d.
None of these answers is correct.
1
16. A least squares regression line
a.
may be used to predict a value of y if the corresponding x value is given
b.
implies a cause-effect relationship between x and y
c.
can only be determined if a good linear relationship exists between x and y
d.
All of these answers are correct.
17. In regression analysis if the dependent variable is measured in dollars, the independent variable
a.
must also be in dollars
b.
must be in some unit of currency
c.
can be any units
d.
can not be in dollars
c
18. Regression analysis was applied between sales (in $1,000) and advertising (in $100), and the following regression
function was obtained.
= 80 + 6.2x
Based on the above estimated regression line, if advertising is $10,000, then the point estimate for sales (in dollars) is
a.
$62,080
b.
$142,000
c.
$700
d.
$700,000
19. Regression analysis was applied between sales (in $1000) and advertising (in $100) and the following regression
function was obtained.
= 500 + 4x
Based on the above estimated regression line if advertising is $10,000, then the point estimate for sales (in dollars) is
a.
$900
b.
$900,000
c.
$40,500
d.
$505,000
20. A regression analysis between demand (y in 1000 units) and price (x in dollars) resulted in the following equation
= 9 − 3x
The above equation implies that if the price is increased by $1, the demand is expected to
a.
increase by 6 units
b.
decrease by 3 units
c.
decrease by 6,000 units
d.
decrease by 3,000 units
21. A regression analysis between sales (in $1000) and price (in dollars) resulted in the following equation
= 50,000 − 8x
The above equation implies that an
a.
increase of $1 in price is associated with a decrease of $8 in sales
b.
increase of $8 in price is associated with an increase of $8,000 in sales
c.
increase of $1 in price is associated with a decrease of $42,000 in sales
d.
increase of $1 in price is associated with a decrease of $8000 in sales
d
1
22. A regression analysis between sales (y in $1000) and advertising (x in dollars) resulted in the following equation
= 50,000 + 6x
The above equation implies that an
a.
increase of $6 in advertising is associated with an increase of $6,000 in sales
b.
increase of $1 in advertising is associated with an increase of $6 in sales
c.
increase of $1 in advertising is associated with an increase of $56,000 in sales
d.
increase of $1 in advertising is associated with an increase of $6,000 in sales
d
1
23. SSE can never be
a.
larger than SST
b.
smaller than SST
c.
equal to 1
d.
equal to zero
1
24. Which of the following is correct?
a.
SSE = SSR + SST
b.
SSR = SSE + SST
c.
SST = SSR + SSE
d.
SST = (SSR)2
1
25. In simple linear regression, r2 is the
a.
estimated regression equation
b.
coefficient of correlation
c.
sum of the squared residuals
d.
coefficient of determination

Chapter 12 – Simple Linear Regression
d
1
26. If all the points of a scatter diagram lie on the least squares regression line, then the coefficient of determination for
these variables based on this data is
a.
0
b.
1
c.
either 1 or –1, depending upon whether the relationship is positive or negative
d.
could be any value between -1 and 1
b
1
27. Larger values of r2 imply that the observations are more closely grouped about the
a.
average value of the independent variables
b.
average value of the dependent variable
c.
least squares line
d.
origin
c
1
28. In a regression analysis if r2 = 1, then
a.
SSE must also be equal to one
b.
SSE must be equal to zero
c.
SSE can be any positive value
d.
SSE must be negative
b
1
29. In a regression analysis if r2 = 1, then
a.
SSE = SST
b.
SSE = 1
c.
SSR = SSE
d.
SSR = SST
d
1
30. In regression and correlation analysis, if SSE and SST are known, then with this information the
a.
coefficient of determination can be computed
b.
slope of the line can be computed
c.
y intercept can be computed
d.
All of the above can be computed.
a
1
31. In a regression analysis if SSE = 200 and SSR = 300, then the coefficient of determination is

Chapter 12 – Simple Linear Regression
a.
0.6667
b.
0.6000
c.
0.4000
d.
1.5000
32. In a regression analysis if SSE = 500 and SSR = 300, then the coefficient of determination is
a.
0.6000
b.
0.1666
c.
1.6666
d.
0.3750
33. If a data set has SST = 2,000 and SSE = 800, then the coefficient of determination is
a.
0.4
b.
0.6
c.
0.5
d.
0.8
34. In a regression analysis if SST = 4500 and SSE = 1575, then the coefficient of determination is
a.
0.35
b.
0.65
c.
2.85
d.
0.45
35. If the coefficient of determination is a positive value, then the regression equation
a.
must have a positive slope
b.
must have a negative slope
c.
could have either a positive or a negative slope
d.
must have a positive y intercept
c
36. It is possible for the coefficient of determination to be
a.
larger than 1
b.
less than one
c.
less than zero
d.
All of these answers are correct, depending on the situation under consideration.
37. If the coefficient of correlation is 0.8, the percentage of variation in the dependent variable explained by the estimated
regression equation is
a.
0.80%
b.
80%
c.
0.64%
d.
64%
38. If the coefficient of correlation is 0.4, the percentage of variation in the dependent variable explained by the estimated
regression equation
a.
is 40%
b.
is 16%
c.
is 4%
d.
can be any positive value
39. If the coefficient of determination is equal to 1, then the coefficient of correlation
a.
must also be equal to 1
b.
can be either -1 or +1
c.
can be any value between -1 to +1
d.
must be -1
40. If there is a very strong correlation between two variables, then the coefficient of correlation must be
a.
much larger than 1, if the correlation is positive
b.
much smaller than 1, if the correlation is negative
c.
either much larger than 1 or much smaller than 1
d.
None of these answers is correct.
41. If the coefficient of correlation is a positive value, then the slope of the regression line
a.
must also be positive
b.
can be either negative or positive
c.
can be zero
d.
None of these answers is correct.
a
42. If the coefficient of correlation is a negative value, then the coefficient of determination

Chapter 12 – Simple Linear Regression
a.
must also be negative
b.
must be zero
c.
can be either negative or positive
d.
must be positive
43. The numerical value of the coefficient of determination
a.
is always larger than the coefficient of correlation
b.
is always smaller than the coefficient of correlation
c.
is negative if the coefficient of determination is negative
d.
can be larger or smaller than the coefficient of correlation
44. If the coefficient of determination is 0.81, the coefficient of correlation
a.
is 0.6561
b.
must be 0.9
c.
must be positive
d.
None of these answers is correct.
45. If two variables, x and y, have a strong linear relationship, then
a.
there may or may not be any causal relationship between x and y
b.
x causes y to happen
c.
y causes x to happen
d.
None of these answers is correct.
46. In regression analysis, which of the following is not a required assumption about the error term ε?
a.
The expected value of the error term is zero.
b.
The variance of the error term is the same for all values of x.
c.
The values of the error term are independent.
d.
All are required assumptions about the error term.
47. In simple linear regression analysis, which of the following is not true?
a.
The F test and the t test yield the same results.
b.
The F test and the t test may or may not yield the same results.
c.
The relationship between x and y is represented by means of a straight line.
d.
The value of F = t2.

Chapter 12 – Simple Linear Regression
48. Compared to the confidence interval estimate for a particular value of y (in a linear regression model), the interval
estimate for an average value of y will be
a.
narrower
b.
wider
c.
the same
d.
Not enough information is given.
a
49. A data point (observation) that does not fit the trend shown by the remaining data is called a(n)
a.
residual
b.
outlier
c.
point estimate
d.
None of the other answers is correct.
50. An observation that has a strong effect on the regression results is called a(n)
a.
residual
b.
sum of squares error
c.
influential observation
d.
None of the other answers is correct.
c
51. Data points having high leverage are often
a.
residuals
b.
sum of squares error
c.
influential
d.
None of the other answers is correct.
c
Exhibit 12-1
A regression analysis resulted in the following information regarding a dependent variable (y) and an independent variable
(x).
n = 10
∑x = 55
∑y = 55
∑x2 = 385
∑y2 = 385
∑xy = 220
52. Refer to Exhibit 12–1. The least squares estimate of b1 equals
a.
1
b.
-1
c.
5.5
d.
11
ANSWER:
b
POINTS:
1
53. Refer to Exhibit 12–1. The least squares estimate of b0 equals
a.
1
b.
-1
c.
5.5
d.
11
ANSWER:
d
POINTS:
1
54. Refer to Exhibit 12–1. The point estimate of y when x = 20 is
a.
0
b.
31
c.
9
d.
-9
ANSWER:
d
POINTS:
1
Exhibit 12-2
You are given the following information about y and x.
y
x
Dependent
Independent
Variable
Variable
5
15
7
12
9
10
11
7
55. Refer to Exhibit 12–2. The least squares estimate of b1 equals
a.
-0.7647
b.
-0.13
c.
21.4
d.
16.412
ANSWER:
a
POINTS:
1
56. Refer to Exhibit 12–2. The least squares estimate of b0 equals
a.
-7.647

Chapter 12 – Simple Linear Regression
b.
-1.3
c.
21.4
d.
16.41176
d
1
57. Refer to Exhibit 12–2. The sample correlation coefficient equals
a.
-86.667
b.
-0.99705
c.
0.9941
d.
0.99705
b
1
58. Refer to Exhibit 12–2. The coefficient of determination equals
a.
-0.99705
b.
-0.9941
c.
0.9941
d.
0.99705
c
1
Exhibit 12-3
Regression analysis was applied between sales data (in $1,000s) and advertising data (in $100s) and the following
information was obtained.
= 12 + 1.8x
n = 17
SSR = 225
SSE = 75
sb1 = 0.2683
59. Refer to Exhibit 12–3. Based on the above estimated regression equation, if advertising is $3,000, then the point
estimate for sales (in dollars) is
a.
$66,000
b.
$5,412
c.
$66
d.
$17,400
a
1
60. Refer to Exhibit 12–3. The F statistic computed from the above data is
a.
3
b.
45
Chapter 12 – Simple Linear Regression
c.
48
d.
Not enough information is given to answer this question.
b
1
61. Refer to Exhibit 12–3. The critical F value at α = 0.05 is
a.
3.59
b.
3.68
c.
4.45
d.
4.54
d
1
62. Refer to Exhibit 12–3. The t statistic for testing the significance of the slope is
a.
1.80
b.
1.96
c.
6.709
d.
0.555
c
1
63. Refer to Exhibit 12–3. Using α = 0.05, the critical t value for testing the significance of the slope is
a.
1.753
b.
2.131
c.
1.746
d.
2.120
b
1
Exhibit 12-4
The following information regarding a dependent variable (Y) and an independent variable (X) is provided.
Y
X
4
2
3
1
4
4
6
3
8
5
SSE = 6
SST = 16
64. Refer to Exhibit 12–4. The least squares estimate of the Y intercept is
a.
1
b.
2
c.
3

Chapter 12 – Simple Linear Regression
d.
4
b
1
65. Refer to Exhibit 12–4. The least squares estimate of the slope is
a.
1
b.
2
c.
3
d.
4
a
1
66. Refer to Exhibit 12–4. The coefficient of determination is
a.
0.7096
b.
– 0.7906
c.
0.625
d.
0.375
c
1
67. Refer to Exhibit 12–4. The coefficient of correlation is
a.
0.7906
b.
– 0.7906
c.
0.625
d.
0.375
a
1
68. Refer to Exhibit 12–4. The MSE is
a.
1
b.
2
c.
3
d.
4
b
1
Exhibit 12-5
You are given the following information about y and x.
Dependent Variable y
Independent Variable x
5
1
4
2
3
3
2
4
1
5
69. Refer to Exhibit 12–5. The least squares estimate of b1 (slope) equals
a.
1
b.
-1
c.
6
d.
5
b
1
70. Refer to Exhibit 12–5. The least squares estimate of b0 (intercept)equals
a.
1
b.
-1
c.
6
d.
5
c
1
71. Refer to Exhibit 12–5. The point estimate of y when x = 10 is
a.
–10
b.
10
c.
-4
d.
4
c
1
72. Refer to Exhibit 12–5. The sample correlation coefficient equals
a.
0
b.
+1
c.
-1
d.
-0.5
c
1
73. Refer to Exhibit 12–5. The coefficient of determination equals
a.
0
b.
-1
c.
+1
d.
-0.5
c
1
Exhibit 12-6
You are given the following information about y and x.
Dependent Variable y
Independent Variable x
12
4
3
6
74. Refer to Exhibit 12–6. The least squares estimate of b1 equals
a.
1
b.
-1
c.
–11
d.
11
b
1
75. Refer to Exhibit 12–6. The least squares estimate of b0 equals
a.
1
b.
-1
c.
–11
d.
11
d
1
76. Refer to Exhibit 12–6. The sample correlation coefficient equals
a.
-0.4364
b.
0.4364
c.
-0.1905
d.
0.1905
a
1
77. Refer to Exhibit 12–6. The coefficient of determination equals
a.
-0.4364
b.
0.4364
c.
-0.1905
d.
0.1905
d
1
78. The standardized residual is provided by dividing each residual by
a.
its mean residual
b.
its corresponding x value
c.
its standard deviation
d.
its z-score
c
1
79. The primary tool or measure for determining whether the assumed regression model is appropriate is
2
4

Chapter 12 – Simple Linear Regression
a.
the F test
b.
residual analysis
c.
the R2 value
d.
the correlation coefficient
POINTS:
1
80. In regression analysis, the F test will provide the same conclusion as the t test if
a.
there is only one dependent variable
b.
there is only one independent variable
c.
there is a positive correlation between x and y
d.
the y-intercept is positive
ANSWER:
a
POINTS:
1
81. Confidence intervals and prediction intervals
a.
reflect the significance of the regression analysis
b.
verify the assumptions of the regression model
c.
show the precision of the regression results
d.
confirm the relationship between x and y
ANSWER:
c
POINTS:
1
82. In general, the lines for the confidence interval limits and the prediction interval limits both have
a.
oscillation
b.
parallelism
c.
curvature
d.
convergence
ANSWER:
c
POINTS:
1
Subjective Short Answer
83. Given below are seven observations collected in a regression study on two variables, x (independent variable) and y
(dependent variable).
x
y
2
12
3
9
6
8
7
7
8
6
7
5
9
2
a.
Develop the least squares estimated regression equation.
b.
At 95% confidence, perform a t test and determine whether or not the slope is significantly
Chapter 12 – Simple Linear Regression
different from zero.
c.
Perform an F test to determine whether or not the model is significant. Let α = 0.05.
d.
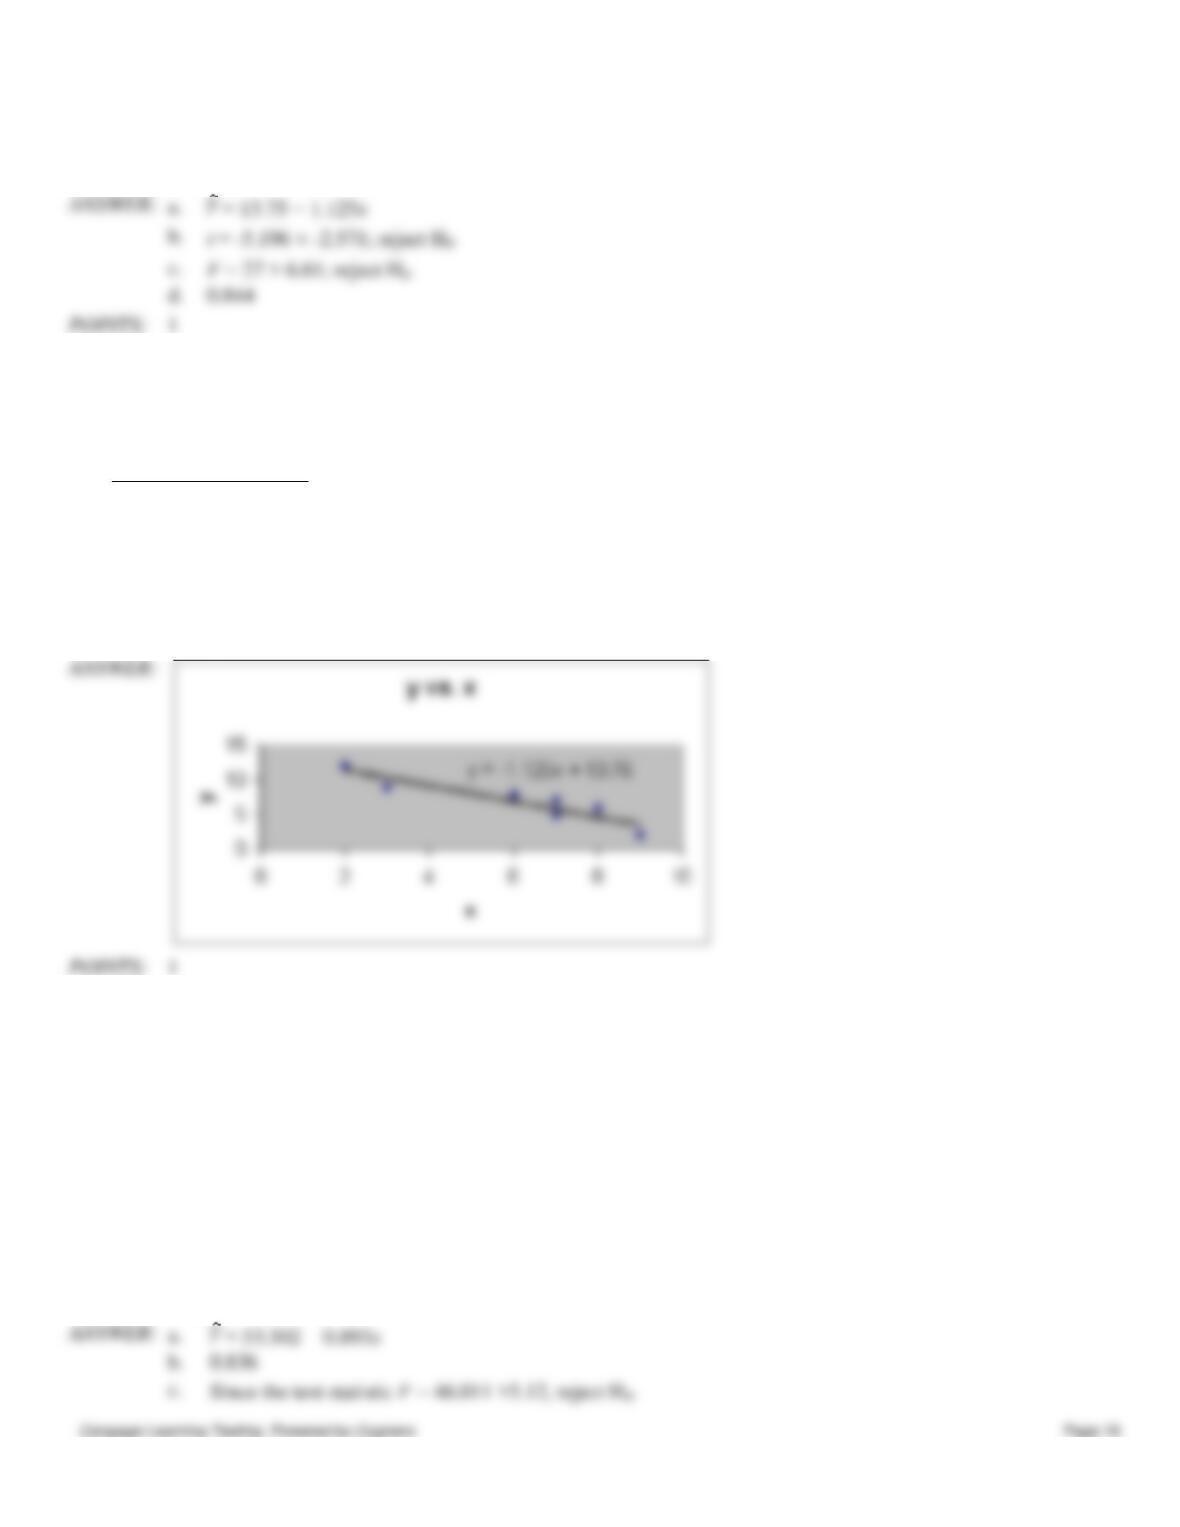
Compute the coefficient of determination.
d.
0.844
POINTS:
1
84. Given below are seven observations collected in a regression study on two variables, x (independent variable) and y
(dependent variable). Use Excel to develop a scatter diagram and to compute the least squares estimated regression
equation.
x
y
2
12
3
9
6
8
7
7
8
6
7
5
9
2
POINTS:
1
85. A company has recorded data on the daily demand for its product (y in thousands of units) and the unit price (x in
hundreds of dollars). A sample of 11 days demand and associated price resulted in the following data.
∑ x = 154
∑ x 2 = 2,586
∑ y = 451
∑ y 2 = 18,901
∑ x y = 5,930
a.
Using the above information, develop the least-squares estimated regression line.
b.
Compute the coefficient of determination.
c.
Perform an F test and determine whether or not there is a significant relationship between
demand and unit price. Let α = 0.05.
d.
Perform a t test to determine whether the slope is significantly different from zero. Let α =
0.05.
e.
Would the demand ever reach zero? If yes, at what price would the demand be zero. Show
your complete work.
b.
0.836
86. A company has recorded data on the daily demand for its product (y in thousands of units) and the unit price (x in
hundreds of dollars). A sample of 15 days demand and associated prices resulted in the following data.
∑ x = 75
∑ x 2 = 469
∑ y = 135
∑ y 2 = 1315
∑ x y = 616
a.
Using the above information, develop the least-squares estimated regression line and write
the equation.
b.
Compute the coefficient of determination.
c.
Perform an F test and determine whether or not there is a significant relationship between
demand and unit price. Let α = 0.05.
d.
Would the demand ever reach zero? If yes, at what price would the demand be zero?
d.
1
87. A company has recorded data on the daily demand for its product (y in thousands of units) and the unit price (x in
hundreds of dollars). A sample of 15 days demand and associated prices resulted in the following data.
∑ x = 75
∑ x 2 = 437
∑ y = 180
∑ y 2 = 2266
∑ x y = 844
a.
Using the above information, develop the least-squares estimated regression line and write
the equation.
b.
Compute the coefficient of determination.
c.
Perform an F test and determine whether or not there is a significant relationship between
demand and unit price. Let α = 0.05.
d.
Would the demand ever reach zero? If yes, at what price would the demand be zero?
d.
1
88. A company has recorded data on the weekly sales for its product (y) and the unit price of the competitor’s product (x).
The data resulting from a random sample of 7 weeks follows. Use Excel to develop a scatter diagram and to compute the
least squares estimated regression equation and the coefficient of determination.
Week
Price
Sales
1
.33
20
2
.25
14
3
.44
22
4
.40
21
5
.35
16
6
.39
19
d.
The test statistic t = -6.765
1