Archives: Quiz
MATH 279 Quiz 3
If the assumption can be made that the populations all have the same shape, the Kruskal-Wallis test becomes a. a test of the skewness of the k populations b. a test of the variances of the k populations c. a […]
CAL 149
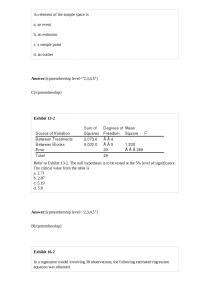
An element of the sample space is a. an event b. an estimator c. a sample point d. an outlier Exhibit 13-2 Refer to Exhibit 13-2. The null hypothesis is to be tested at the 5% level of significance. The […]
MATH 680 Test 2
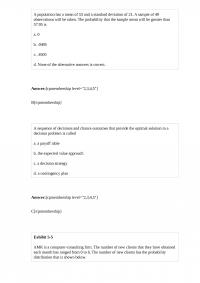
A population has a mean of 53 and a standard deviation of 21. A sample of 49 observations will be taken. The probability that the sample mean will be greater than 57.95 is a. 0 b. .0495 c. .4505 d. […]
MATH 739 Midterm 1
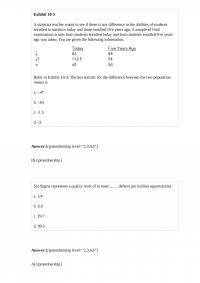
Exhibit 10-3 A statistics teacher wants to see if there is any difference in the abilities of students enrolled in statistics today and those enrolled five years ago. A sample of final examination scores from students enrolled today and from […]
MATH 798 Homework
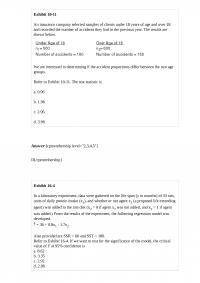
Exhibit 10-11 An insurance company selected samples of clients under 18 years of age and over 18 and recorded the number of accidents they had in the previous year. The results are shown below. We are interested in determining if […]
CAL 675 Quiz 3
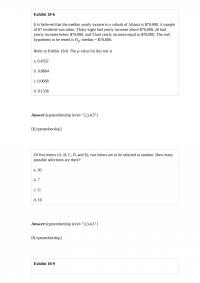
Exhibit 18-6 It is believed that the median yearly income in a suburb of Atlanta is $70,000. A sample of 67 residents was taken. Thirty-eight had yearly incomes above $70,000, 26 had yearly incomes below $70,000, and 3 had yearly […]
MATH 518
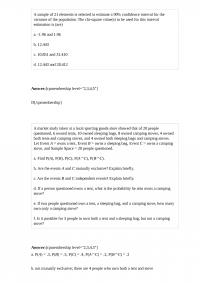
A sample of 21 elements is selected to estimate a 90% confidence interval for the variance of the population. The chi-square value(s) to be used for this interval estimation is (are) a. -1.96 and 1.96 b. 12.443 c. 10.851 and […]
MATH 528
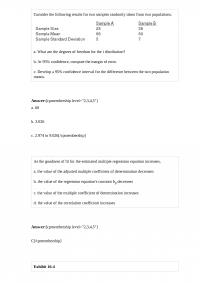
Consider the following results for two samples randomly taken from two populations. a. What are the degrees of freedom for the t distribution? b. At 95% confidence, compute the margin of error. c. Develop a 95% confidence interval for the […]
CAL 736
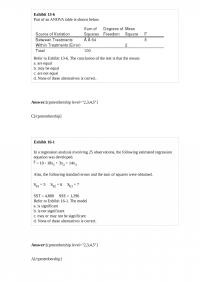
Exhibit 13-6 Part of an ANOVA table is shown below. Refer to Exhibit 13-6. The conclusion of the test is that the means a. are equal b. may be equal c. are not equal d. None of these alternatives is […]
CAL 394
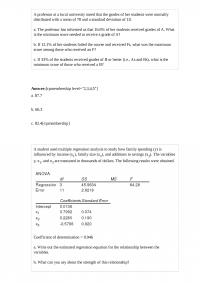
Exhibit 14-3 Regression analysis was applied between sales data (in $1,000s) and advertising data (in $100s) and the following information was obtained. Refer to Exhibit 14-3. Based on the above estimated regression equation, if advertising is $3,000, then the point […]
MATH 820 Midterm
A professor at a local university noted that the grades of her students were normally distributed with a mean of 78 and a standard deviation of 10. a. The professor has informed us that 16.6% of her students received grades […]
MATH 547 Test 2
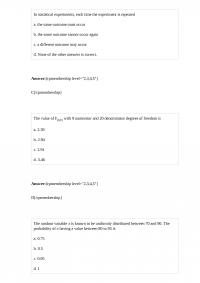
In statistical experiments, each time the experiment is repeated a. the same outcome must occur b. the same outcome cannot occur again c. a different outcome may occur d. None of the other answers is correct. The value of F0.01 […]
MATH 531 Quiz 2
A simple random sample of size n from a finite population of size N is a sample selected such that each possible sample of size a. N has the same probability of being selected b. n has a probability of […]
MATH 792 Quiz
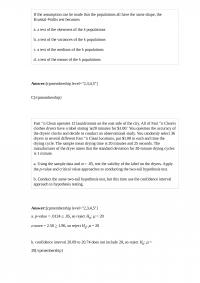
The manager of University Credit Union (UCU) is concerned about checking account transaction discrepancies. Customers are bringing transaction errors to the attention of the bank’s staff several months after they occur. The manager would like to know what proportion of […]
CAL 512 Test
A standard normal distribution is a normal distribution with a. a mean of 1 and a standard deviation of 0 b. a mean of 0 and a standard deviation of 1 c. any mean and a standard deviation of 1 […]
MATH 667 Test
A control chart that is used to monitor the range of the measurements in a sample is a. a p chart b. an x-bar chart c. an R chart d. an np chart The sample result plotted on an np […]
MATH 537
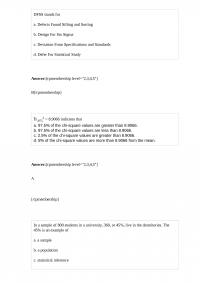
DFSS stands for a. Defects Found Sifting and Sorting b. Design For Six Sigma c. Deviation From Specifications and Standards d. Defer For Statistical Study χ.9752 = 8.9066 indicates that a. 97.5% of the chi-square values are greater than 8.9066. […]
MATH 525
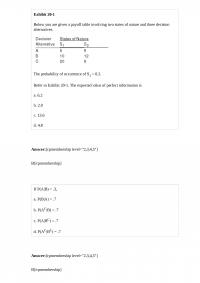
Exhibit 20-1 Below you are given a payoff table involving two states of nature and three decision alternatives. The probability of occurrence of S1 = 0.2. Refer to Exhibit 20-1. The expected value of perfect information is a. 6.2 b. […]
MATH 895 Test 1
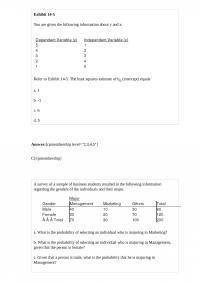
Exhibit 14-5 You are given the following information about y and x. Refer to Exhibit 14-5. The least squares estimate of b0 (intercept) equals a. 1 b. -1 c. 6 d. 5 A survey of a sample of business students […]
CAL 752 Quiz 2
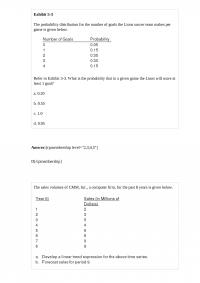
Exhibit 5-3 The probability distribution for the number of goals the Lions soccer team makes per game is given below. Refer to Exhibit 5-3. What is the probability that in a given game the Lions will score at least 1 […]
MATH 778 Midterm
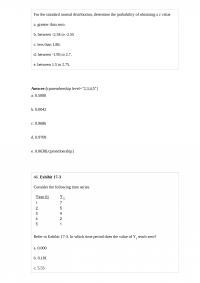
For the standard normal distribution, determine the probability of obtaining a z value a. greater than zero. b. between -2.34 to -2.55 c. less than 1.86. d. between -1.95 to 2.7. e. between 1.5 to 2.75. 46. Exhibit 17-3 Consider […]
MATH 578 Quiz 2
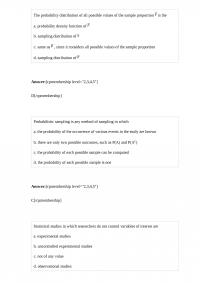
The probability distribution of all possible values of the sample proportion is the a. probability density function of b. sampling distribution of c. same as , since it considers all possible values of the sample proportion d. sampling distribution of […]
CAL 623 Quiz 1
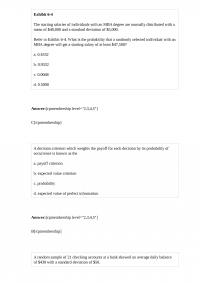
Exhibit 6-4 The starting salaries of individuals with an MBA degree are normally distributed with a mean of $40,000 and a standard deviation of $5,000. Refer to Exhibit 6-4. What is the probability that a randomly selected individual with an […]
CAL 662 Midterm
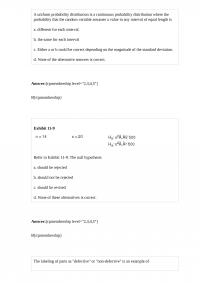
A uniform probability distribution is a continuous probability distribution where the probability that the random variable assumes a value in any interval of equal length is a. different for each interval b. the same for each interval c. Either a […]
CAL 364
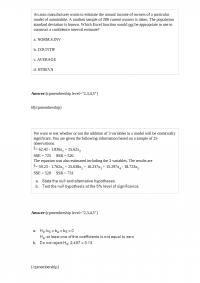
An auto manufacturer wants to estimate the annual income of owners of a particular model of automobile. A random sample of 200 current owners is taken. The population standard deviation is known. Which Excel function would not be appropriate to […]
MATH 492
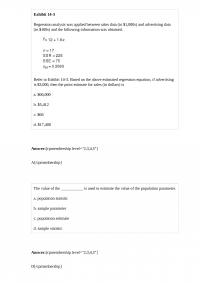
Regression analysis was applied between sales (in $1,000) and advertising (in $100), and the following regression function was obtained. 80 6.2x Based on the above estimated regression line, if advertising is $10,000, then the point estimate for sales […]
CAL 764 Test 2
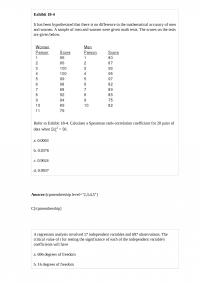
Exhibit 18-4 It has been hypothesized that there is no difference in the mathematical accuracy of men and women. A sample of men and women were given math tests. The scores on the tests are given below. Refer to Exhibit […]
MATH 780 Midterm 1
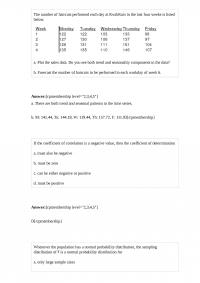
The number of haircuts performed each day at KwikKuts in the last four weeks is listed below. a. Plot the sales data. Do you see both trend and seasonality components in the data? b. Forecast the number of haircuts to […]
CAL 332 Quiz 3
If we change a 95% confidence interval estimate to a 99% confidence interval estimate, we can expect the a. width of the confidence interval to increase b. width of the confidence interval to decrease c. width of the confidence interval […]
CAL 748
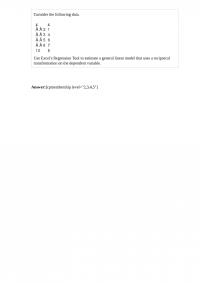
Consider the following data. Use Excel’s Regression Tool to estimate a general linear model that uses a reciprocal transformation on the dependent variable. Answer: Exhibit 18-4 It has been hypothesized that there is no difference in the mathematical accuracy of […]
CAL 393 Quiz
In simple linear regression analysis, which of the following is not true? a. The F test and the t test yield the same results. b. The F test and the t test may or may not yield the same results. […]
CAL 136 Midterm 2
Political Science, Inc. (PSI) specializes in voter polls and surveys designed to keep political office seekers informed of their position in a race. Using telephone surveys, interviewers ask registered voters who they would vote for if the election were held […]
MATH 123 Midterm 2
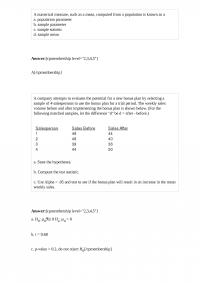
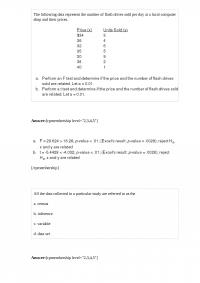
A numerical measure, such as a mean, computed from a population is known as a a. population parameter b. sample parameter c. sample statistic d. sample mean A company attempts to evaluate the potential for a new bonus plan by […]
CAL 775 Midterm 1
The following data represent the number of flash drives sold per day at a local computer shop and their prices. All the data collected in a particular study are referred to as the a. census b. inference c. variable d. […]
MATH 602
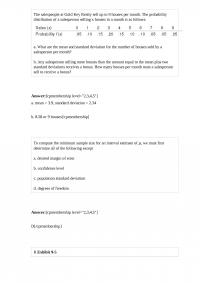
The salespeople at Gold Key Realty sell up to 9 houses per month. The probability distribution of a salesperson selling x houses in a month is as follows: a. What are the mean and standard deviation for the number of […]
MATH 817
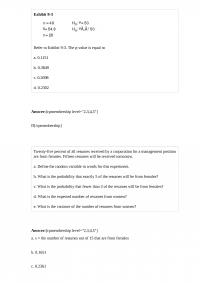
Exhibit 9-3 Refer to Exhibit 9-3. The p-value is equal to a. 0.1151 b. 0.3849 c. 0.2698 d. 0.2302 Twenty-five percent of all resumes received by a corporation for a management position are from females. Fifteen resumes will be received […]
CAL 562
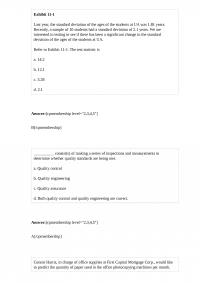
Exhibit 11-1 Last year, the standard deviation of the ages of the students at UA was 1.81 years. Recently, a sample of 10 students had a standard deviation of 2.1 years. We are interested in testing to see if there […]
MATH 854
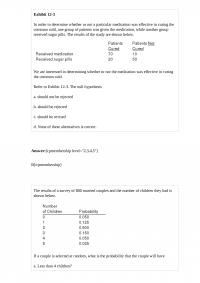
Exhibit 12-3 In order to determine whether or not a particular medication was effective in curing the common cold, one group of patients was given the medication, while another group received sugar pills. The results of the study are shown […]
CAL 131 Test 1
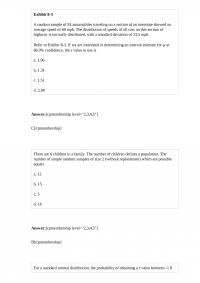
Exhibit 8-3 A random sample of 81 automobiles traveling on a section of an interstate showed an average speed of 60 mph. The distribution of speeds of all cars on this section of highway is normally distributed, with a standard […]
MATH 461
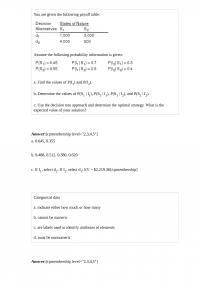
You are given the following payoff table: Assume the following probability information is given: a. Find the values of P(I1) and P(I2). b. Determine the values of P(S1 | I1), P(S2 | I1), P(S1 | I2), and P(S2 | I2). […]
MATH 314 Final
The mean of a sample is a. always equal to the mean of the population b. always smaller than the mean of the population c. computed by summing the data values and dividing the sum by (n 1) d. […]
MATH 311
A Type II error is committed when a. a true alternative hypothesis is mistakenly rejected b. a true null hypothesis is mistakenly rejected c. the sample size has been too small d. not enough information has been available If a […]
CAL 664
The probability of the states of nature, after use of Bayes’ theorem to adjust the prior probabilities based upon given indicator information, is called a. marginal probability b. conditional probability c. posterior probability d. None of the answers are correct. […]
CAL 403 Quiz 3
In hypothesis testing if the null hypothesis has been rejected when the alternative hypothesis has been true, a. a Type I error has been committed b. a Type II error has been committed c. either a Type I or Type […]
MATH 604 Quiz
If two events are mutually exclusive, then the probability of their intersection a. will be equal to zero b. can have any value larger than zero c. must be larger than zero, but less than one d. will be one […]
CAL 615 Midterm 2
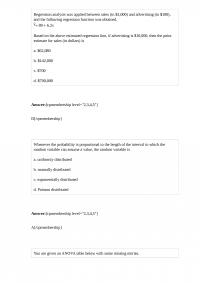
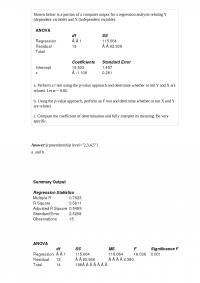
Shown below is a portion of a computer output for a regression analysis relating Y (dependent variable) and X (independent variable). a. Perform a t test using the p-value approach and determine whether or not Y and X are related. […]
MATH 423 Quiz 1
The manager of University Credit Union (UCU) is concerned about checking account transaction discrepancies. Customers are bringing transaction errors to the attention of the bank’s staff several months after they occur. The manager would like to know what proportion of […]
CAL 812 Quiz
The grades of a sample of 5 students, selected from a large population, are given below. a. Determine a point estimate for the variance of the population. b. Determine a 95% confidence interval for the variance of the population. c. […]
MATH 518 Midterm 1
In determining an interval estimate of a population mean when is unknown, we use a t distribution with a. degrees of freedom b. degrees of freedom c. n 1 degrees of freedom d. n degrees of freedom Read […]
CAL 168 Quiz 3
Exhibit 17-1 Below you are given the first five values of a quarterly time series. The multiplicative model is appropriate and a four-quarter moving average will be used. Refer to Exhibit 17-1. An estimate of the seasonal-irregular component for Quarter […]