Archives: Quiz
Acct 243 Test 2
Equipment should be evaluated for possible replacement only as it nears the end of its useful life. A capital investment with an internal rate of return equal to or greater than the required rate of return is considered to be […]
Accounting 267 Midterm 1
Karen is a Certified Management Accountant and is bound by the IMA’s Standards of Ethical Conduct. Her superior has asked her to try to influence the firm’s outside auditors with expensive gifts and favors. If Karen complies, she will violate […]
ACC 183 Midterm 2
Facility-level costs are not involved in decisions to eliminate a segment of a business. Wayne Company wishes to allocate overhead costs in a heavily automated production department. Direct labor hours would be a less appropriate cost driver than machine hours. […]
ACCT 799 Midterm 1
Inaccurate allocation of joint costs to the individual products could cause an unprofitable product to appear to be profitable. If a company has to pay a given amount of income taxes over the life of a capital investment, managers of […]
SMG AC 744
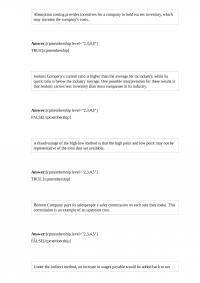
Absorption costing provides incentives for a company to hold excess inventory, which may increase the company’s costs. Jenkins Company’s current ratio is higher than the average for its industry, while its quick ratio is below the industry average. One possible […]
CAL 113 Final
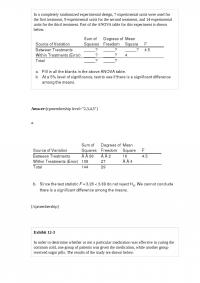
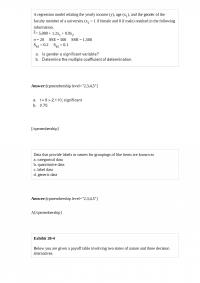
In a completely randomized experimental design, 7 experimental units were used for the first treatment, 9 experimental units for the second treatment, and 14 experimental units for the third treatment. Part of the ANOVA table for this experiment is shown […]
MATH 231 Test 1
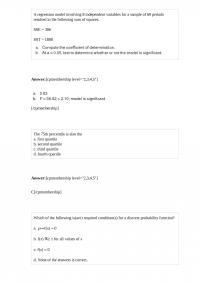
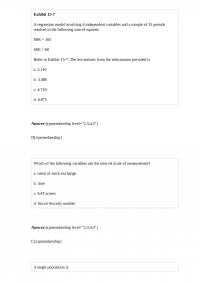
A regression model involving 8 independent variables for a sample of 69 periods resulted in the following sum of squares. SSE = 306 SST = 1800 The 75th percentile is also the a. first quartile b. second quartile c. third […]
CAL 205 Midterm
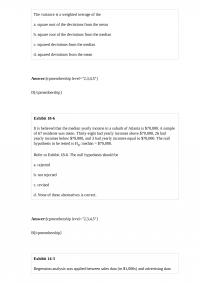
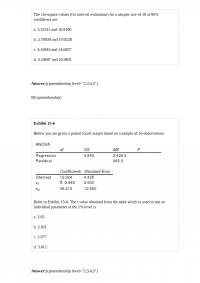
The variance is a weighted average of the a. square root of the deviations from the mean b. square root of the deviations from the median c. squared deviations from the median d. squared deviations from the mean Exhibit 18-6 […]
MATH 321
The chi-square values (for interval estimation) for a sample size of 10 at 95% confidence are a. 3.32511 and 16.9190 b. 2.70039 and 19.0228 c. 4.16816 and 14.6837 d. 3.24697 and 20.4831 Exhibit 15-6 Below you are given a partial […]
CAL 483
It is known that the population variance equals 484. With a 0.95 probability, the sample size that needs to be taken to estimate the population mean if the desired margin of error is 5 or less is a. 25 b. […]
CAL 643 Final
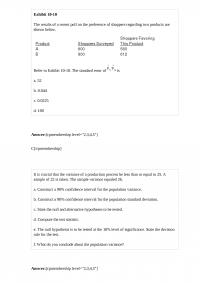
Exhibit 10-10 The results of a recent poll on the preference of shoppers regarding two products are shown below. Refer to Exhibit 10-10. The standard error of is a. 52 b. 0.044 c. 0.0225 d. 100 It is crucial that […]
MATH 369 Test
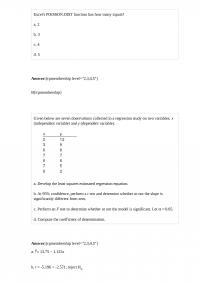
Excel’s POISSON.DIST function has how many inputs? a. 2 b. 3 c. 4 d. 5 Given below are seven observations collected in a regression study on two variables, x (independent variable) and y (dependent variable). a. Develop the least squares […]
CAL 471 Quiz
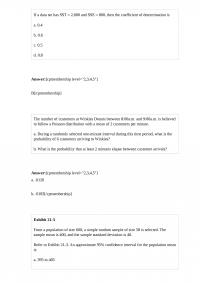
If a data set has SST 2,000 and SSE 800, then the coefficient of determination is a. 0.4 b. 0.6 c. 0.5 d. 0.8 The number of customers at Winkies Donuts between 8:00a.m. and 9:00a.m. is believed to […]
CAL 242 Midterm 2
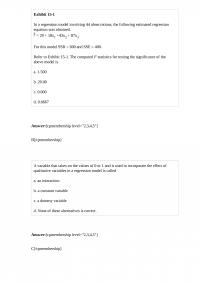
Exhibit 15-1 In a regression model involving 44 observations, the following estimated regression equation was obtained. = 29 + 18×1 +43×2 + 87×3 For this model SSR = 600 and SSE = 400. Refer to Exhibit 15-1. The computed F […]
MATH Excel’s Can Be Used To Construct A Crosstabulation
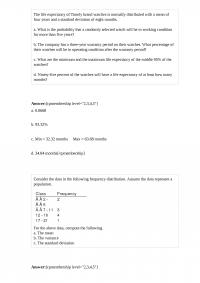
The life expectancy of Timely brand watches is normally distributed with a mean of four years and a standard deviation of eight months. a. What is the probability that a randomly selected watch will be in working condition for more […]
MATH 342 Homework
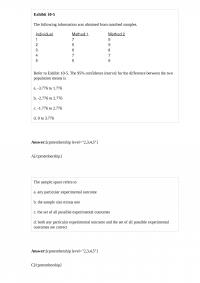
Exhibit 10-5 The following information was obtained from matched samples. Refer to Exhibit 10-5. The 95% confidence interval for the difference between the two population means is a. -3.776 to 1.776 b. -2.776 to 2.776 c. -1.776 to 2.776 d. […]
CAL 588 Quiz 2
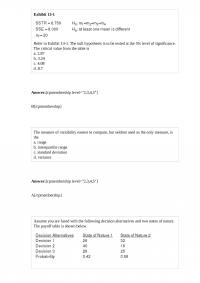
Exhibit 13-1 Refer to Exhibit 13-1. The null hypothesis is to be tested at the 5% level of significance. The critical value from the table is a. 2.87 b. 3.24 c. 4.08 d. 8.7 The measure of variability easiest to […]
MATH 338
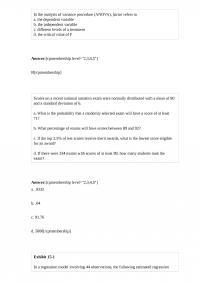
In the analysis of variance procedure (ANOVA), factor refers to a. the dependent variable b. the independent variable c. different levels of a treatment d. the critical value of F Scores on a recent national statistics exam were normally distributed […]
CAL 376
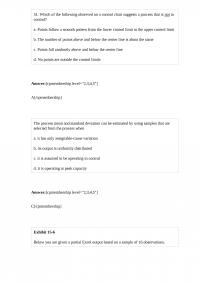
51. Which of the following observed on a control chart suggests a process that is not in control? a. Points follow a smooth pattern from the lower control limit to the upper control limit b. The number of points above […]
CAL 290
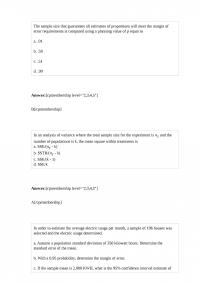
The sample size that guarantees all estimates of proportions will meet the margin of error requirements is computed using a planning value of p equal to a. .01 b. .50 c. .51 d. .99 In an analysis of variance where […]
MATH 280 Quiz
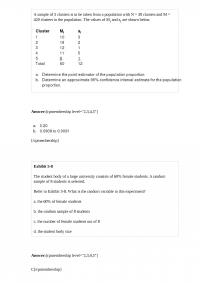
A sample of 5 clusters is to be taken from a population with N = 30 clusters and M = 420 clusters in the population. The values of Mi and ai are shown below. Exhibit 5-8 The student body of […]
MATH 387 Quiz 3
When dealing with the problem of non-constant variance, the reciprocal transformation means using a. 1/x as the independent variable instead of x b. x2 as the independent variable instead of x c. y2 as the dependent variable instead of y […]
CAL 156
The exponential probability distribution is used with a. a discrete random variable b. a continuous random variable c. any probability distribution with an exponential term d. an approximation of the binomial probability distribution We can examine the effect of the […]
MATH 429 Quiz
A multiple regression model has a. only one independent variable b. more than one dependent variable c. more than one independent variable d. at least 2 dependent variables When the conclusions based upon the aggregated crosstabulation can be completely reversed […]
MATH 692
An intersection or junction point of a decision tree is called a (n) a. junction b. intersection c. intersection point d. node A movie based on a best-selling novel was recently released. Six hundred viewers of the movie, 235 of […]
MATH 478 Midterm 1
Exhibit 15-2 A regression model between sales (y in $1,000), unit price (x1 in dollars) and television advertisement (x2 in dollars) resulted in the following function: = 7 – 3×1 + 5×2 For this model SSR = 3500, SSE = […]
CAL 676 Midterm 2
Z is a standard normal random variable. The P(1.05 z 2.13) equals a. 0.8365 b. 0.1303 c. 0.4834 d. None of the alternative answers is correct. A population has a mean of 80 and a standard deviation of […]
CAL 255 Quiz 3
Missy Walters owns a mail-order business specializing in baby clothes. Missy is confident the dollar amounts of all her orders are normally distributed or nearly so. Assume she knows the mean and standard deviation are $249 and $46, respectively, for […]
MATH 265
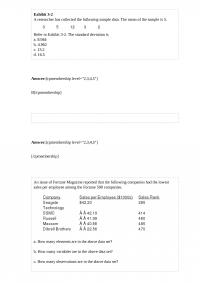
Exhibit 3-2 A researcher has collected the following sample data. The mean of the sample is 5. Refer to Exhibit 3-2. The standard deviation is a. 8.944 b. 4.062 c. 13.2 d. 16.5 An issue of Fortune Magazine reported that […]
CAL 588 Quiz
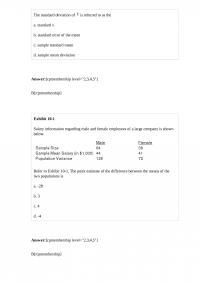
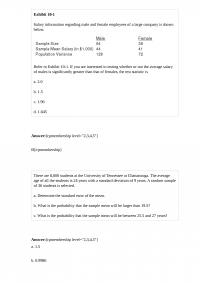
The standard deviation of is referred to as the a. standard x b. standard error of the mean c. sample standard mean d. sample mean deviation Exhibit 10-1 Salary information regarding male and female employees of a large company is […]
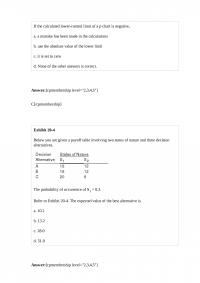
CAL 442 Test
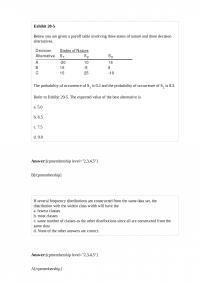
Exhibit 20-5 Below you are given a payoff table involving three states of nature and three decision alternatives. The probability of occurrence of S1 is 0.2 and the probability of occurrence of S2 is 0.3. Refer to Exhibit 20-5. The […]
CAL 398 Test
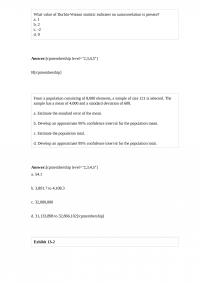
What value of Durbin-Watson statistic indicates no autocorrelation is present? a. 1 b. 2 c. -2 d. 0 From a population consisting of 8,000 elements, a sample of size 121 is selected. The sample has a mean of 4,000 and […]
MATH 564 Homework
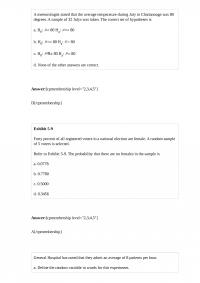
A meteorologist stated that the average temperature during July in Chattanooga was 80 degrees. A sample of 32 Julys was taken. The correct set of hypotheses is a. H0: 80 Ha: 80 b. H0: 80 Ha: > […]
MATH 457 Quiz
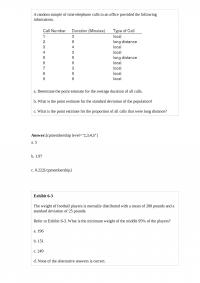
A random sample of nine telephone calls in an office provided the following information. a. Determine the point estimate for the average duration of all calls. b. What is the point estimate for the standard deviation of the population? c. […]
MATH 464
The number observations in a complete data set having 10 elements and 5 variables is a. 5 b. 10 c. 25 d. 50 A binomial probability distribution with p = .3 is a. negatively skewed b. symmetrical c. positively skewed […]
MATH 699 Midterm 2
When should measures of location and dispersion be computed from grouped data rather than from individual data values? a. as much as possible since computations are easier b. only when individual data values are unavailable c. whenever computer packages for […]
CAL 658 Test 2
Exhibit 15-7 A regression model involving 4 independent variables and a sample of 15 periods resulted in the following sum of squares. SSR = 165 SSE = 60 Refer to Exhibit 15-7. The test statistic from the information provided is […]
CAL 112 Midterm 2
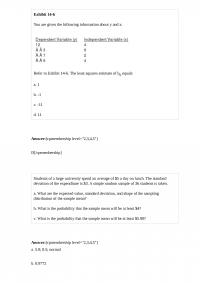
Exhibit 14-6 You are given the following information about y and x. Refer to Exhibit 14-6. The least squares estimate of b0 equals a. 1 b. -1 c. -11 d. 11 Students of a large university spend an average of […]
CAL 336 Midterm
The adjusted multiple coefficient of determination is adjusted for a. the number of dependent variables b. the number of independent variables c. the number of equations d. detrimental situations As the number of degrees of freedom for a t distribution […]
MATH 277 Test 1
Prior probabilities are the probabilities of the states of nature a. after obtaining sample information b. prior to obtaining of perfect information c. prior to obtaining sample information d. after obtaining perfect information You are given the following results from […]
MATH 760 Final
A regression model relating the yearly income (y), age (x1), and the gender of the faculty member of a university (x2 = 1 if female and 0 if male) resulted in the following information. = 5,000 + 1.2×1 + 0.9×2 […]
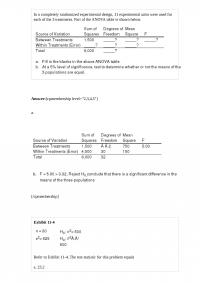
CAL 656 Quiz 1
In a completely randomized experimental design, 11 experimental units were used for each of the 3 treatments. Part of the ANOVA table is shown below. Exhibit 11-4 Refer to Exhibit 11-4. The test statistic for this problem equals a. 23.2 […]
CAL 488
If the calculated lower-control limit of a p chart is negative, a. a mistake has been made in the calculations b. use the absolute value of the lower limit c. it is set to zero d. None of the other […]
MATH 691
A random sample of 25 statistics examinations was taken. The average score in the sample was 76 with a variance of 144. Assuming the scores are normally distributed, the 99% confidence interval for the population average examination score is a. […]
MATH 181 Quiz 2
It is known that the variance of a population equals 1,936. A random sample of 121 has been taken from the population. There is a .95 probability that the sample mean will provide a margin of error of a. 7.84 […]
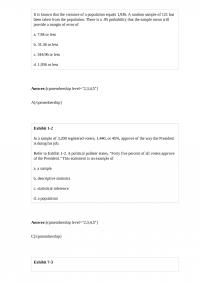
MATH 147
41. Exhibit 12-6 The following shows the number of individuals in a sample of 300 who indicated they support the new tax proposal. We are interested in determining whether or not the opinions of the individuals of the three groups […]
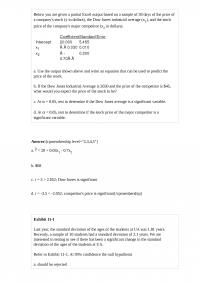
CAL 473 Test 1
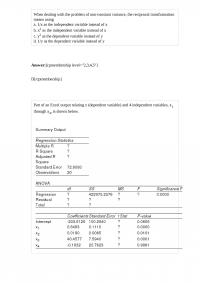
Below you are given a partial Excel output based on a sample of 30 days of the price of a company’s stock (y in dollars), the Dow Jones industrial average (x1), and the stock price of the company’s major competitor […]
CAL 153 Test
Exhibit 16-3 Below you are given a partial Excel output based on a sample of 25 observations. Refer to Exhibit 16-3. We want to test whether the parameter 2 is significant. The test statistic equals a. 4 b. 5 c. […]
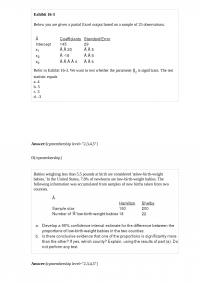
MATH 534 Midterm 2
Exhibit 10-1 Salary information regarding male and female employees of a large company is shown below. Refer to Exhibit 10-1. If you are interested in testing whether or not the average salary of males is significantly greater than that of […]
MATH 180
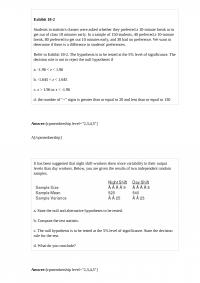
Exhibit 18-2 Students in statistics classes were asked whether they preferred a 10-minute break or to get out of class 10 minutes early. In a sample of 150 students, 40 preferred a 10-minute break, 80 preferred to get out 10 […]