Archives: Solution Manual
978-0132109178 Chapter 2 Solution Manual Part 1
2-1 2-1 A cost object is anything for which a separate measurement of costs is desired. Examples include a product, a service, a project, a customer, a brand category, an activity, and a department. 2-2 Direct costs of a cost […]
978-0132109178 Chapter 19 Solution Manual Part 5
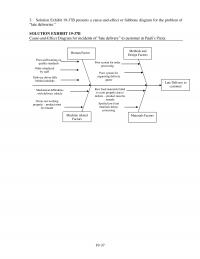
19-37 3. Solution Exhibit 19-37B presents a cause-and-effect or fishbone diagram for the problem of “late deliveries.” SOLUTION EXHIBIT 19-37B Cause-and-Effect Diagram for incidents of “late delivery” to customer at Pauli’s Pizza: Methods and Machine related Factors Materials Factors Human […]
978-0132109178 Chapter 19 Solution Manual Part 4
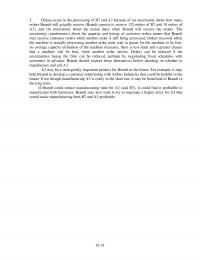
19-31 3. Delays occur in the processing of B7 and A3 because of (a) uncertainty about how many orders Brandt will actually receive (Brandt expects to receive 125 orders of B7 and 10 orders of A3), and (b) uncertainty about […]
978-0132109178 Chapter 19 Solution Manual Part 3
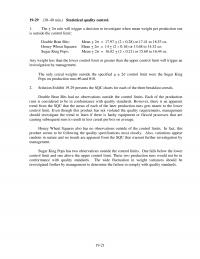
19-21 19-29 (30–40 min.) Statistical quality control. 1. The + 2 rule will trigger a decision to investigate when mean weight per production run is outside the control limit: Double Bran Bits: Mean + 2 = 17.97 + (2 […]
978-0132109178 Chapter 19 Solution Manual Part 2
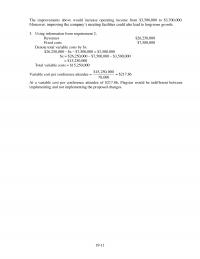
19-11 3. Using information from requirement 2, Revenues $26,250,000 Fixed costs $7,500,000 Denote total variable costs by $x $26,250,000 – $x – $7,500,000 = $3,500,000 $x = $26,250,000 – $7,500,000 – $3,500,000 = $15,250,000 Total variable costs = $15,250,000 Variable […]
978-0132109178 Chapter 19 Solution Manual
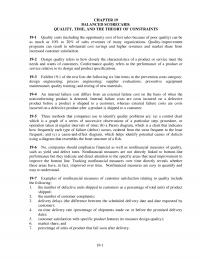
19-1 CHAPTER 19 19-1 Quality costs (including the opportunity cost of lost sales because of poor quality) can be as much as 10% to 20% of sales revenues of many organizations. Quality-improvement programs can result in substantial cost savings and […]
978-0132109178 Chapter 18 Solution Manual Part 4
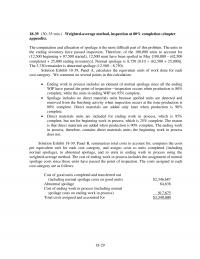
18-29 18-39 (30−35 min.) Weighted-average method, inspection at 80% completion (chapter appendix). The computation and allocation of spoilage is the most difficult part of this problem. The units in the ending inventory have passed inspection. Therefore, of the 100,000 units […]
978-0132109178 Chapter 18 Solution Manual Part 3
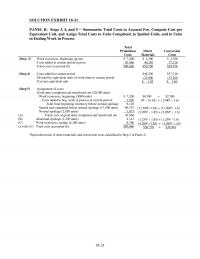
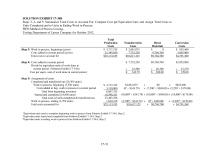
18-21 SOLUTION EXHIBIT 18-31 PANEL B: Steps 3, 4, and 5— Summarize Total Costs to Account For, Compute Cost per Equivalent Unit, and Assign Total Costs to Units Completed, to Spoiled Units, and to Units in Ending Work in Process […]
978-0132109178 Chapter 18 Solution Manual Part 2
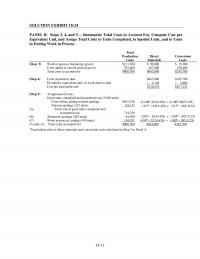
18-11 SOLUTION EXHIBIT 18-24 PANEL B: Steps 3, 4, and 5— Summarize Total Costs to Account For, Compute Cost per Equivalent Unit, and Assign Total Costs to Units Completed, to Spoiled Units, and to Units in Ending Work in Process […]
978-0132109178 Chapter 18 Solution Manual
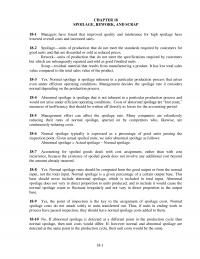
18-1 18-1 Managers have found that improved quality and intolerance for high spoilage have lowered overall costs and increased sales. 18-2 Spoilage—units of production that do not meet the standards required by customers for good units and that are discarded […]
978-0132109178 Chapter 17 Solution Manual Part 5
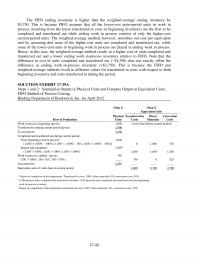
17-40 The FIFO ending inventory is higher than the weighted-average ending inventory by $3,750. This is because FIFO assumes that all the lower-cost prior-period units in work in process (resulting from the lower transferred-in costs in beginning inventory) are the […]
978-0132109178 Chapter 17 Solution Manual Part 4
17-31 SOLUTION EXHIBIT 17-34B Steps 3, 4, and 5: Summarize Total Costs to Account For, Compute Cost per Equivalent Unit, and Assign Total Costs to Units Completed and to Units in Ending Work in Process; FIFO Method of Process Costing, […]
978-0132109178 Chapter 17 Solution Manual Part 3
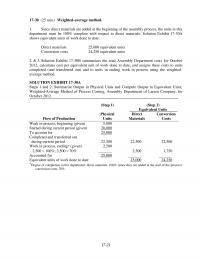
17-21 17-30 (25 min.) Weighted-average method. 1. Since direct materials are added at the beginning of the assembly process, the units in this department must be 100% complete with respect to direct materials. Solution Exhibit 17-30A 2. & 3. Solution […]
978-0132109178 Chapter 17 Solution Manual Part 2
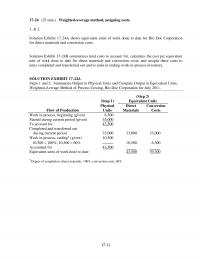
17-11 17-24 (25 min.) Weighted-average method, assigning costs. 1. & 2. Solution Exhibit 17-24A shows equivalent units of work done to date for Bio Doc Corporation for direct materials and conversion costs. Solution Exhibit 17-24B summarizes total costs to account […]
978-0132109178 Chapter 17 Solution Manual
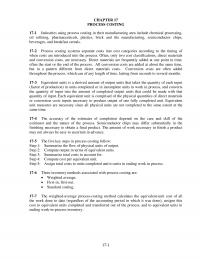
17-1 CHAPTER 17 PROCESS COSTING 17-1 Industries using process costing in their manufacturing area include chemical processing, 17-2 Process costing systems separate costs into cost categories according to the timing of when costs are introduced into the process. Often, only […]
978-0132109178 Chapter 16 Solution Manual Part 5
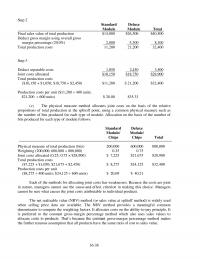
16-38 Step 2 Standard Deluxe Module Module Total Final sales value of total production $14,000 $26,500 $40,500 Deduct gross margin using overall gross margin percentage (20.0%) 2,800 5,300 8,100 bits produced for each type of module follows: Standard Deluxe Module/ […]
978-0132109178 Chapter 16 Solution Manual Part 4
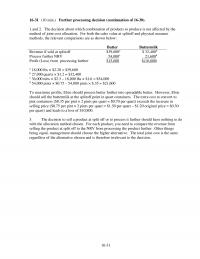
16-31 16-31 (10 min.) Further processing decision (continuation of 16-30). 1.and 2. The decision about which combination of products to produce is not affected by the method of joint cost allocation. For both the sales value at splitoff and physical […]
978-0132109178 Chapter 16 Solution Manual Part 3
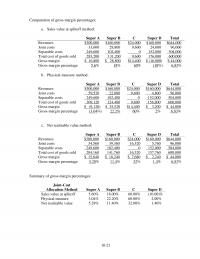
Computation of gross-margin percentages: a. Sales value at splitoff method: Super A Super B C Super D Total Revenues $300,000 $160,000 $24,000 $160,000 $644,000 Joint costs 33,600 28,800 9,600 24,000 96,000 Separable costs 249,600 102,400 0 152,000 504,000 Total cost […]
978-0132109178 Chapter 16 Solution Manual Part 2
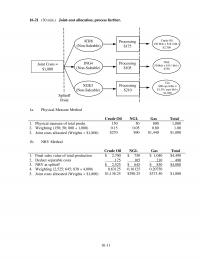
16-11 16-21 (30 min.) Joint-cost allocation, process further. Joint Costs = $1800 ICR8 (Non-Saleable) ING4 (Non-Saleable) XGE3 (Non-Saleable) Processing $175 Processing $210 Processing $105 Crude Oil 150 bbls × $18 / bbl = $2700 NGL 50 bbls × $15 / […]
978-0132109178 Chapter 16 Solution Manual
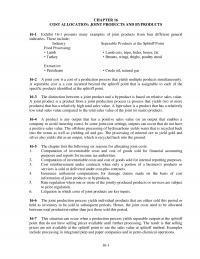
16-1 16-1 Exhibit 16-1 presents many examples of joint products from four different general industries. These include: Industry Separable Products at the Splitoff Point Food Processing: • Lamb • Lamb cuts, tripe, hides, bones, fat • Turkey • Breasts, wings, […]
978-0132109178 Chapter 15 Solution Manual Part 4
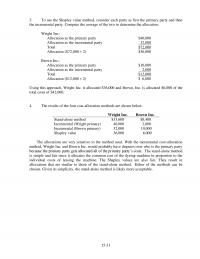
15-31 3. To use the Shapley value method, consider each party as first the primary party and then the incremental party. Compute the average of the two to determine the allocation. Wright Inc.: Allocation as the primary party $40,000 4. […]
978-0132109178 Chapter 15 Solution Manual Part 3
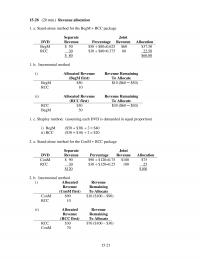
15-28 (20 min.) Revenue allocation 1. a. Stand-alone method for the BegM + RCC package DVD Separate Revenue Percentage Joint Revenue Allocation BegM $ 50 $50 ÷ $80=0.625 $60 $37.50 RCC 30 $30 ÷ $80=0.375 60 22.50 $ 80 $60.00 […]
978-0132109178 Chapter 15 Solution Manual Part 2
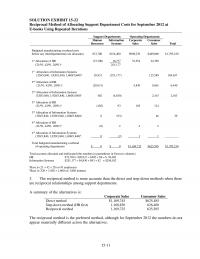
15-11 SOLUTION EXHIBIT 15-22 Reciprocal Method of Allocating Support Department Costs for September 2012 at E-books Using Repeated Iterations Support Departments Operating Departments Human Resources Information Systems Corporate Sales Consumer Sales Total Budgeted manufacturing overhead costs before any interdepartmental cost […]
978-0132109178 Chapter 15 Solution Manual
15-1 CHAPTER 15 15-1 The single-rate (cost-allocation) method makes no distinction between fixed costs and variable costs in the cost pool. It allocates costs in each cost pool to cost objects using the same rate per unit of the single […]
978-0132109178 Chapter 14 Solution Manual Part 6
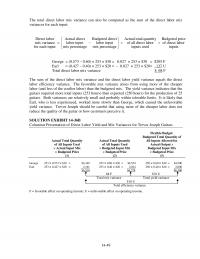
The total direct labor mix variance can also be computed as the sum of the direct labor mix variances for each input: Direct labor mix variance for each input = Actual direct labor input mix percentage […]
978-0132109178 Chapter 14 Solution Manual Part 5
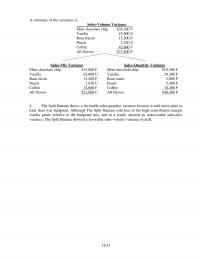
A summary of the variances is: Sales-Volume Variance Mint chocolate chip $24,360 F Vanilla 43,500 U 14-41 Rum Raisin 15,200 F Peach 2,520 U Coffee 43,860 F All flavors $37,400 F Sales-Mix Variance Mint chocolate chip $13,860 F Vanilla 63,800 […]
978-0132109178 Chapter 14 Solution Manual Part 4
14-31 3. Dropping customers should be the last resort taken by Spring Distribution. Factors to consider include the following: a. What is the expected future profitability of each customer? Are the currently month? unprofitable (T) or low-profit (P) customers likely […]
978-0132109178 Chapter 14 Solution Manual Part 3
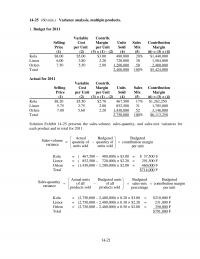
14-21 14-25 (60 min.) Variance analysis, multiple products. 1. Budget for 2011 Orlem 7.50 5.50 2.00 1,200,000 50 2,400,000 Total 2,400,000 100% $5,424,000 Actual for 2011 Variable Contrib. Selling Cost Margin Units Sales Contribution Price per Unit per Unit Sold […]
978-0132109178 Chapter 14 Solution Manual Part 2
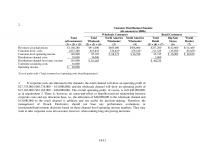
14-11 2. Customer Distribution Channels (all amounts in $000s) Wholesale Customers Retail Customers Total Total North America South America Total Big Sam World (all customers) Wholesale Wholesaler Wholesaler Retail Stereo Market (1) = (2) + (5) (2) = (3) + […]
978-0132109178 Chapter 14 Solution Manual
14-1 CHAPTER 14 14-1 Disagree. Cost accounting data plays a key role in many management planning and control decisions. The division president will be able to make better operating and strategy decisions by being involved in key decisions about cost […]
978-0132109178 Chapter 13 Solution Manual Part 4
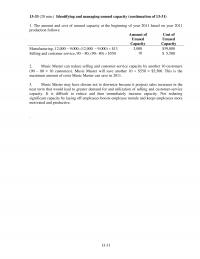
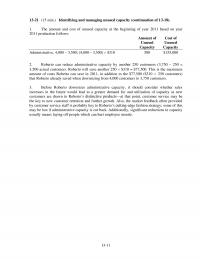
13-33 (20 min.) Identifying and managing unused capacity (continuation of 13-31) 1. The amount and cost of unused capacity at the beginning of year 2011 based on year 2011 13-31 production follows: Amount of Cost of Unused Unused Capacity Capacity […]
978-0132109178 Chapter 13 Solution Manual Part 3
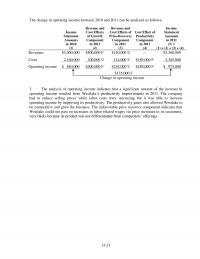
The change in operating income between 2010 and 2011 can be analyzed as follows: Income Statement Amounts in 2010 (1) Revenue and Cost Effects of Growth Component in 2011 (2) Revenue and Cost Effects of Price-Recovery Component in 2011 (3) […]
978-0132109178 Chapter 13 Solution Manual Part 2
13-11 1. The amount and cost of unused capacity at the beginning of year 2011 based on year 2011 production follows: Amount of Cost of Unused Unused Capacity Capacity Administrative, 4,000 − 3,500; (4,000 – 3,500) $310 500 $155,000 […]
978-0132109178 Chapter 13 Solution Manual
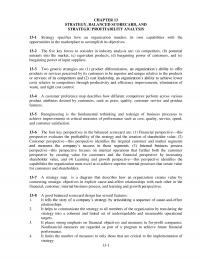
13-1 CHAPTER 13 13-1 Strategy specifies how an organization matches its own capabilities with the opportunities in the marketplace to accomplish its objectives. 13-2 The five key forces to consider in industry analysis are: (a) competitors, (b) potential entrants into […]
978-0132109178 Chapter 12 Solution Manual Part 3
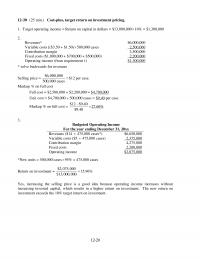
12-20 12-30 (25 min.) Cost-plus, target return on investment pricing. 2. Revenues* $6,000,000 Variable costs [($3.50 + $1.50) 500,000 cases 2,500,000 Contribution margin 3,500,000 Fixed costs ($1,000,000 + $700,000 + $500,000) 2,200,000 Operating income (from requirement 1) $1,300,000 * […]
978-0132109178 Chapter 12 Solution Manual Part 2
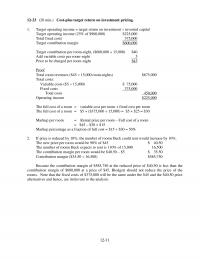
12-11 1. Target operating income = target return on investment invested capital Target operating income (25% of $900,000) $225,000 Total fixed costs 375,000 Target contribution margin $600,000 Target contribution per room-night, ($600,000 ÷ 15,000) $40 Add variable costs per […]
978-0132109178 Chapter 12 Solution Manual
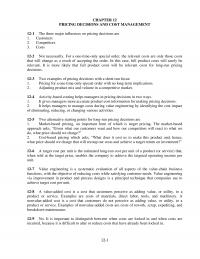
12-1 CHAPTER 12 PRICING DECISIONS AND COST MANAGEMENT 1. Customers 2. Competitors 3. Costs 12-2 Not necessarily. For a one-time–only special order, the relevant costs are only those costs that will change as a result of accepting the order. In […]
978-0132109178 Chapter 11 Solution Manual Part 4
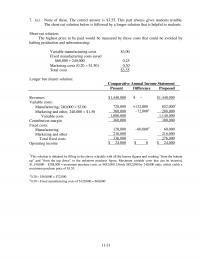
7. (e) None of these. The correct answer is $3.55. This part always gives students trouble. The short-cut solution below is followed by a longer solution that is helpful to students. Short-cut solution: The highest price to be paid would […]
978-0132109178 Chapter 11 Solution Manual Part 3
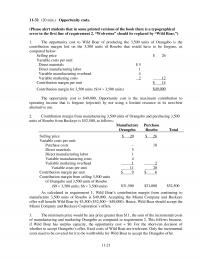
11-32 (20 min.) Opportunity costs. (Please alert students that in some printed versions of the book there is a typographical error in the first line of requirement 2. “Wolverine” should be replaced by “Wild Boar.”) 1. The opportunity cost to […]
978-0132109178 Chapter 11 Solution Manual Part 2
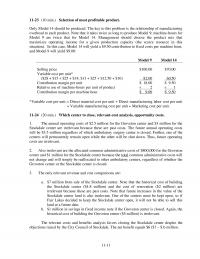
11-11 11-23 (10 min.) Selection of most profitable product. Only Model 14 should be produced. The key to this problem is the relationship of manufacturing overhead to each product. Note that it takes twice as long to produce Model 9; […]
978-0132109178 Chapter 11 Solution Manual
11-1 CHAPTER 11 DECISION MAKING AND RELEVANT INFORMATION 1. Identify the problem and uncertainties 2. Obtain information 3. Make predictions about the future 4. Make decisions by choosing among alternatives 5. Implement the decision, evaluate performance, and learn 11-2 Relevant […]
978-0132109178 Chapter 10 Solution Manual Part 5
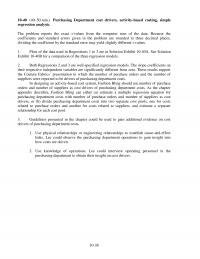
10-38 10-40 (40–50 min.) Purchasing Department cost drivers, activity-based costing, simple regression analysis. 1. Plots of the data used in Regressions 1 to 3 are in Solution Exhibit 10-40A. See Solution Exhibit 10-40B for a comparison of the three regression […]
978-0132109178 Chapter 10 Solution Manual Part 4
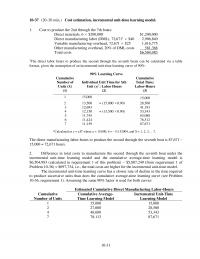
10-37 (20–30 min.) Cost estimation, incremental unit-time learning model. 1. Cost to produce the 2nd through the 7th boats: Direct materials, 6 $200,000 $1,200,000 Direct manufacturing labor (DML), 72,6711 $40 2,906,840 Variable manufacturing overhead, 72,671 $25 1,816,775 […]
978-0132109178 Chapter 10 Solution Manual Part 3
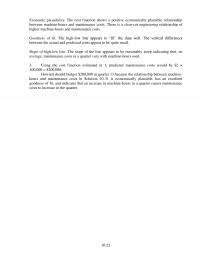
10-21 Economic plausibility. The cost function shows a positive economically plausible relationship between machine-hours and maintenance costs. There is a clear-cut engineering relationship of 3. Using the cost function estimated in 1, predicted maintenance costs would be $2 × 100,000 […]
978-0132109178 Chapter 10 Solution Manual Part 2
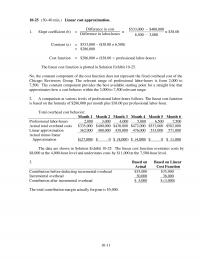
10-11 1. Slope coefficient (b) = Difference in cost Difference in labor-hours = $533,000 $400,000 6,500 3,000 − − = $38.00 Constant (a) = $533,000 – ($38.00 × 6,500) = $286,000 Cost function = $286,000 + ($38.00 professional labor-hours) […]
978-0132109178 Chapter 10 Solution Manual
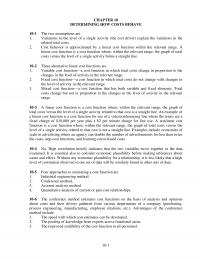
10-1 CHAPTER 10 DETERMINING HOW COSTS BEHAVE 1. Variations in the level of a single activity (the cost driver) explain the variations in the related total costs. 2. Cost behavior is approximated by a linear cost function within the relevant […]
978-0132109178 Chapter 1 Solution Manual Part 2
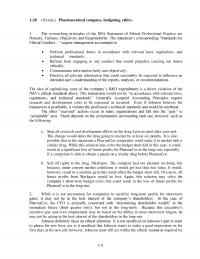
1-9 1-28 (30 min.) Pharmaceutical company, budgeting, ethics. 1. The overarching principles of the IMA Statement of Ethical Professional Practice are Honesty, Fairness, Objectivity and Responsibility. The statement’s corresponding “Standards for Ethical Conduct…” require management accountants to • Perform professional […]
978-0132109178 Chapter 1 Solution Manual Part 1
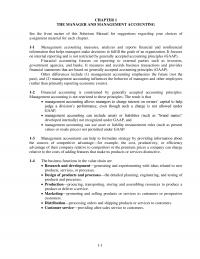
1-1 CHAPTER 1 THE MANAGER AND MANAGEMENT ACCOUNTING See the front matter of this Solutions Manual for suggestions regarding your choices of assignment material for each chapter. 1-1 Management accounting measures, analyzes and reports financial and nonfinancial information that helps […]
978-0078034800 Chapter 9 Part 3
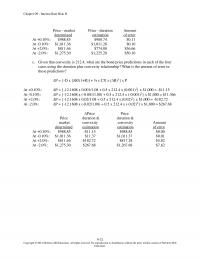
Chapter 09 – Interest Rate Risk II 9-32 Education. Price – market Price – duration Amount determined estimation of error At +0.10%: $988.85 $988.74 $0.11 At -0.10%: $1,011.36 $1,011.26 $0.10 At +2.0%: $811.46 $774.80 $36.66 At -2.0%: $1,275.30 $1,225.20 $50.10 […]
978-0078034800 Chapter 9 Part 2
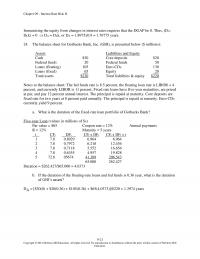
Chapter 09 – Interest Rate Risk II 9-21 Education. Immunizing the equity from changes in interest rates requires that the DGAP be 0. Thus, (DA– DLk) = 0 DA = DLk, or DA = 1.8975×0.9 = 1.70775 years. 24. […]