2-1
2-1 A cost object is anything for which a separate measurement of costs is desired. Examples
2-2 Direct costs of a cost object are related to the particular cost object and can be traced to
that cost object in an economically feasible (cost-effective) way.
2-3 Managers believe that direct costs that are traced to a particular cost object are more
2-4 Factors affecting the classification of a cost as direct or indirect include
2-5 A variable cost changes in total in proportion to changes in the related level of total
activity or volume. An example is a sales commission that is a percentage of each sales revenue
dollar.
2-6 A cost driver is a variable, such as the level of activity or volume, that causally affects
2-7 The relevant range is the band of normal activity level or volume in which there is a
2-8 A unit cost is computed by dividing some amount of total costs (the numerator) by the
related number of units (the denominator). In many cases, the numerator will include a fixed cost
2-2
2-9 Manufacturing-sector companies purchase materials and Ashtonnents and convert them
into various finished goods, for example automotive and textile companies.
1. Direct materials inventory. Direct materials in stock and awaiting use in the
manufacturing process.
3. Finished goods inventory. Goods completed but not yet sold.
2-11 Inventoriable costs are all costs of a product that are considered as assets in the balance
sheet when they are incurred and that become cost of goods sold when the product is sold. These
2-12 Direct material costs are the acquisition costs of all materials that eventually become part
of the cost object (work in process and then finished goods), and can be traced to the cost object
in an economically feasible way.
2-13 Overtime premium is the wage rate paid to workers (for both direct labor and indirect
labor) in excess of their straight-time wage rates.
2-14 A product cost is the sum of the costs assigned to a product for a specific purpose.
Purposes for computing a product cost include
2-3
2-15 Three common features of cost accounting and cost management are:
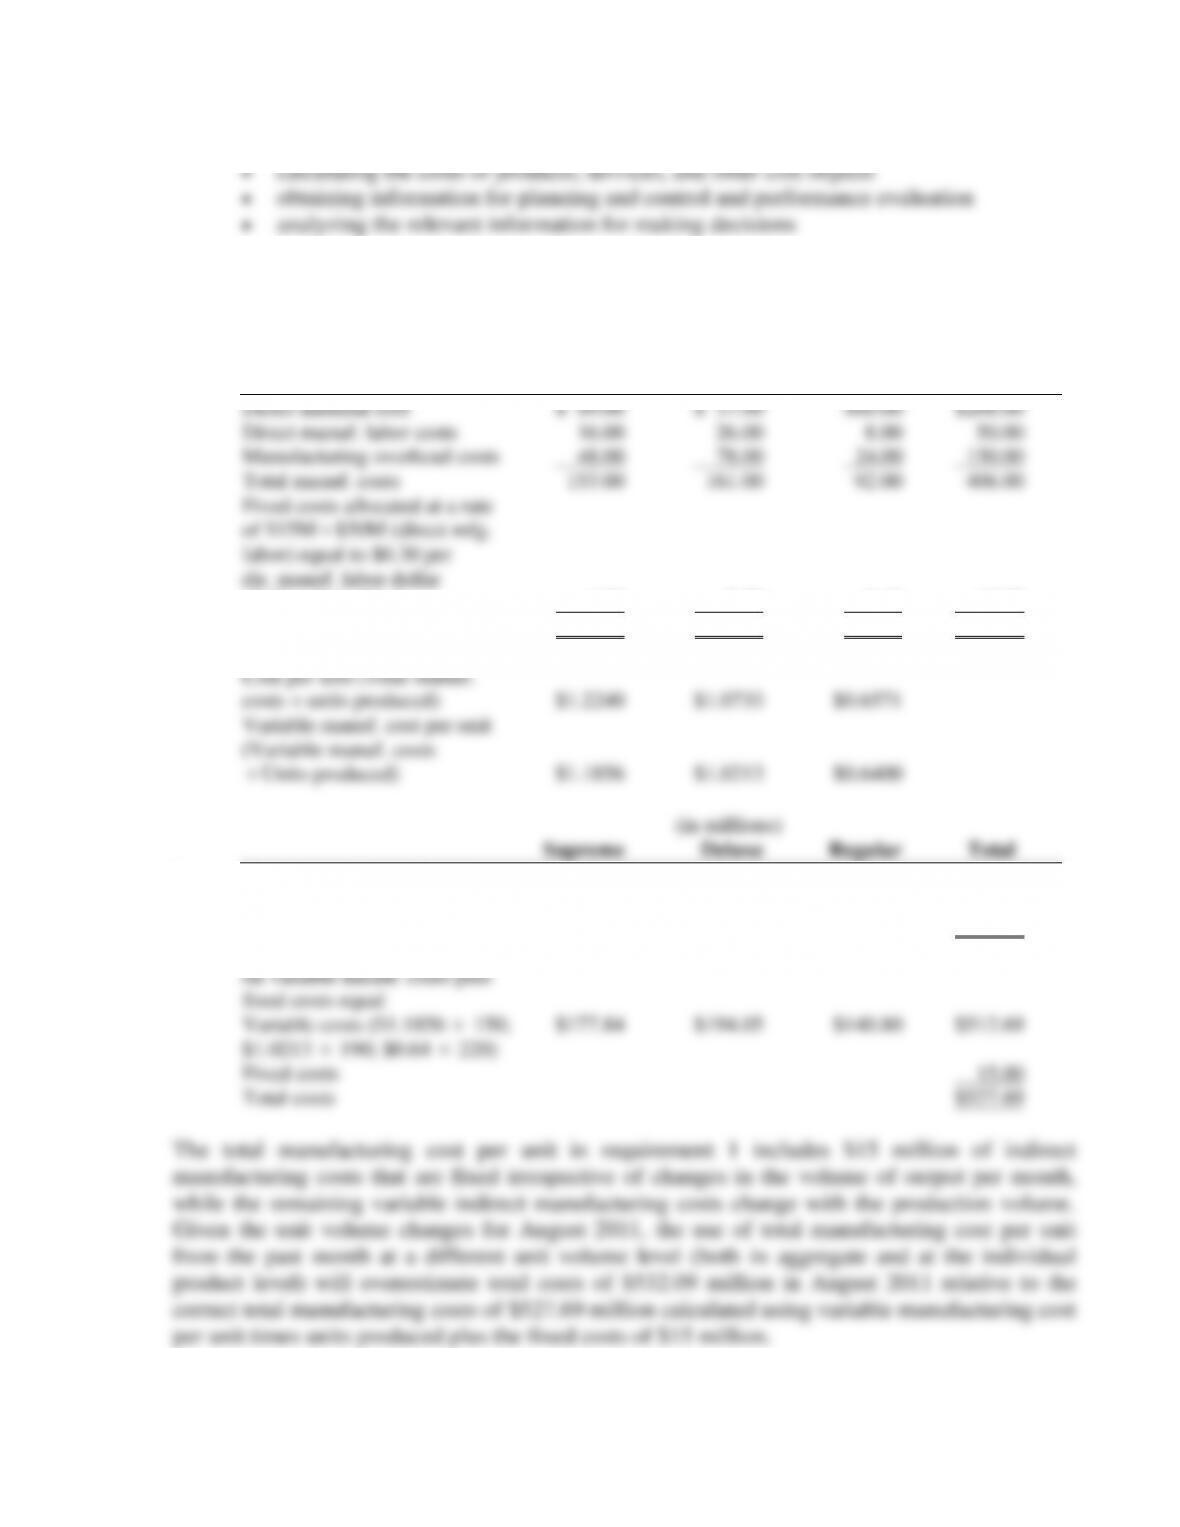
2-16 (15 min.) Computing and interpreting manufacturing unit costs.
1.
(in millions)
Supreme Deluxe Regular Total
(0.30
$16; 26; 8) 4.80 7.80 2.40 15.00
Variable costs $148.20 $153.20 $89.60 $391.00
Units produced (millions) 125 150 140
2. Based on total manuf. cost
per unit ($1.2240
150;
$1.0733
190; $0.6571
220) $183.60 $203.93 $144.56 $532.09
Correct total manuf. costs based
2-4
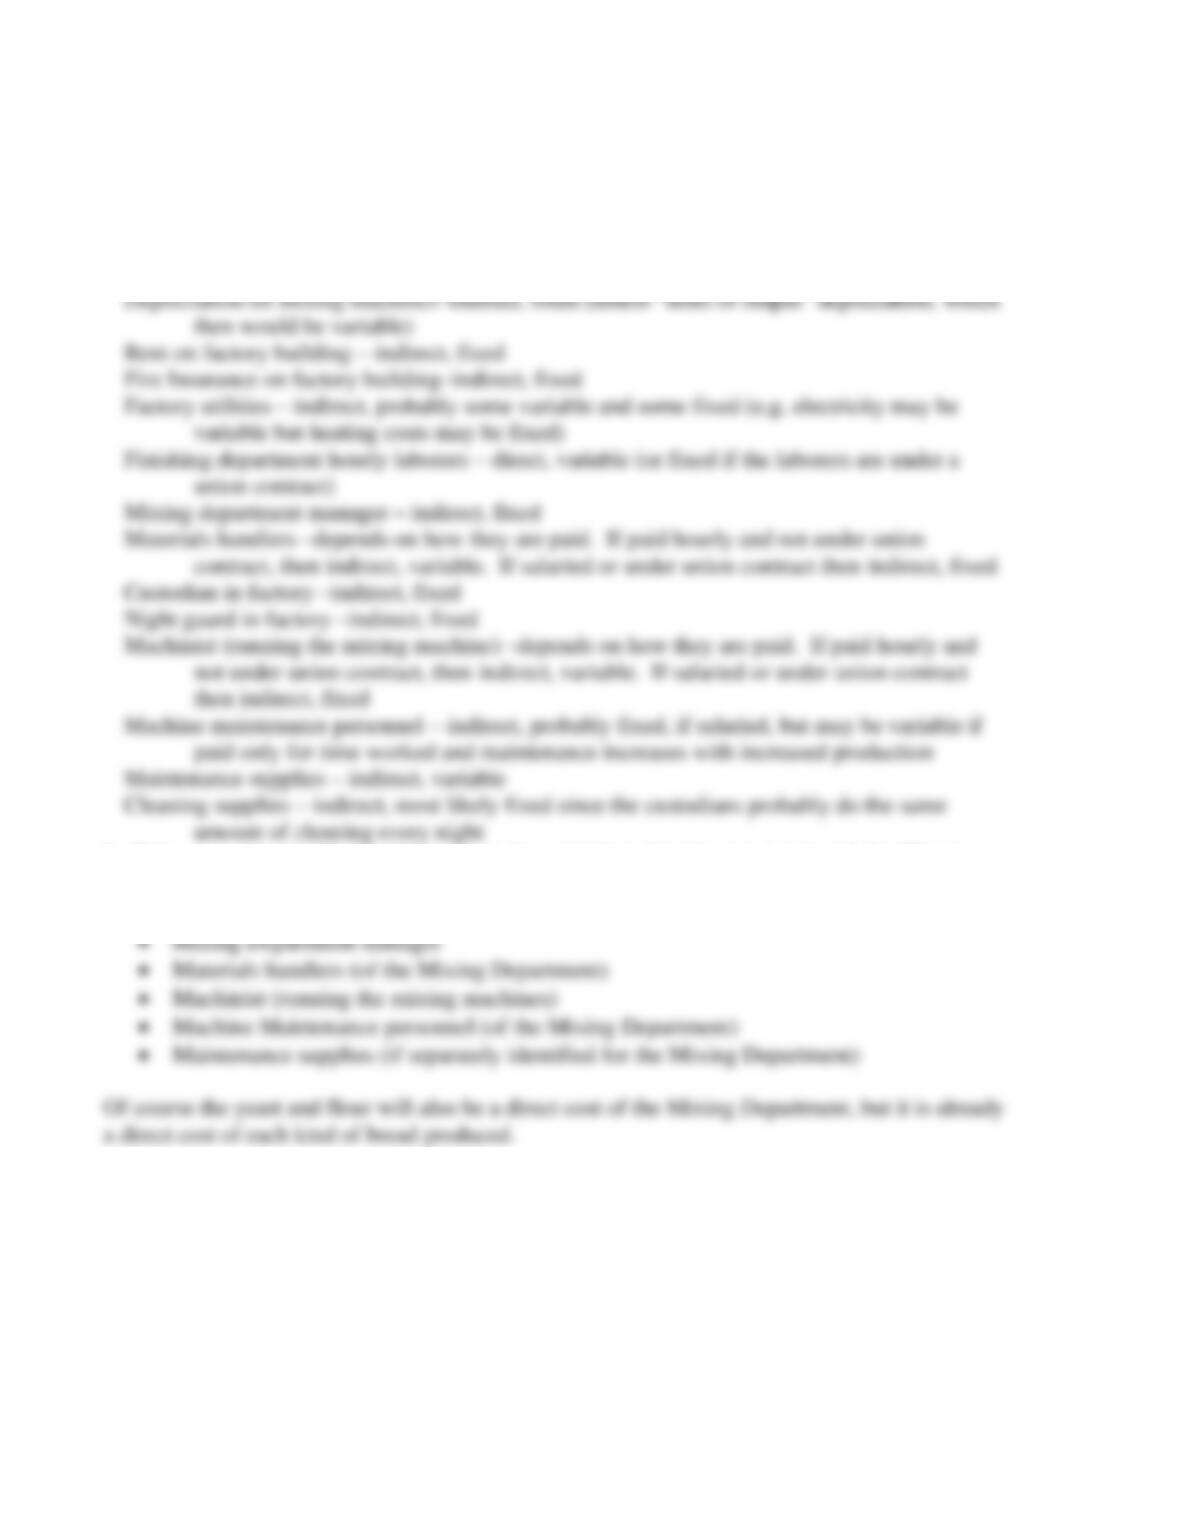
2-17 (15 min.) Direct, indirect, fixed and variable costs.
1. Yeast – direct, variable
Flour- direct, variable
Packaging materials –direct (or could be indirect if small and not traced to each unit), variable
Depreciation on ovens –indirect, fixed (unless “units of output” depreciation, which then
would be variable)
2. If the cost object is Mixing Department, then anything directly associated with the Mixing
Department will be a direct cost. This will include:
• Depreciation on mixing machines
2-18 (15–20 min.) Classification of costs, service sector.
Cost object: Each individual focus group
Cost variability: With respect to the number of focus groups
2-6
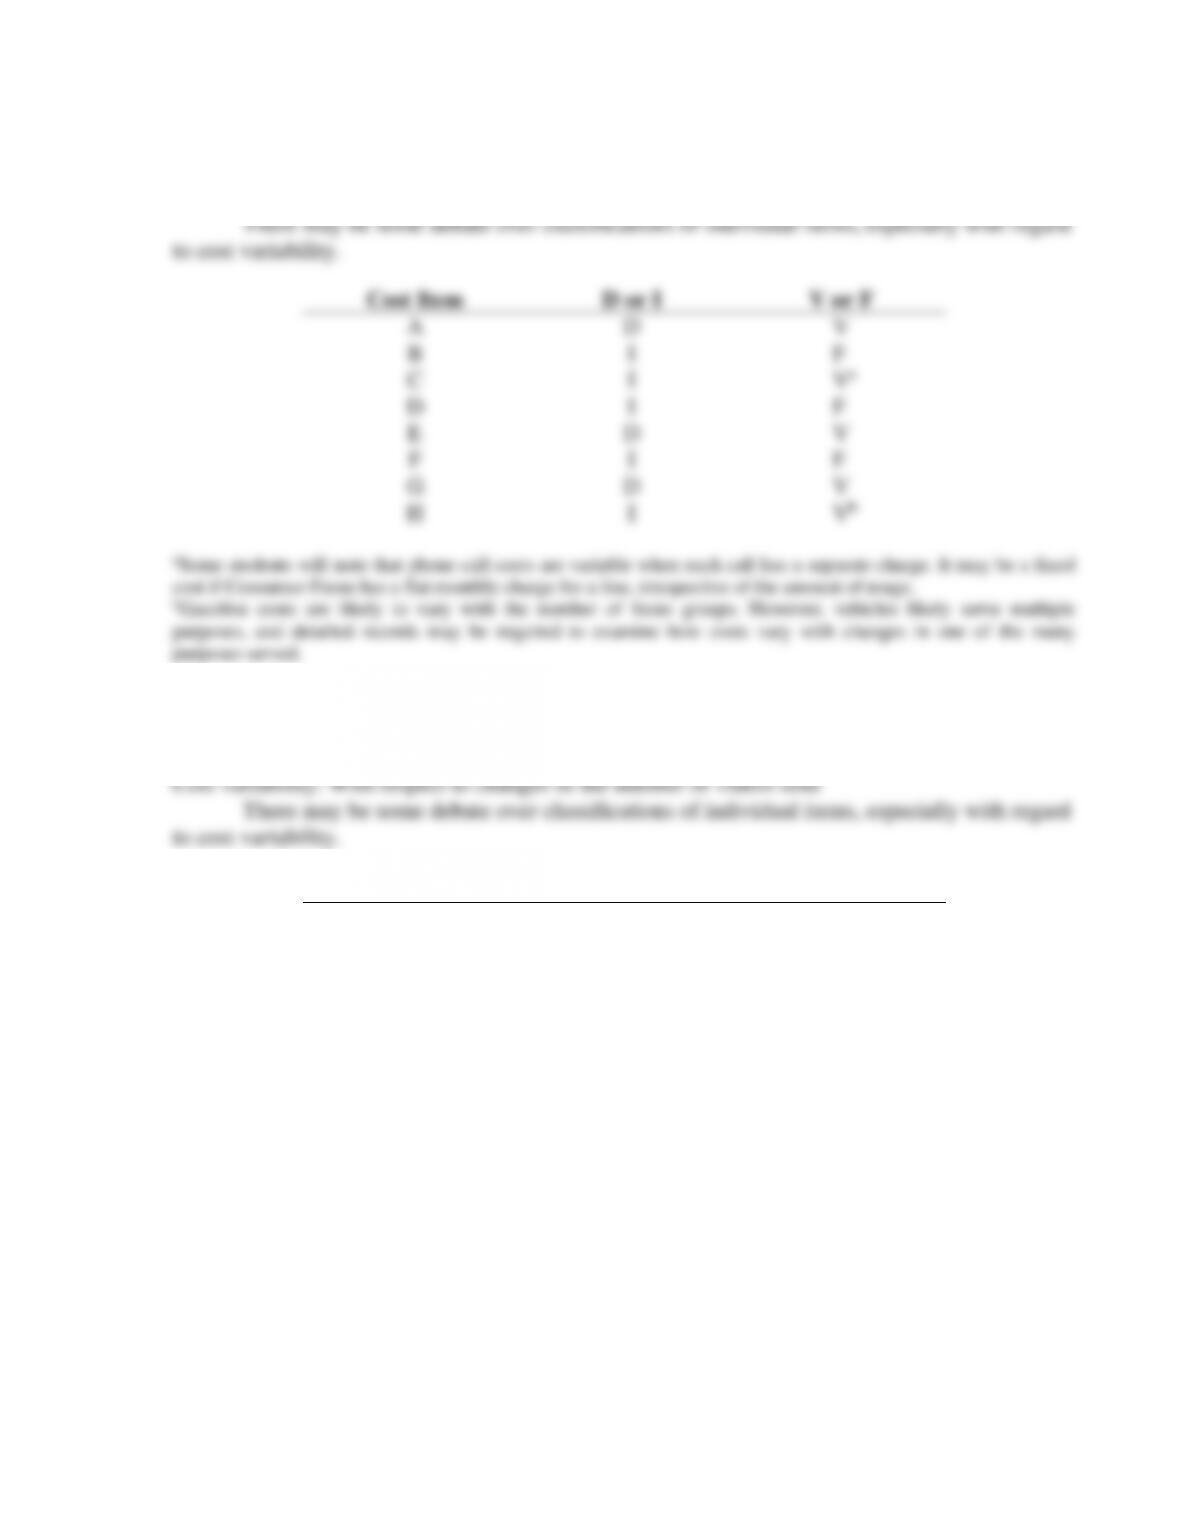
2-20 (15–20 min.) Classification of costs, manufacturing sector.
Cost object: Type of car assembled (Corolla or Geo Prism)
Cost Item
D or I
V or F
A
D
V
B
I
F
C
D
F
D
D
F
E
D
V
F
I
V
G
D
V
H
I
F
1.
Minutes/month
0
50
100
150
200
240
300
327.5
350
400
450
510
540
600
650
Plan A ($/month)
0
5
10
15
20
24
30
32.75
35
40
45
51
54
60
65
Plan B ($/month)
15
15
15
15
15
15
19.80
22
23.80
27.80
31.80
36.60
39
43.80
47.80
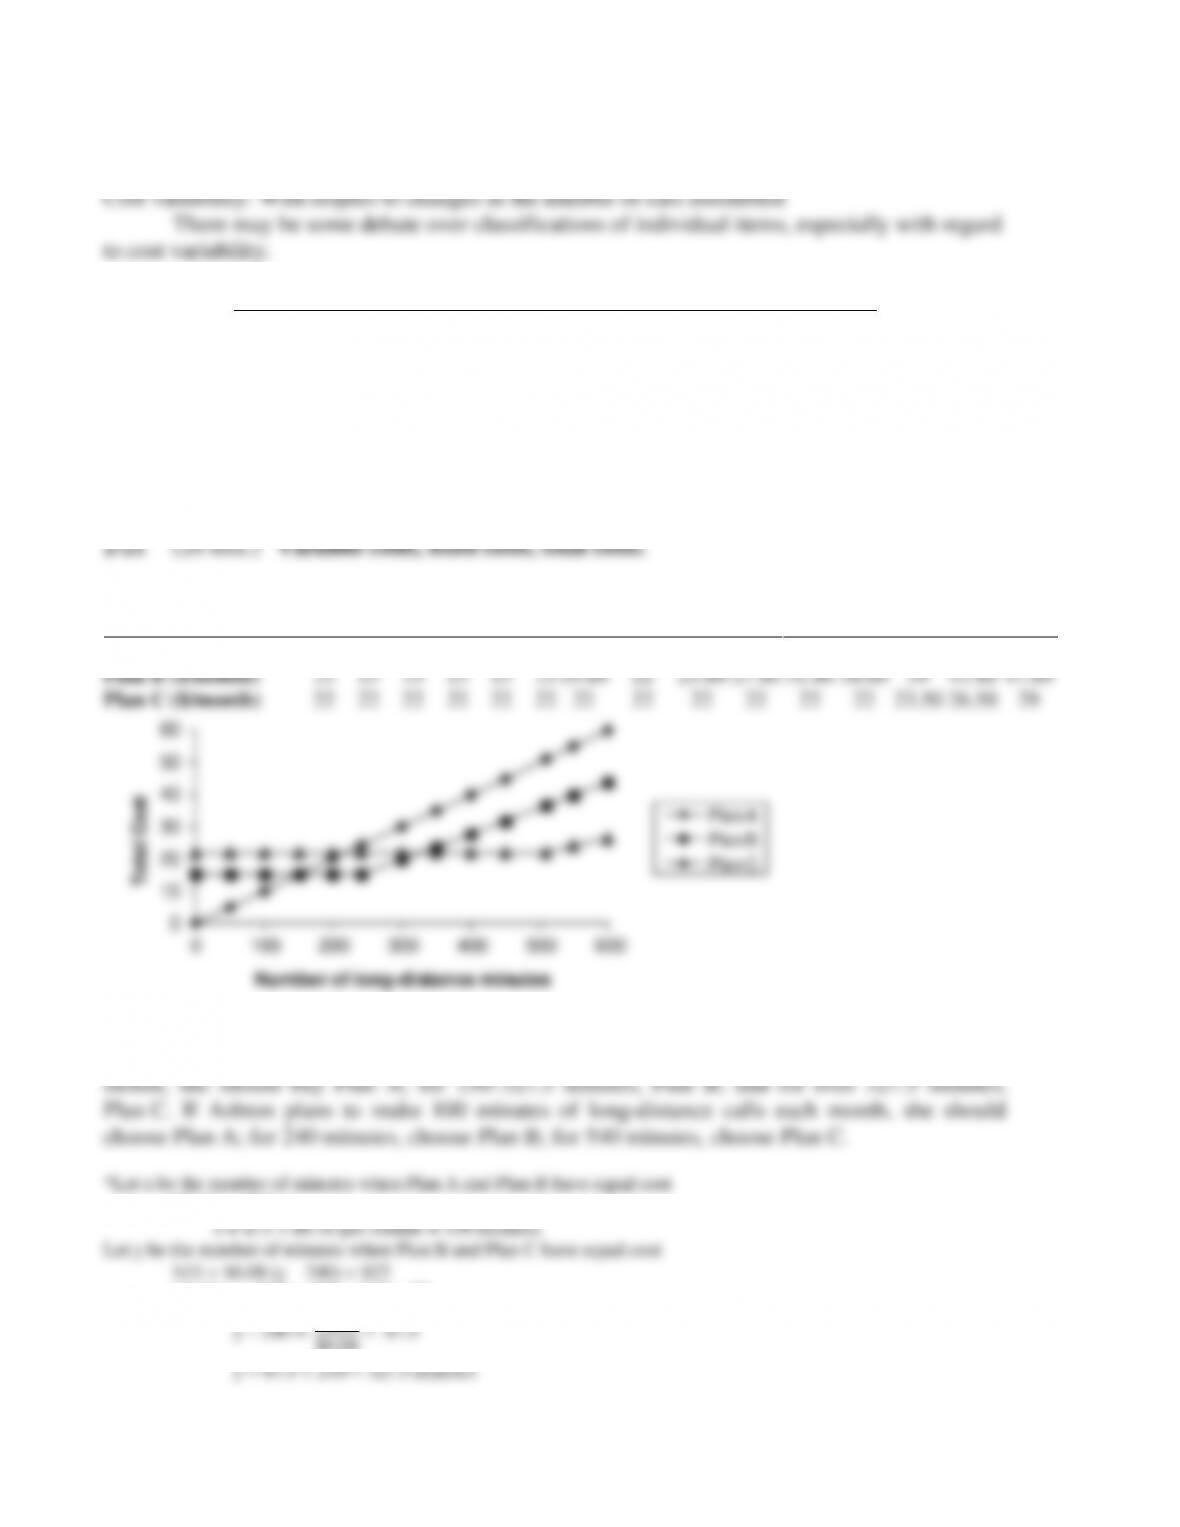
Plan C ($/month)
22
22
22
22
22
22
22
22
22
22
22
22
23.50
26.50
29
0
10
20
30
40
50
60
0100 200 300 400 500 600
Total Cost
Number of long-distance minutes
Plan A
Plan B
Plan C
2. In each region, Ashton chooses the plan that has the lowest cost. From the graph (or from
calculations)*, we can see that if Ashton expects to use 0–150 minutes of long-distance each
$0.10x = $15
$0.08 (y – 240) = $22 – $15 = $7
$7 87.5
2-7
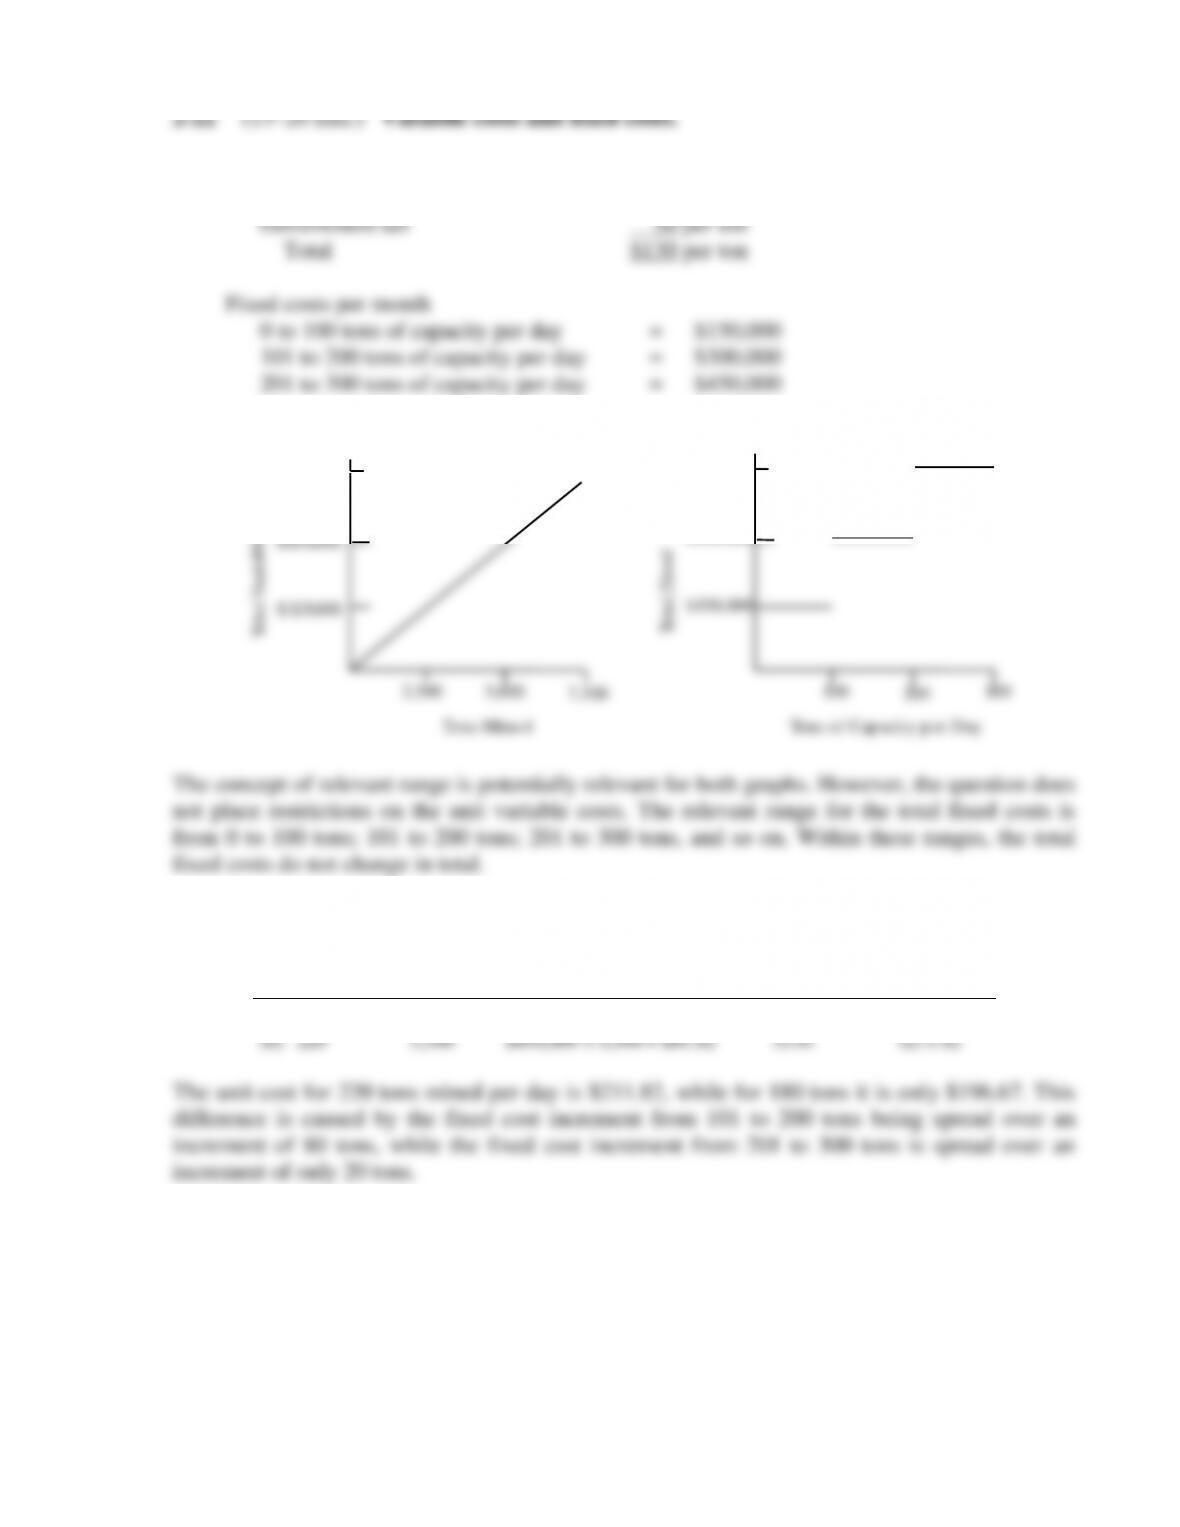
1. Variable cost per ton of beach sand mined
Subcontractor $ 80 per ton
2.
T
o
t
a
l
F
i
x
e
d
C
o
s
ts
$
4
5
0
,
0
0
0
$
3
0
0
,
0
0
0
$
1
5
0
,
0
0
0
1
0
0
2
0
0
3
0
0
T
o
n
s
o
f
C
a
p
a
c
i
t
y
p
e
r
D
a
y
$
9
7
5
,
0
0
0
$
6
5
0
,
0
0
0
$
3
2
5
,
0
0
0
2
,
5
0
0
5
,
0
0
0
7
,
5
0
0
T
o
n
s
M
i
n
e
d
T
o
t
a
l
V
a
r
i
a
b
l
e
C
o
s
ts
3.
Tons Mined
per Day
Tons Mined
per Month
Fixed Unit
Cost per Ton
Variable Unit
Cost per Ton
Total Unit
Cost per Ton
(1)
(2) = (1) × 25
(3) = FC ÷ (2)
(4)
(5) = (3) + (4)
(a) 180
4,500
$300,000 ÷ 4,500 = $66.67
$130
$196.67
(b) 220
5,500
$450,000 ÷ 5,500 = $81.82
$130
$211.82
The unit cost for 220 tons mined per day is $211.82, while for 180 tons it is only $196.67. This
difference is caused by the fixed cost increment from 101 to 200 tons being spread over an
increment of 80 tons, while the fixed cost increment from 201 to 300 tons is spread over an
increment of only 20 tons.
2-8
2-23 (20 min.) Variable costs, fixed costs, relevant range.
2. Current annual fixed manufacturing costs within the relevant range are $1,200 × 12 =
3. If demand changes from 3,800 to 7,600 jaw breakers per month, or from 3,800 × 12 =
45,600 to 7,600 × 12 = 91,200 jaw breakers per year, Sweetum will need a second machine.
Assuming Sweetum buys a second machine identical to the first machine, it will increase
capacity from 4,100 jaw breakers per month to 8,200. The annual relevant range will be between
2-9
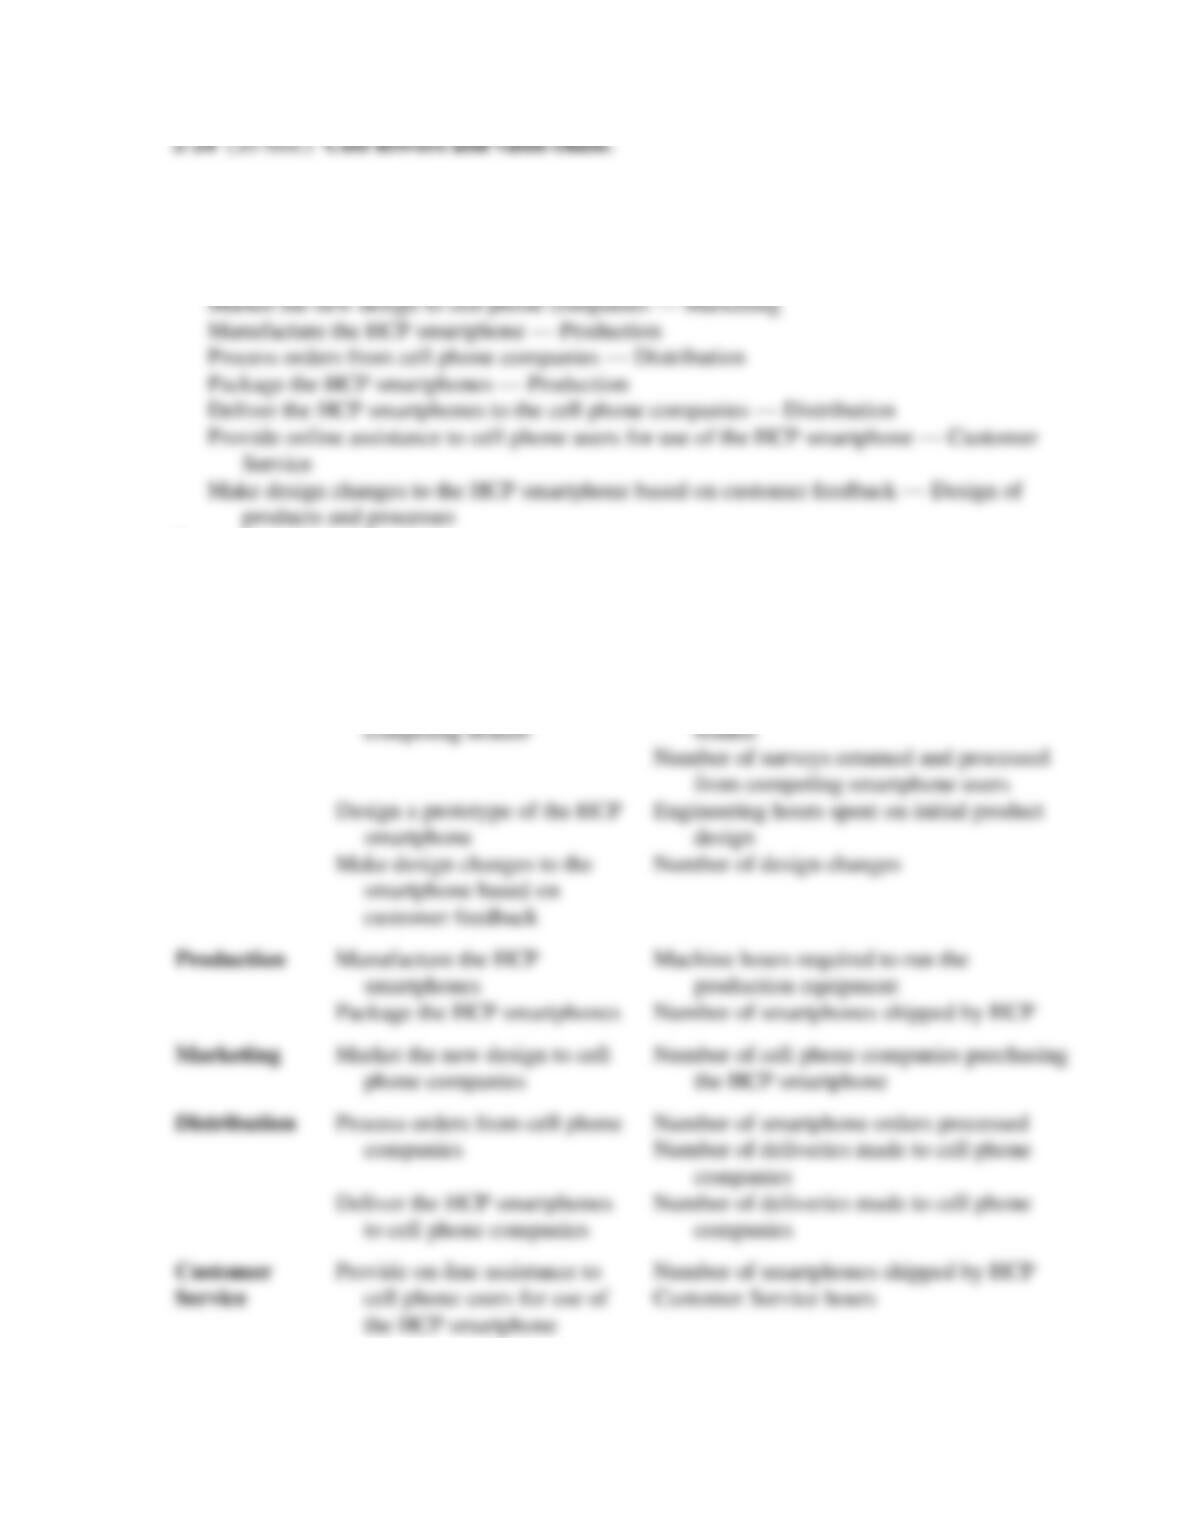
1. Identify customer needs (what do smartphone users want?) — Design of products and
processes
Perform market research on competing brands — Design of products and processes
Design a prototype of the HCP smartphone — Design of products and processes
2.
Value Chain
Category
Activity
Cost driver
Design of
products and
processes
Identify customer needs
Number of surveys returned and processed
from competing smartphone users
Perform market research on
competing brands
Hours spent researching competing market
brands
Number of surveys returned and processed
from competing smartphone users
Design a prototype of the HCP
smartphone
Engineering hours spent on initial product
design
Make design changes to the
smartphone based on
customer feedback
Number of design changes
Production
Manufacture the HCP
smartphones
Machine hours required to run the
production equipment
Package the HCP smartphones
Number of smartphones shipped by HCP
Marketing
Market the new design to cell
phone companies
Number of cell phone companies purchasing
the HCP smartphone
Distribution
Process orders from cell phone
companies
Number of smartphone orders processed
Number of deliveries made to cell phone
companies
Deliver the HCP smartphones
to cell phone companies
Number of deliveries made to cell phone
companies
Customer
Service
Provide on–line assistance to
cell phone users for use of
the HCP smartphone
Number of smartphones shipped by HCP
Customer Service hours
2-10
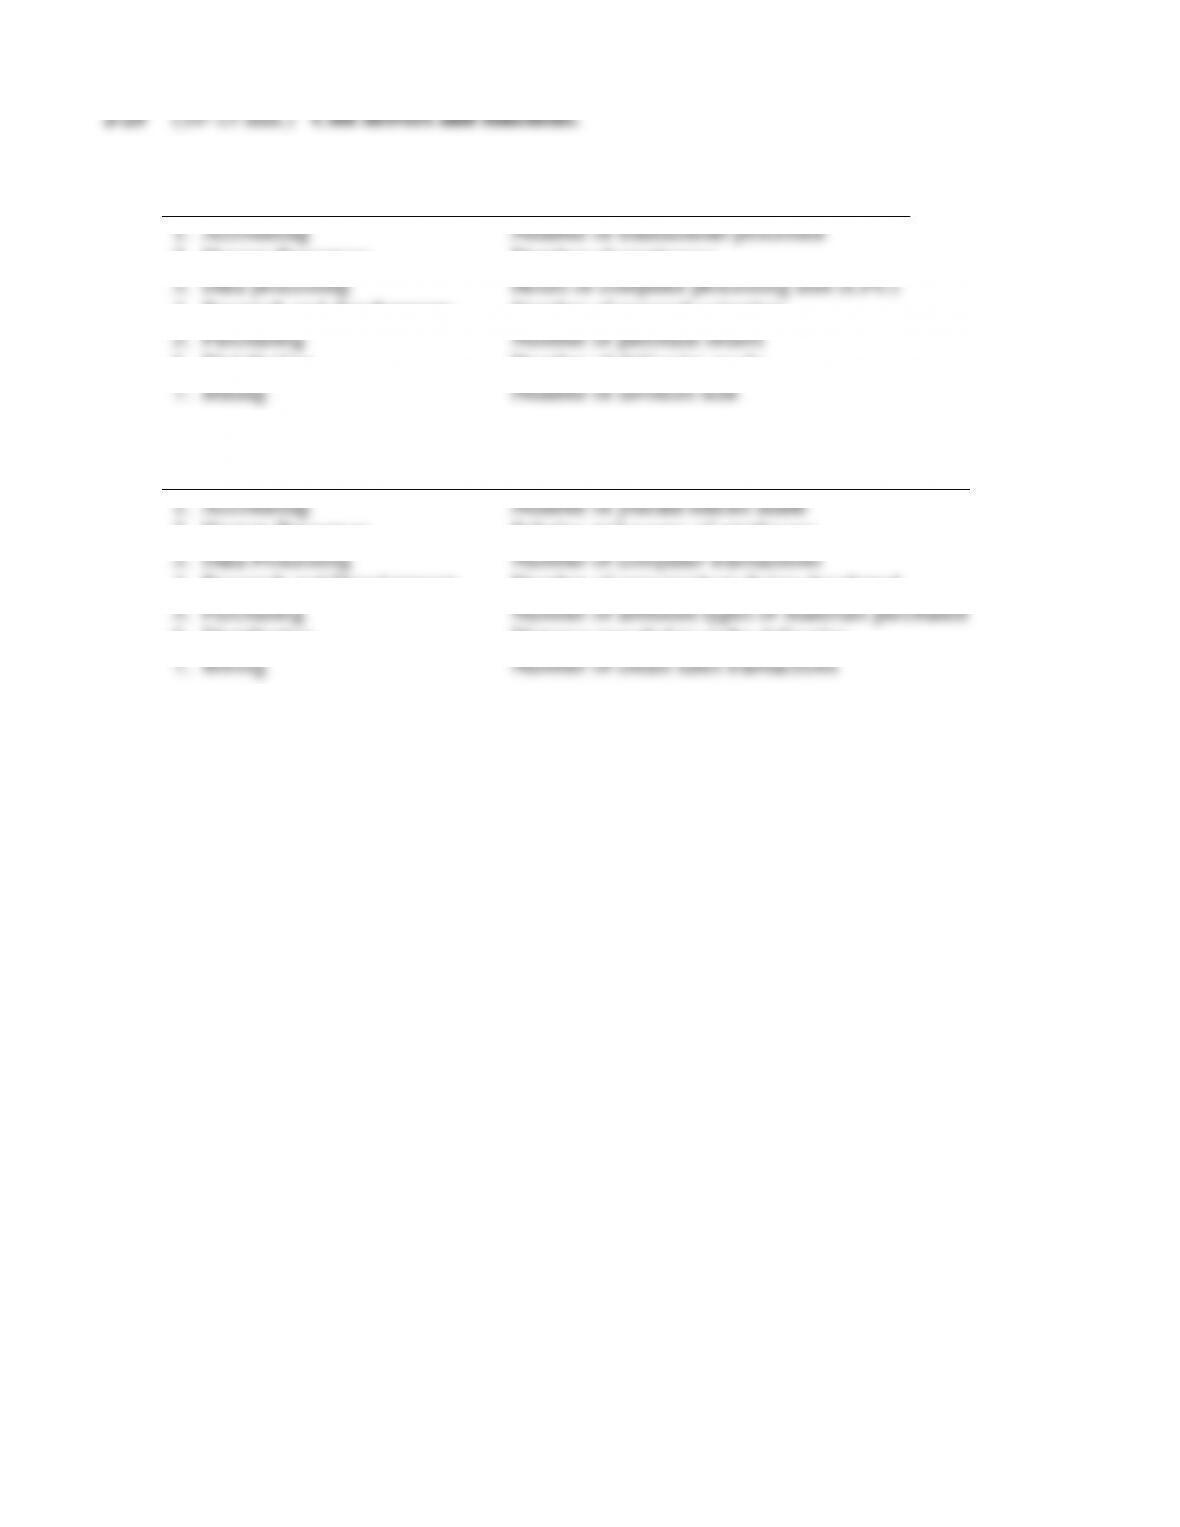
1.
Function
Representative Cost Driver
2. Human Resources Number of employees
4. Research and development Number of research scientists
6. Distribution Number of deliveries made
2.
Function
Representative Cost Driver
2. Human Resources Salaries and wages of employees
4. Research and Development Number of new products being developed
6. Distribution Distance traveled to make deliveries