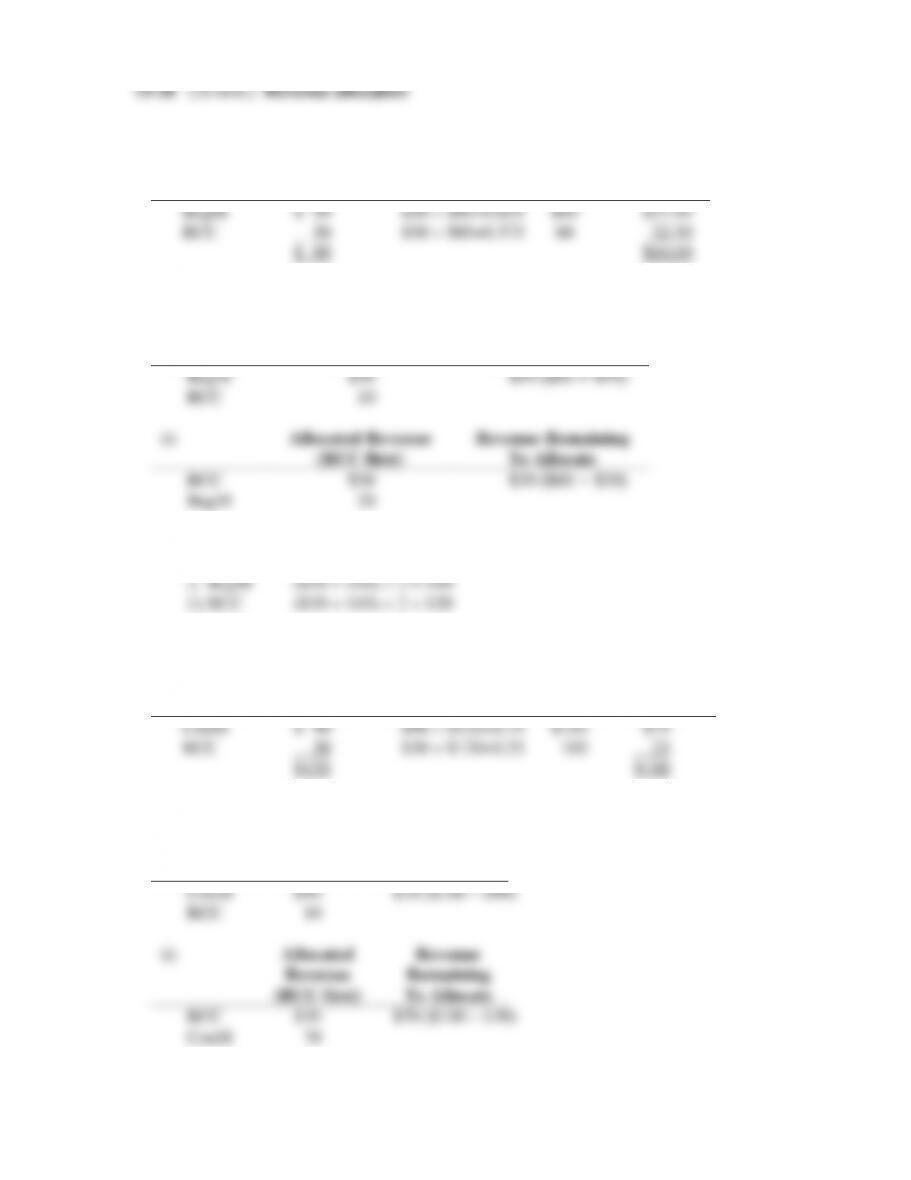
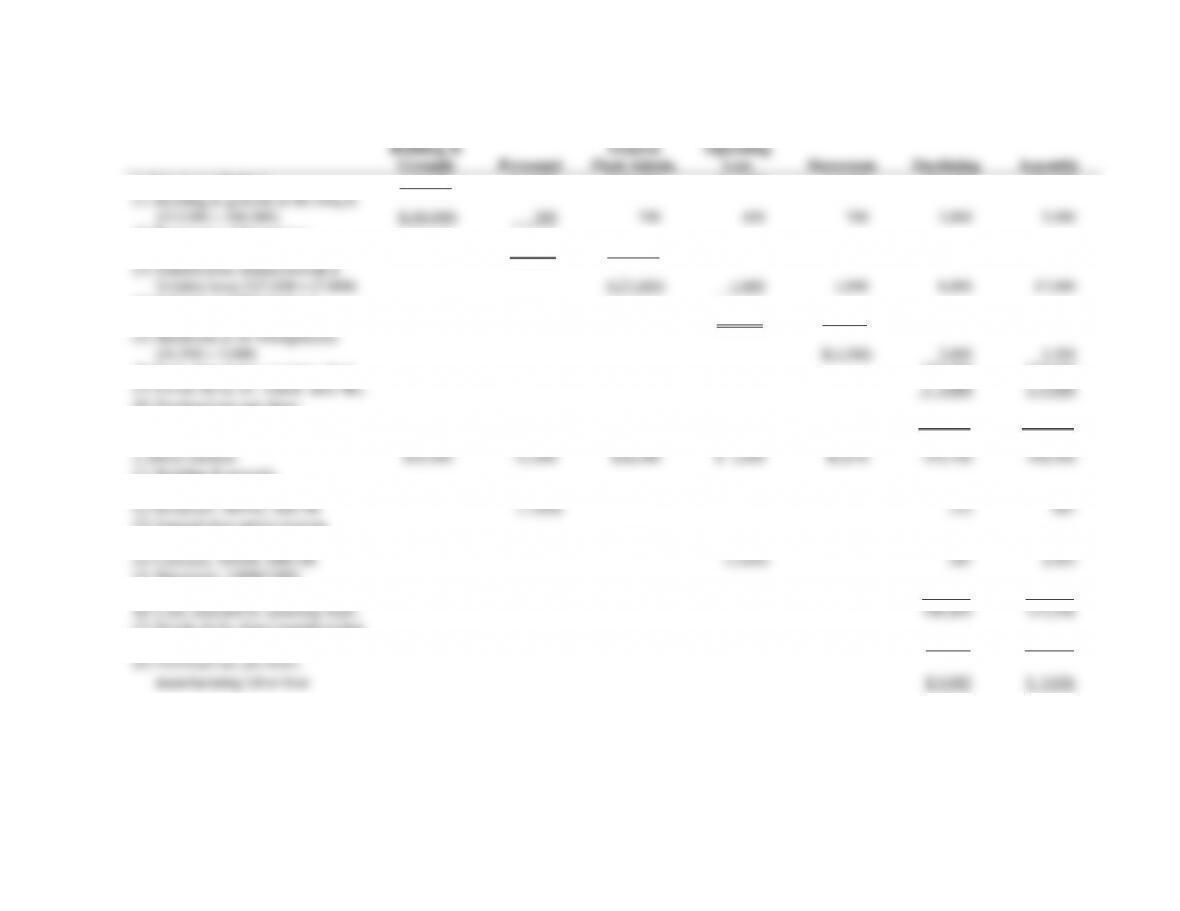
1. a. Stand-alone method for the BegM + RCC package
DVD
Separate
Revenue
Percentage
Joint
Revenue
Allocation
1. b. Incremental method
i)
Allocated Revenue
Revenue Remaining
(BegM first)
To Allocate
15-22
2. c. Shapley method. (assuming each DVD is demanded in equal proportion)
3. For each DVD package, the stand-alone method and the Shapley method give
approximately the same allocation to each DVD. These methods are fair if the demand for
15-23
15-29 (20 min.) Fixed cost allocation
1. i) Allocation using actual usage.
Department
Actual
Usage
Percentage of
Total Usage
Allocation
% × 1,500,000a
Executive
16,250
0.25
$ 375,000
Accounting
26,000
0.40
600,000
Human Resources
22,750
0.35
525,000
Total
65,000
$1,500,000
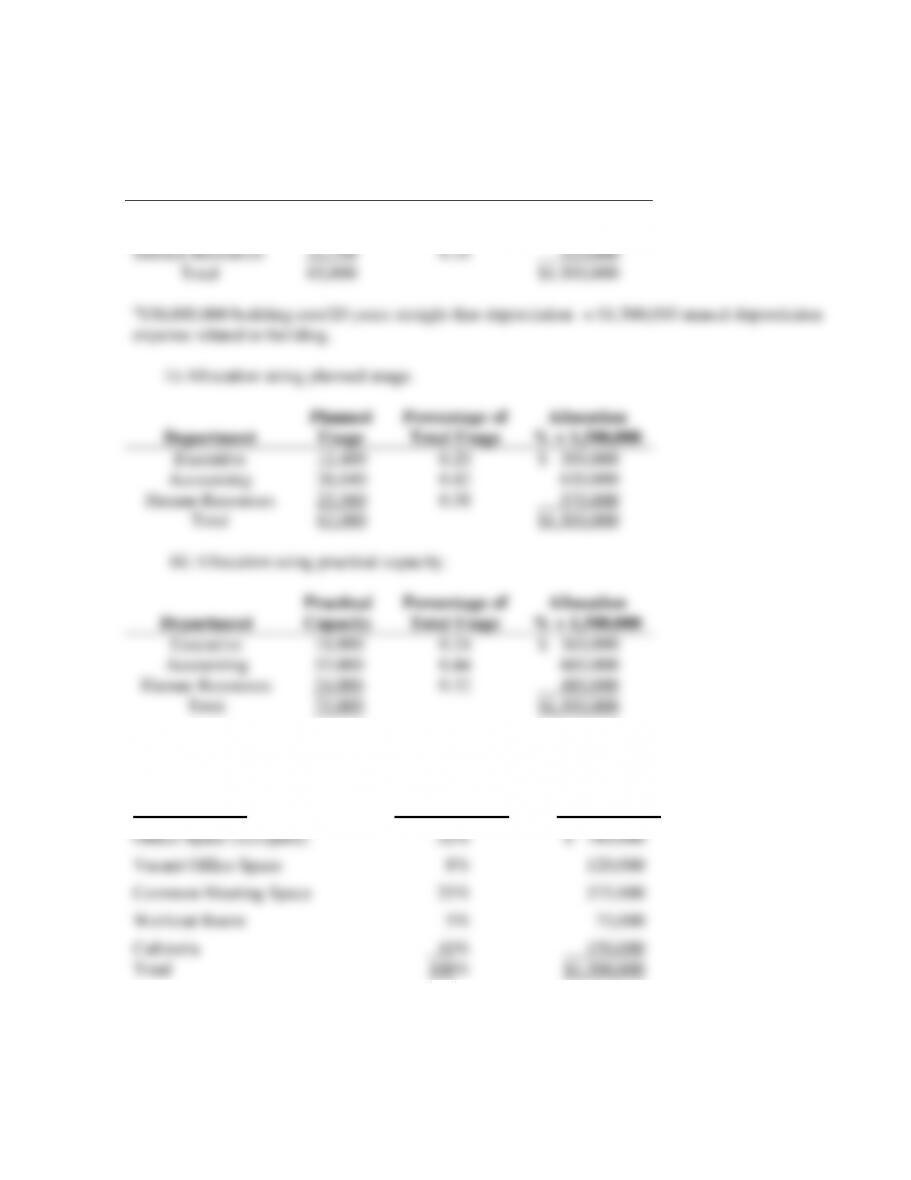
a$30,000,000 building cost/20 years straight-line depreciation = $1,500,000 annual depreciation
expense related to building.
ii) Allocation using planned usage.
Department
Planned
Usage
Percentage of
Total Usage
Allocation
% × 1,500,000
Executive
12,400
0.20
$ 300,000
Accounting
26,040
0.42
630,000
Human Resources
23,560
0.38
570,000
Total
62,000
$1,500,000
iii) Allocation using practical capacity.
Department
Practical
Capacity
Percentage of
Total Usage
Allocation
% × 1,500,000
Executive
18,000
0.24
$ 360,000
Accounting
33,000
0.44
660,000
Human Resources
24,000
0.32
480,000
Total
75,000
$1,500,000
2.
Usage of Space
% of Total
Building Space
% of Total Annual
Building Cost
Office Space (occupied)
52%
$ 780,000
Vacant Office Space
8%
120,000
Common Meeting Space
25%
375,000
Workout Room
5%
75,000
Cafeteria
10%
150,000
Total 100% $1,500,000
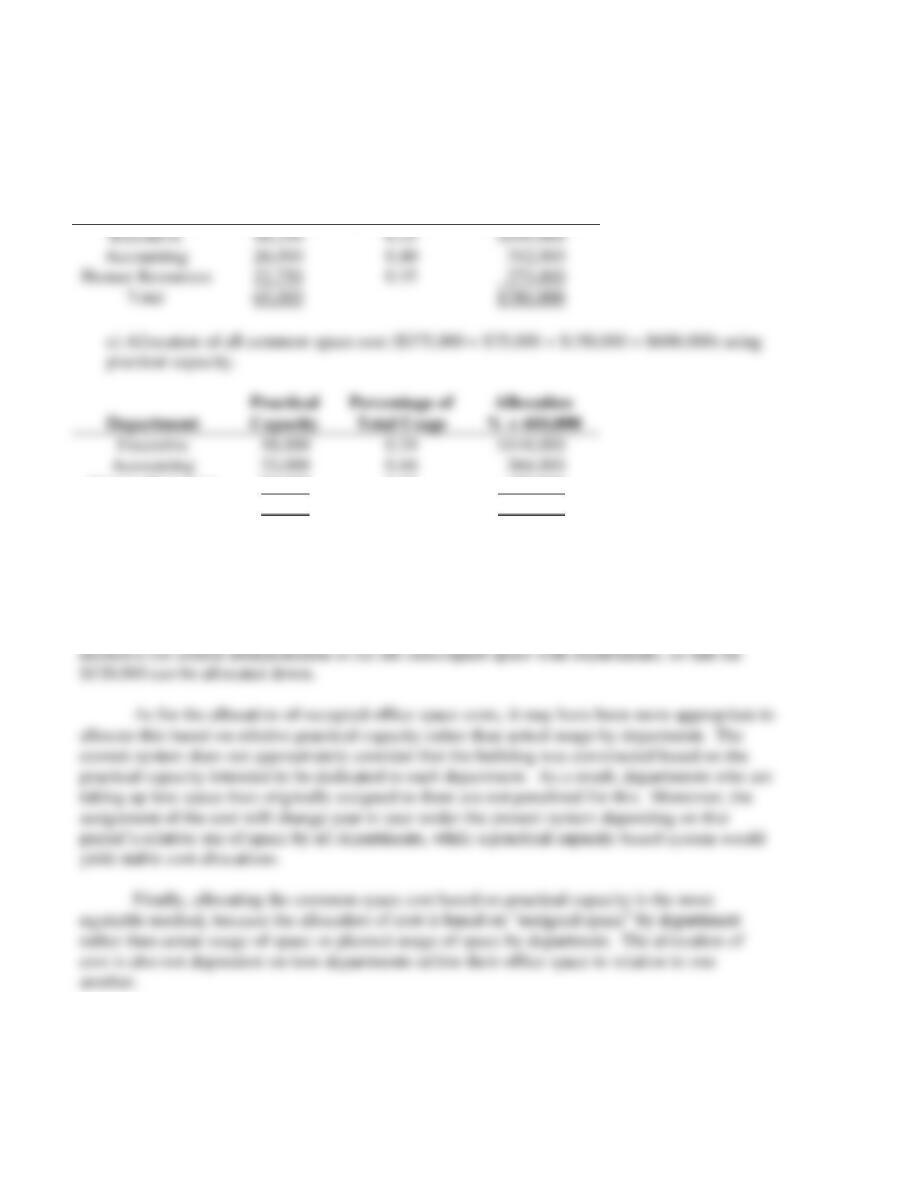
a) $120,000 of Vacant Office Space cost will not be allocated to the departments, but will
be absorbed by the university’s central administration.
b) Allocation of Office Space (occupied) costs ($780,000) using actual usage.
Department
Actual
Usage
Percentage of
Total Usage
Allocation
% × 780,000
Executive
16,250
0.25
$195,000
Accounting
26,000
0.40
312,000
Human Resources
22,750
0.35
273,000
Total
65,000
$780,000
Percentage of
Allocation
0.24
$144,000
Accounting
0.44
264,000
0.32
$600,000
15-25
15-30 (45 min.) Allocating costs of support departments; step-down and direct methods.
Building &
Grounds
Personnel
General
Plant Admin.
Cafeteria
Operating
Loss
Storeroom
Machining
Assembly
1. Step-down Method:
$ 10,000
$ 1,000
$ 26,090
$ 1,640
$ 2,670
$34,700
$48,900
(1) Building & grounds at $0.10/sq.ft.
($10,000 ÷ 100,000)
$(10,000)
200
700
400
700
3,000
5,000
(2) Personnel at $6/employee
($1,200 ÷ 200)
$(1,200)
210
60
30
300
600
(3) General plant administration at
$1/labor-hour ($27,000 ÷ 27,000)
$(27,000)
1,000
1,000
8,000
17,000
(4) Cafeteria at $20/empoloyee
($3,100 ÷ 155)
$(3,100)
100
1,000
2,000
(5) Storeroom at $1.50/requisition
($4,500 ÷ 3,000)
$(4,500)
3,000
1,500
(6) Costs allocated to operating depts.
$50,000
$75,000
(7) Divide (6) by dir. manuf. labor-hrs.
÷ 5,000
÷15,000
(8) Overhead rate per direct
manuf. labor-hour
$ 10
$ 5
2. Direct method:
$10,000
$1,000
$26,090
$ 1,640
$2,670
$34,700
$48,900
(1) Building & grounds,
30,000/80,000; 50,000/80,000
(10,000)
3,750
6,250
(2) Personnel, 50/150; 100/150
(1,000)
333
667
(3) General plant administration,
8,000/25,000; 17,000/25,000
(26,090)
8,349
17,741
(4) Cafeteria, 50/150; 100/150
(1,640)
547
1,093
(5) Storeroom: 2,000/3,000;
1,000/3,000
(2,670)
1,780
890
(6) Costs allocated to operating depts.
$49,459
$75,541
(7) Divide (6) by direct manufacturing
labor-hours
÷ 5,000
÷15,000
(8) Overhead rate per direct
manufacturing labor-hour
$ 9.892
$ 5.036
15-26
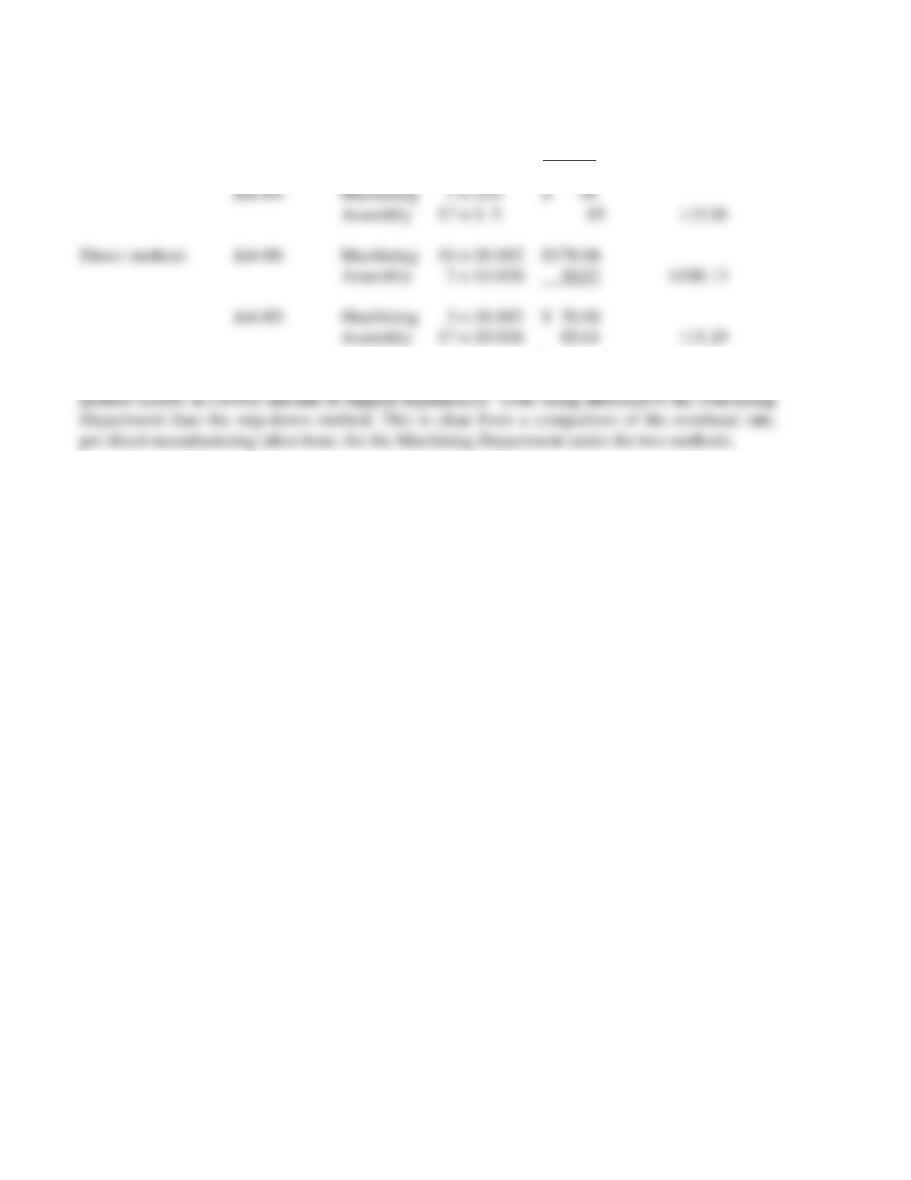
3. Comparison of Methods:
Step-down method: Job 88: Machining 18 × $10 $ 180
Assembly 2 × $ 5 10 $190.00
4. The manager of Machining Department would prefer the direct method. The direct
15-27
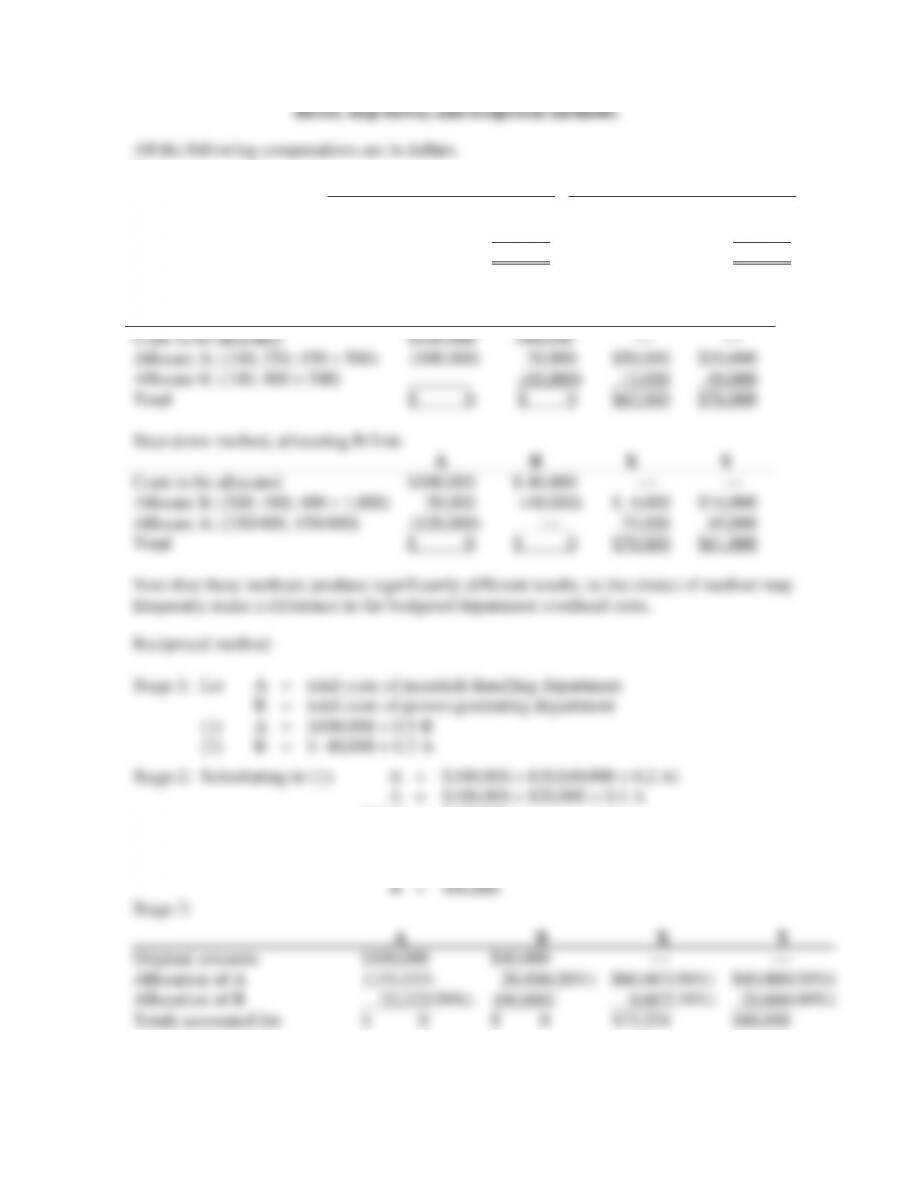
15-31 (40–60 min.) Support-department cost allocations; single-department cost pools;
1.
Direct method: To X To Y
A 250/400 $100,000 = $62,500 150/400 $100,000 = $37,500
B 100/500 $ 40,000 = 8,000 400/500 $ 40,000 = 32,000
Total $70,500 $69,500
Step-down method, allocating A first:
A
B
X
Y
A
B
X
Y
0.9 A = $120,000
A = $133,333
Substituting in (2): B = $40,000 + 0.2($133,333)
15-28
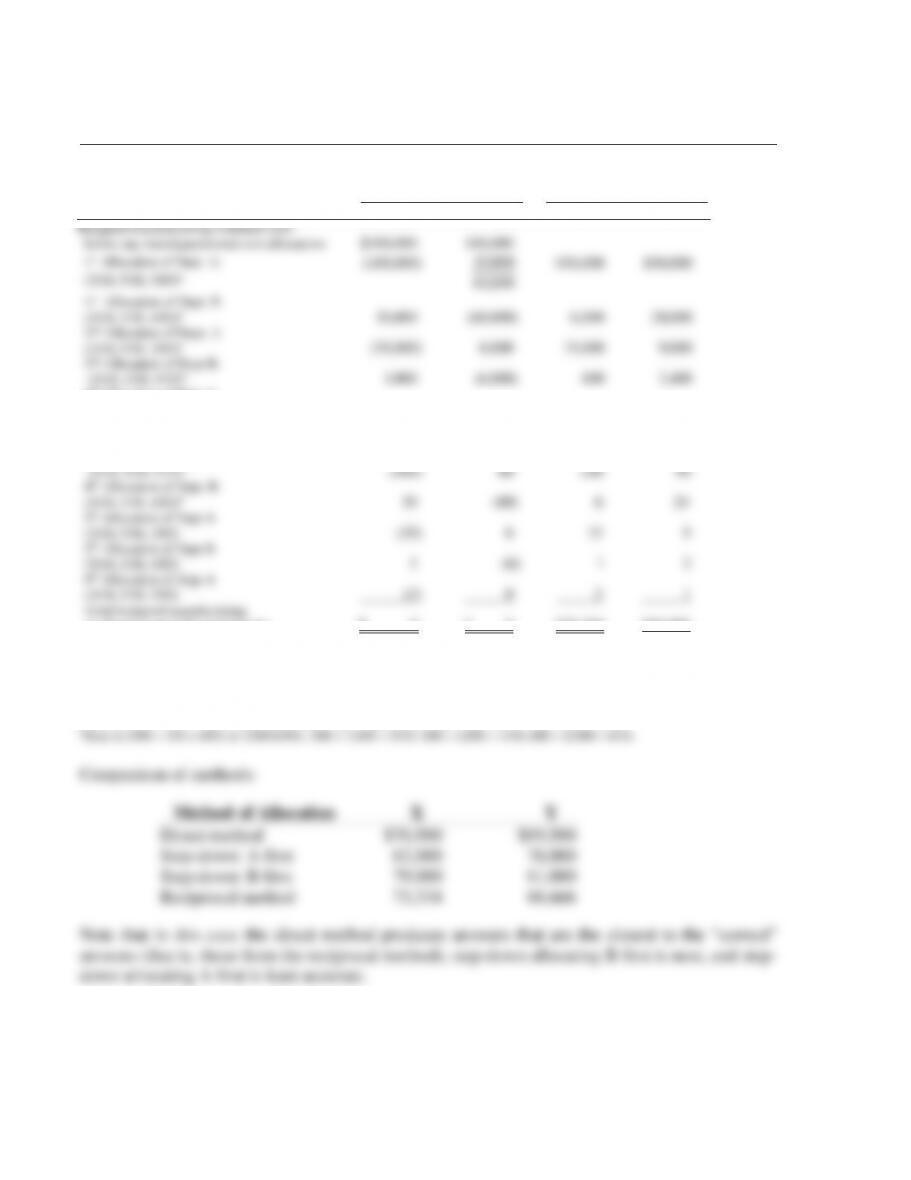
SOLUTION EXHIBIT 15-31
Reciprocal Method of Allocating Support Department Costs for Manes Company Using
Repeated Iterations.
Support Departments
Operating
Departments
A B X Y
Budgeted manufacturing overhead costs
before any interdepartmental cost allocations
$100,000
$40,000
1st Allocation of Dept. A:
(2/10, 5/10, 3/10)a
(100,000)
00060
00020
,
,
$50,000
$30,000
1st Allocation of Dept. B
(5/10, 1/10, 4/10)b
30,000
(60,000)
6,000
24,000
2nd Allocation of Dept. A
(2/10, 5/10, 3/10)a
(30,000)
6,000
15,000
9,000
2nd Allocation of Dept B:
(5/10, 1/10, 4/10)b
3,000
(6,000)
600
2,400
3rd Allocation of Dept A:
(2/10, 5/10, 3/10)a
(3,000)
600
1,500
900
3rd Allocation of Dept. B:
(5/10, 1/10, 4/10)b
300
(600)
60
240
4th Allocation of Dept. A
(2/10, 5/10, 3/10)a
(300)
60
150
90
4th Allocation of Dept. B
(5/10, 1/10, 4/10)b
30
(60)
6
24
5th Allocation of Dept A
(2/10, 5/10, 3/10)
(30)
6
15
9
5th Allocation of Dept B
(5/10, 1/10, 4/10)
3
(6)
1
2
6th Allocation of Dept A
(2/10, 5/10, 3/10)
(3)
0
2
1
Total budgeted manufacturing
overhead of operating departments
$ 0
$ 0
$73,334
$66,666
Total accounts allocated and reallocated (the numbers in parentheses in first two columns)
Dept A; Materials Handling: $100,000 + $30,000 + $3,000 + $300 + $30 + $3 = $133,333
Dept B; Power Generation: $60,000 + $6,000 + $600 + $60 + $6 = $66,666
aBase is (100 + 250 +150) or 500 labor-hours; 100 ÷ 500 = 2/10, 250 ÷ 500 = 5/10, 150 ÷ 500 = 3/10.
2. At first glance, it appears that the cost of power is $40 per unit plus the material
handling costs. If so, Manes would be better off by purchasing from the power company.
However, the decision should be influenced by the effects of the interdependencies and the fixed
costs. Note that the power needs would be less (students frequently miss this) if they were
purchased from the outside:
Outside
Power Units
Needed
X 100
Y 400
A (500 units minus 20% of 500 units,
because there is no need to service
the nonexistent power department) 400
Total units 900
Total costs, 900 $40 = $36,000
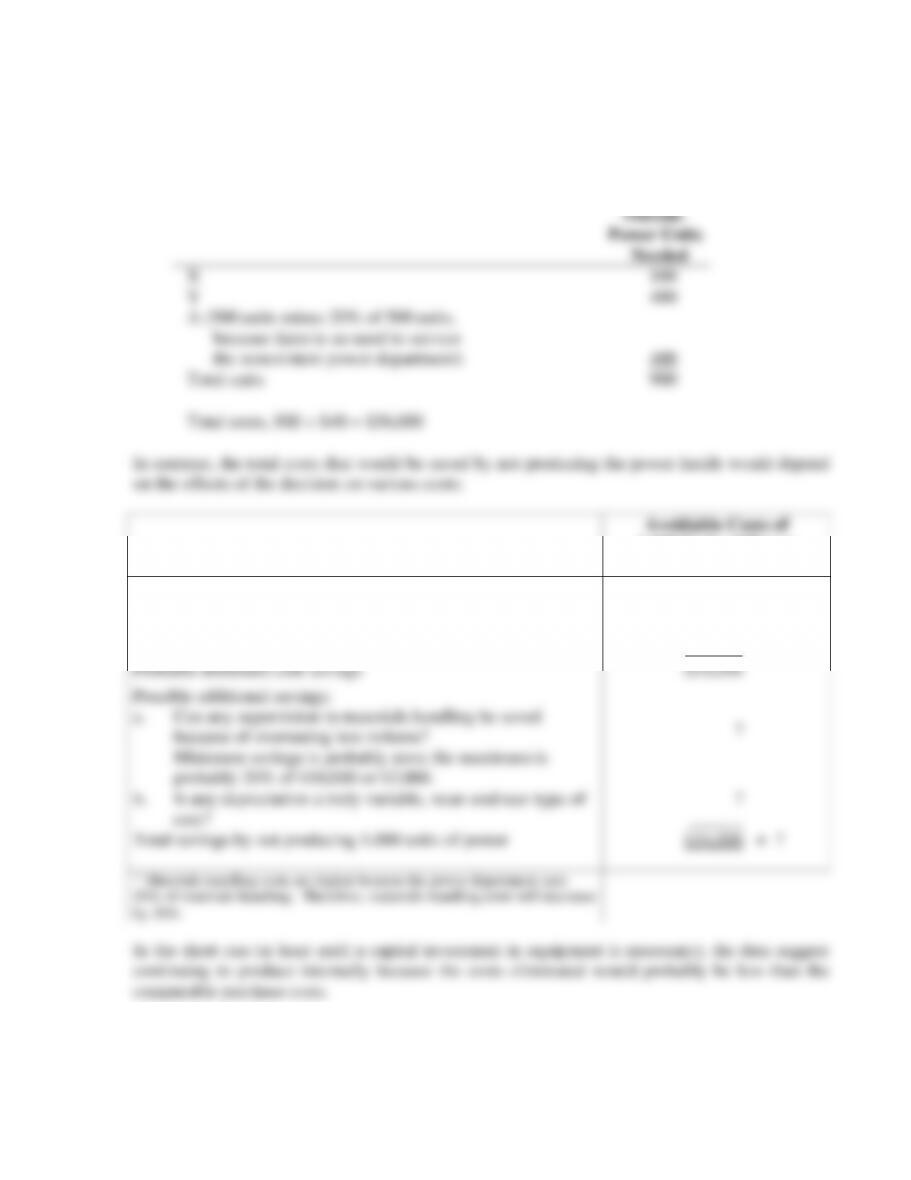
In contrast, the total costs that would be saved by not producing the power inside would depend
on the effects of the decision on various costs:
Avoidable Costs of
1,000 Units of Power
Produced Inside
Variable indirect labor and indirect material costs
Supervision in power department
Materials handling, 20% of $70,000*
Probable minimum cost savings
Possible additional savings:
a. Can any supervision in materials handling be saved
because of overseeing less volume?
Minimum savings is probably zero; the maximum is
probably 20% of $10,000 or $2,000.
b. Is any depreciation a truly variable, wear-and-tear type of
cost?
Total savings by not producing 1,000 units of power
$10,000
10,000
14,000
$34,000
?
?
______
$34,000 + ?
* Materials handling costs are higher because the power department uses
20% of materials handling. Therefore, materials-handling costs will decrease
by 20%.
In the short run (at least until a capital investment in equipment is necessary), the data suggest
continuing to produce internally because the costs eliminated would probably be less than the
15-30
15-32 (25 min.) Common costs.
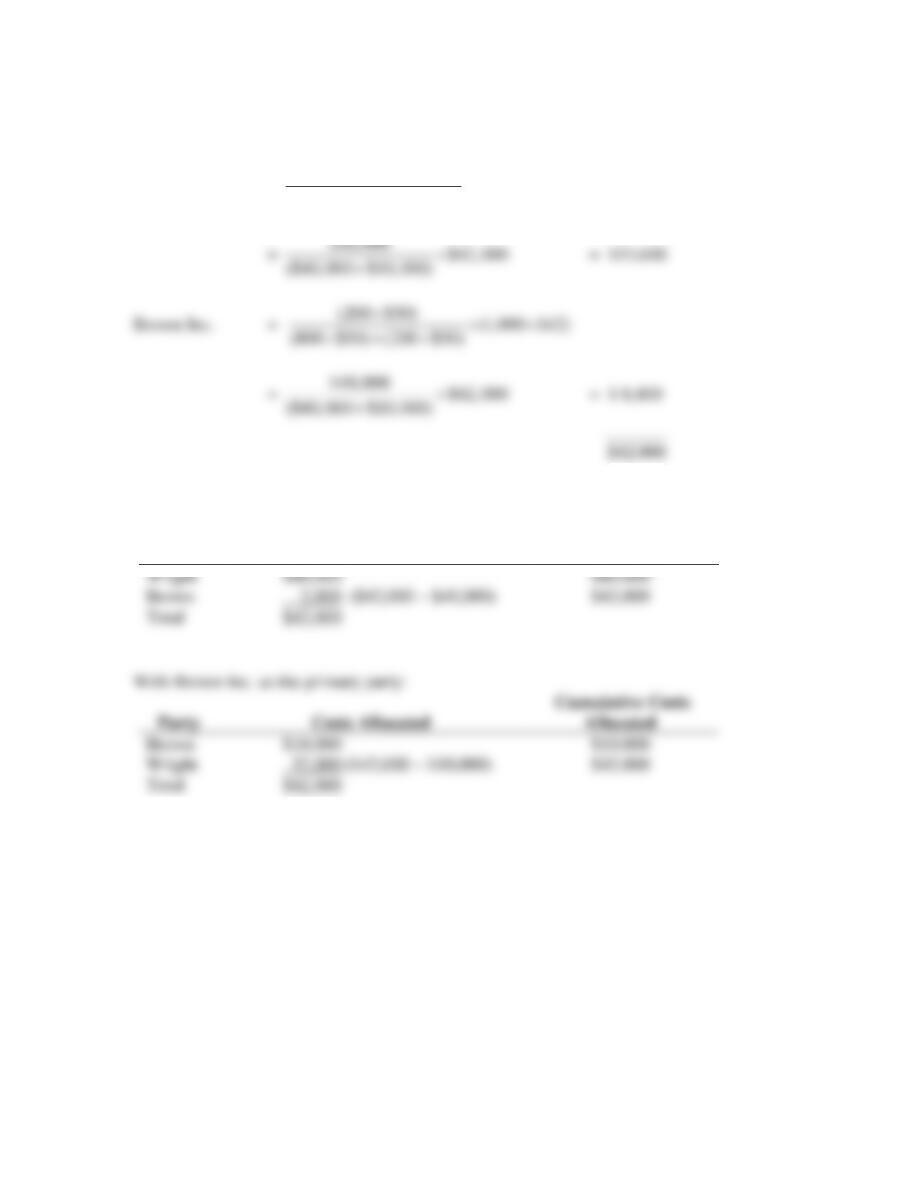
1. Stand-alone cost-allocation method.
Wright Inc. =
(800 $50) (1,000 $42)
(800 $50) (200 $50)
+
$40,000 $42,000
2. With Wright Inc. as the primary party:
Party
Costs Allocated
Cumulative Costs
Allocated
Wright
$40,000
$40,000
Brown
2,000 ($42,000 – $40,000)
$42,000
Total
$42,000
With Brown Inc. as the primary party:
Party
Costs Allocated
Cumulative Costs
Allocated
Brown
$10,000
$10,000
Wright
32,000 ($42,000 – $10,000)
$42,000
Total
$42,000
$10,000 $42,000