19-1
CHAPTER 19
19-1 Quality costs (including the opportunity cost of lost sales because of poor quality) can be
19-2 Design quality refers to how closely the characteristics of a product or service meet the
19-3 Exhibit 19-1 of the text lists the following six line items in the prevention costs category:
19-4 An internal failure cost differs from an external failure cost on the basis of when the
19-5 Three methods that companies use to identify quality problems are: (a) a control chart
which is a graph of a series of successive observations of a particular step, procedure, or
19-6 No, companies should emphasize financial as well as nonfinancial measures of quality,
such as yield and defect rates. Nonfinancial measures are not directly linked to bottom-line
19-7 Examples of nonfinancial measures of customer satisfaction relating to quality include
the following:
shipped;
2. the number of customer complaints;
4. on-time delivery rate (percentage of shipments made on or before the promised delivery
date);
6. market share; and
1. the percentage of defective products;
3. manufacturing cycle time (the amount of time from when an order is received by
production to when it becomes a finished good); and
19-9 Customer-response time is how long it takes from the time a customer places an order for
a product or a service to the time the product or service is delivered to the customer.
19-3
19-14 The four key steps in managing bottleneck resources are:
Step 1: Recognize that the bottleneck operation determines throughput contribution of the
19-15 The chapter describes several ways to improve the performance of a bottleneck operation.
2. Process only those parts or products at the bottleneck operation that increase throughput
margin, not parts or products that will remain in finished goods or spare parts inventories.
4. Reduce setup time and processing time at bottleneck operations.
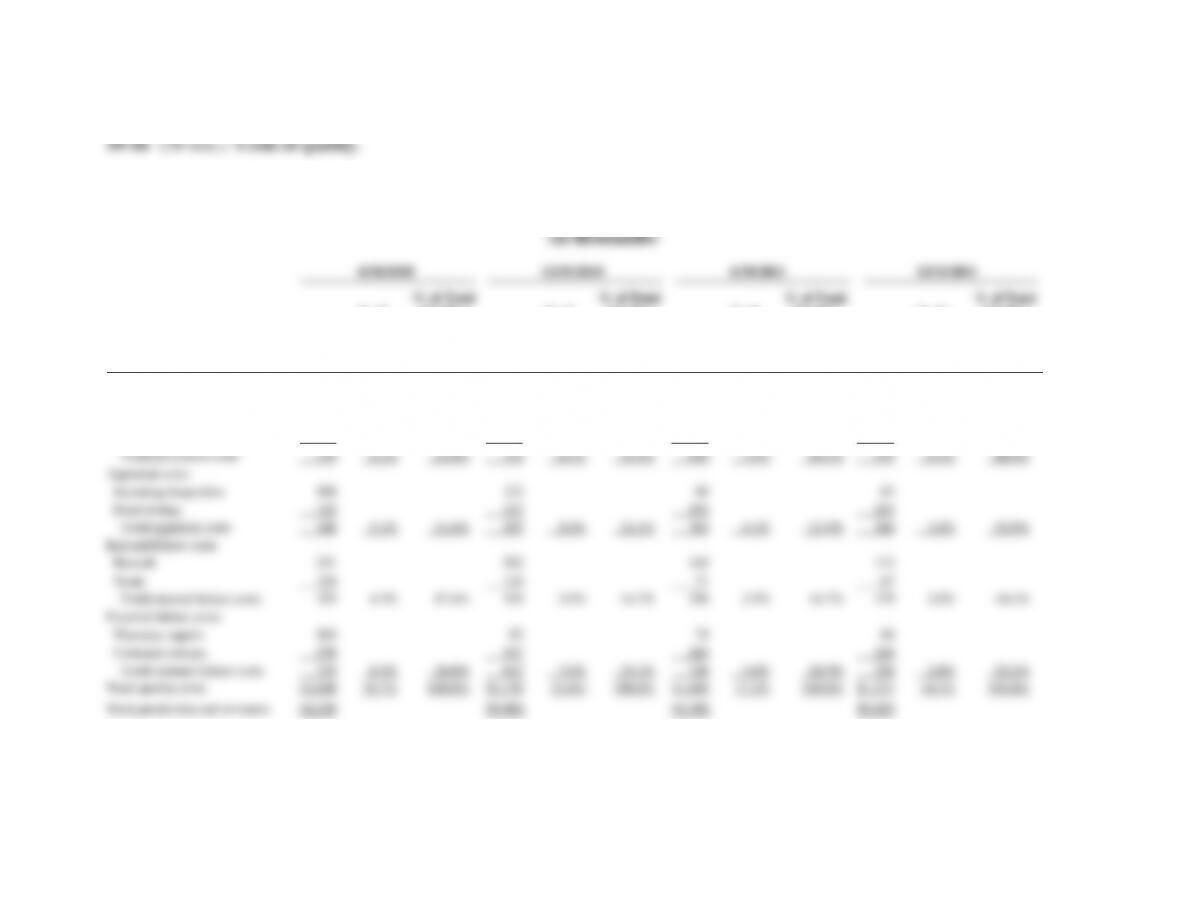
1. The ratios of each COQ category to revenues and to total quality costs for each period are as follows:
Costen, Inc.: Semi-annual Costs of Quality Report
19-5
2. From an analysis of the Cost of Quality Report, it would appear that Costen, Inc.’s
14.1%.
• External failure costs, those costs signaling customer dissatisfaction, have declined
from 8.9% of total revenues to 2.8% of total revenues and from 36% of all quality
costs to 20.1% of all quality costs. These declines in warranty repairs and customer
returns should translate into increased revenues in the future.
by 9.5%.
3. To estimate the opportunity cost of not implementing the quality program and to help her
make her case, Jessica Tolmy could have assumed that:
• Sales and market share would continue to decline if the quality program was not
19-6
19-17 (20 min.) Costs of quality analysis.
1. Appraisal cost = Inspection cost
2. Internal failure cost = Rework cost
3. Out of pocket external failure cost = Shipping cost + Repair cost
4. Opportunity cost of external failure = Lost future profits
6. Quality control costs under the alternative inspection technique:
Appraisal cost = $1 × 250,000 = $250,000
Internal failure cost = 5% × 250,000 × $0.75 = $9,375
7. In addition to the lower costs under the alternative inspection plan, Safe Rider should
consider a number of other factors:

19-7
1. Cost of improving quality of plastic = $15 × 250,000 = $3,750,000
3. While economically this may seem like a good decision, qualitative factors should be more
important than quantitative factors when it comes to protecting customers from harm and
4. In addition to ethical considerations, the company should consider the societal cost of this
1.
2010
2011
Percentage of defective units
shipped
100 = 5%
2,000
400 = 4%
10,000
Customer complaints as a
percentage of units shipped
150 = 7.5%
2,000
250 = 2.5%
10,000
Percentage of units reworked
during production
120 = 6%
2,000
700 = 7%
10,000
Manufacturing cycle time as a
percentage of total time from
order to delivery
15 days = 50%
30 days
16 days = 57%
28 days
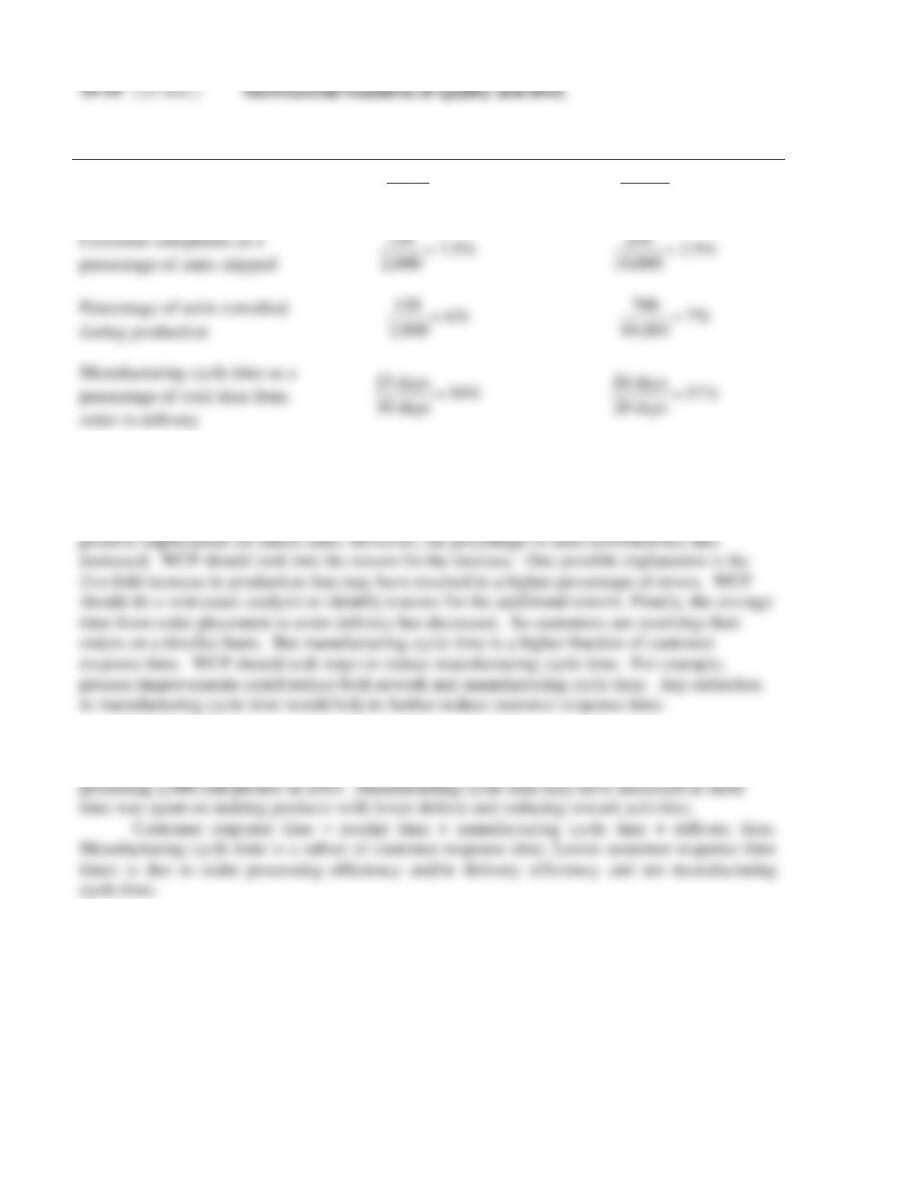
2. Quality has by and large improved. The percentage of defects has decreased by 1
percentage point and the number of customer complaints has decreased by 5 percentage points.
The former indicates an increase in the quality of the cell phones being produced. The latter has
3. Manufacturing cycle time = wait time + manufacturing time. Producing 10,000 cell
phones in 2011 may have required more waiting time for each order than the waiting time from
19-9
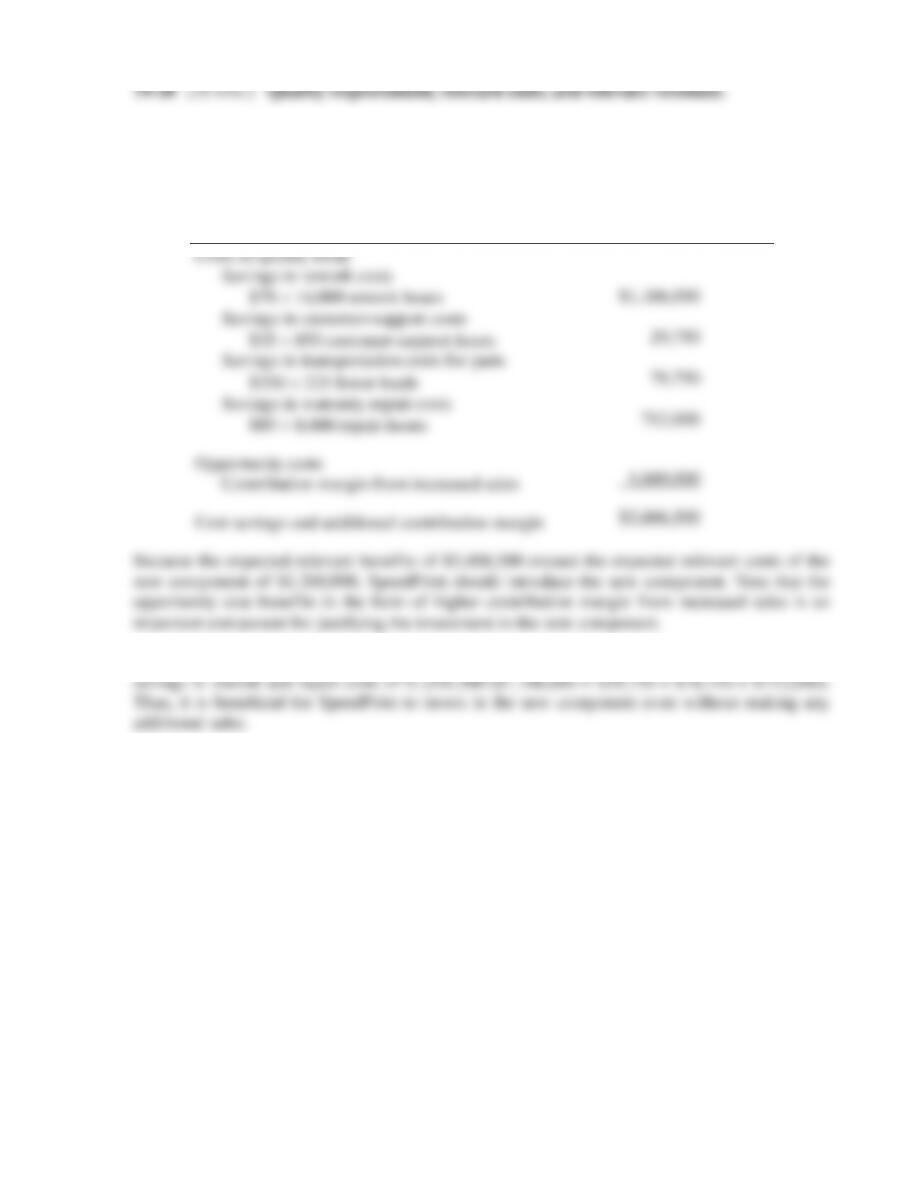
1. Relevant costs over the next year of changing to the new component
= $70 18,000 copiers = $1,260,000
Relevant Benefits over
the Next Year of Choosing
the New Component
Costs of quality items
Savings in rework costs
$79 14,000 rework hours
Savings in customer-support costs
$35 850 customer-support hours
Savings in transportation costs for parts
$350 225 fewer loads
Savings in warranty repair costs
$89 8,000 repair-hours
Opportunity costs
Contribution margin from increased sales
Cost savings and additional contribution margin
$1,106,000
29,750
78,750
712,000
1,680,000
$3,606,500
Because the expected relevant benefits of $3,606,500 exceed the expected relevant costs of the
new component of $1,260,000, SpeedPrint should introduce the new component. Note that the
opportunity cost benefits in the form of higher contribution margin from increased sales is an
important component for justifying the investment in the new component.
2. The incremental cost of the new component of $1,260,000 is less than the incremental
19-10
1.
Budgeted variable cost per attendee:
Customer support and service personnel
$ 55
Food and drink
100
Conference materials
35
Incidental products and services
15
Total budgeted variable cost per attendee
$205
Total budgeted variable cost ($205 × 50,000 attendees)
$10,250,000
Budgeted fixed costs:
Building and facilities
$3,600,000
Management salaries
1,400,000
Total budgeted fixed costs
5,000,000
Total budgeted costs
15,250,000
Budgeted operating income
3,500,000
Budgeted revenues
$18,750,000
Budgeted revenue per conference attendee
($18,750,000 ÷ 50,000)
$375
The budgeted revenue per conference attendee is $375.
2. Quality improvements: additional menu items; additional incidental products and services;
improved facilities.
Budgeted variable cost per attendee:
Customer support and service personnel ($55 + $3)
$ 58
Food and drink ($100 + $5)
105
Conference materials ($35 + $0)
35
Incidental products and services ($15 + $2)
17
Total budgeted variable cost per attendee
$215
Budgeted revenues ($375 per attendee 70,000 attendees)
$26,250,000
Total budgeted variable costs ($215 70,000 attendees)
15,050,000
Budgeted fixed costs:
Building and facilities (3,500,000 1.50)
$5,250,000
Management salaries (1,500,000 1.50)
2,250,000
Total budgeted fixed costs
7,500,000
Total budgeted costs
22,550,000
Budgeted operating income`
$ 3,700,000