16-11
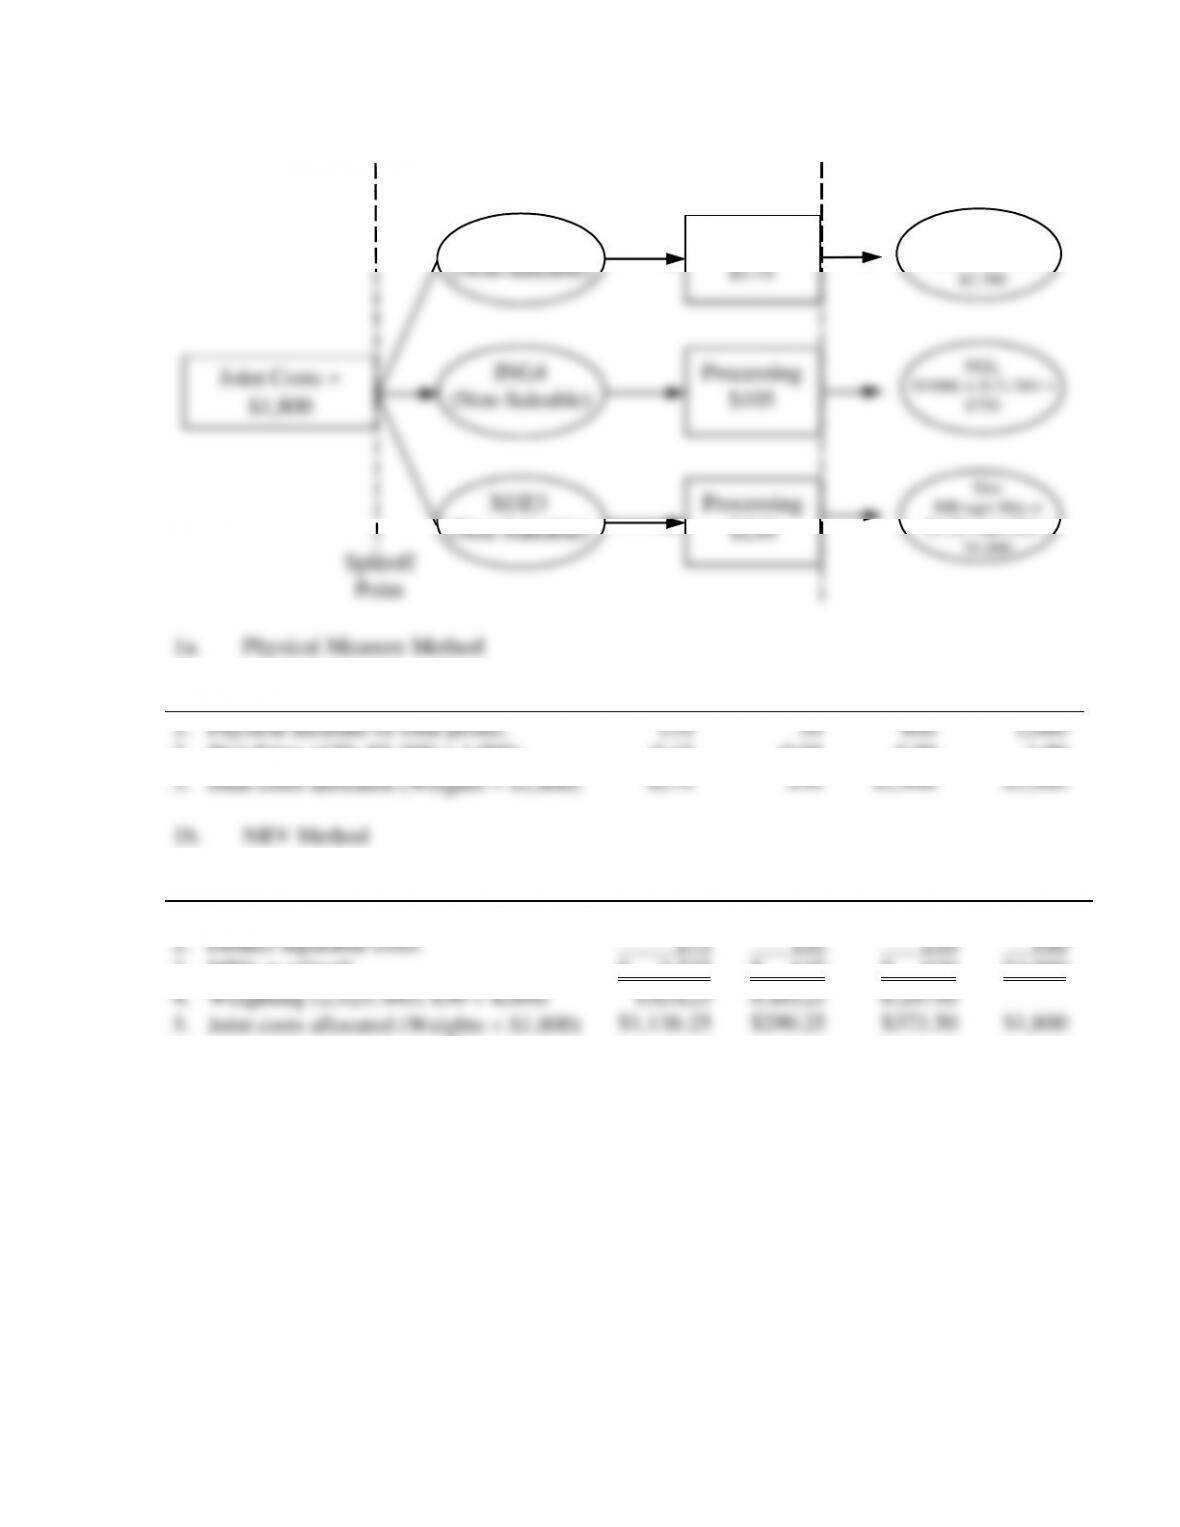
16-21 (30 min.) Joint-cost allocation, process further.
Joint Costs =
$1800
ICR8
(Non-Saleable)
ING4
(Non-Saleable)
XGE3
(Non-Saleable)
Processing
$175
Processing
$210
Processing
$105
Crude Oil
150 bbls × $18 / bbl =
$2700
NGL
50 bbls × $15 / bbl =
$750
Gas
800 eqvt bbls ×
$1.30 / eqvt bbl =
$1040
Splitoff
Point
1a. Physical Measure Method
Crude Oil
NGL
Gas
Total
1. Physical measure of total prodn.
2. Weighting (150; 50; 800 ÷ 1,000)
3. Joint costs allocated (Weights $1,800)
150
0.15
$270
50
0.05
$90
800
0.80
$1,440
1,000
1.00
$1,800
1b. NRV Method
Crude Oil
NGL
Gas
Total
1. Final sales value of total production
2. Deduct separable costs
3. NRV at splitoff
4. Weighting (2,525; 645; 830 ÷ 4,000)
5. Joint costs allocated (Weights $1,800)
$ 2,700
175
$ 2,525
0.63125
$1,136.25
$ 750
105
$ 645
0.16125
$290.25
$ 1,040
210
$ 830
0.20750
$373.50
$4,490
490
$4,000
$1,800
2. The operating-income amounts for each product using each method is:
(a) Physical Measure Method
Crude Oil
NGL
Gas
Total
Revenues
Cost of goods sold
Joint costs
Separable costs
Total cost of goods sold
Gross margin
$2,700
270
175
445
$2,255
$750
90
105
195
$555
$1,040
1,440
210
1,650
$ (610)
$4,490
1,800
490
2,290
$2,200
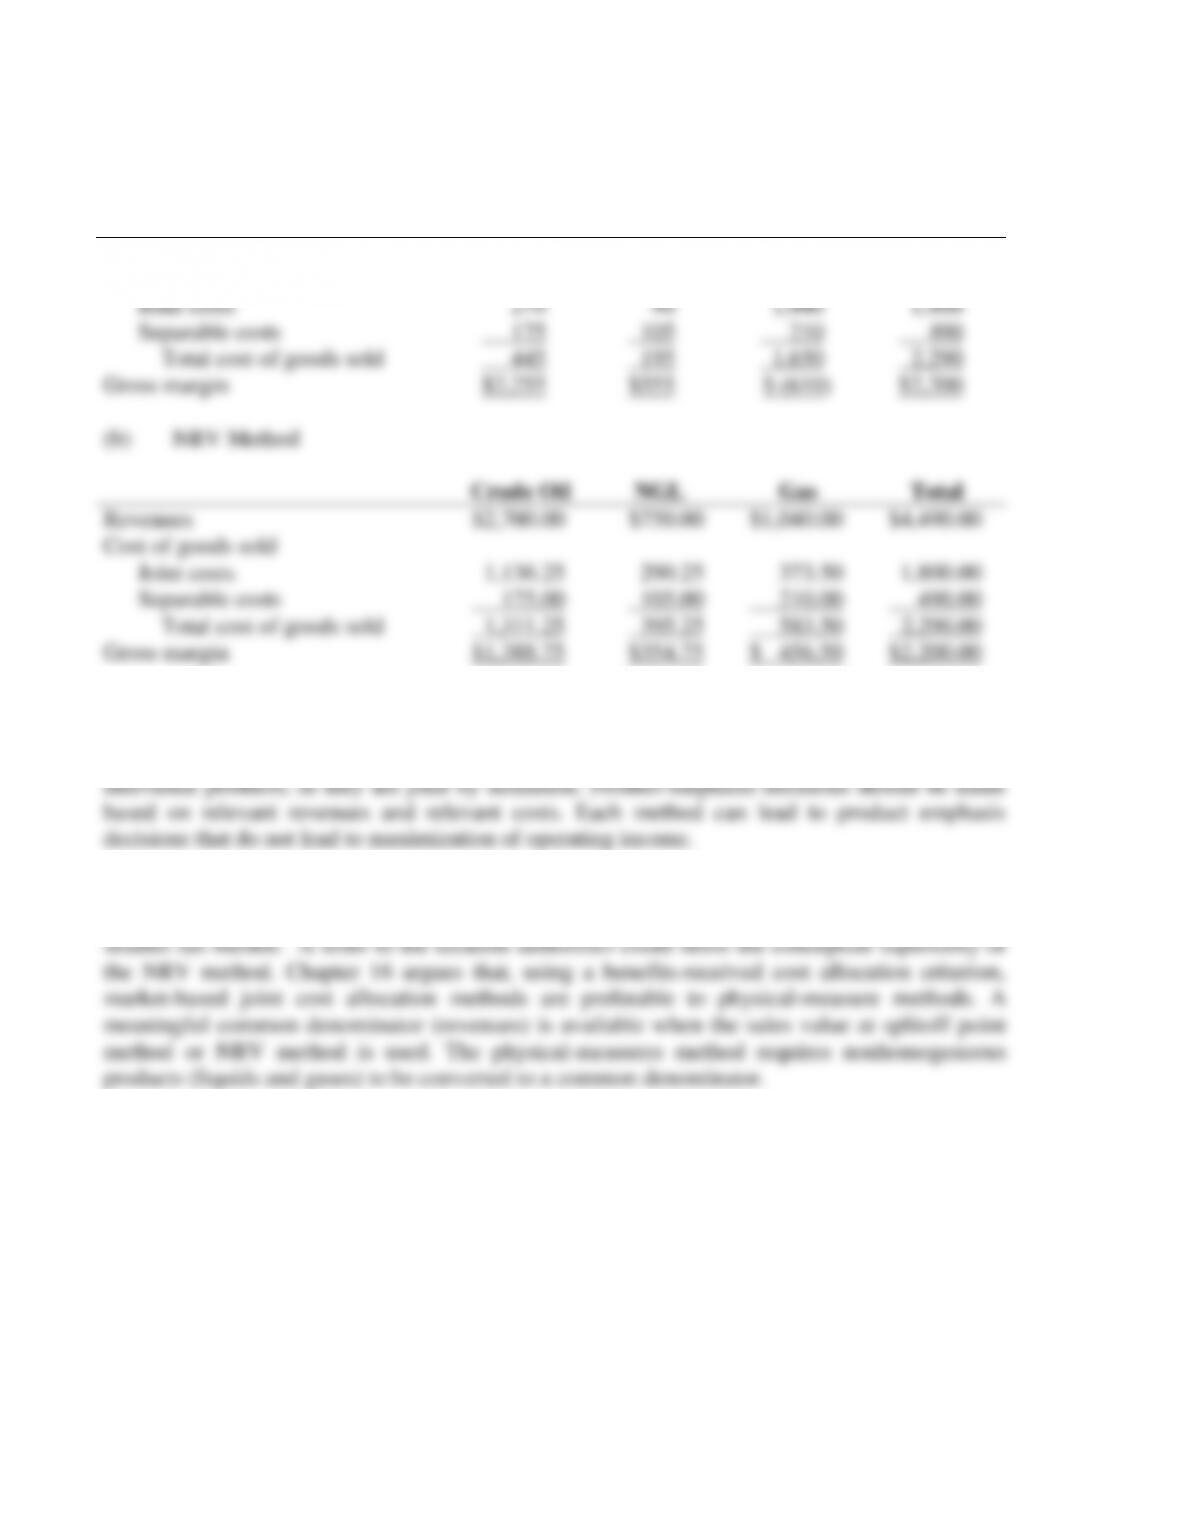
(b) NRV Method
Crude Oil
NGL
Gas
Total
Revenues
Cost of goods sold
Joint costs
Separable costs
Total cost of goods sold
Gross margin
$2,700.00
1,136.25
175.00
1,311.25
$1,388.75
$750.00
290.25
105.00
395.25
$354.75
$1,040.00
373.50
210.00
583.50
$ 456.50
$4,490.00
1,800.00
490.00
2,290.00
$2,200.00
3. Neither method should be used for product emphasis decisions. It is inappropriate to use
joint-cost-allocated data to make decisions regarding dropping individual products, or pushing
4. Since crude oil is the only product subject to taxation, it is clearly in Sinclair’s best
interest to use the NRV method since it leads to a lower profit for crude oil and, consequently, a
16-13
16-22 (30 min.) Joint-cost allocation, sales value, physical measure, NRV methods.
1a.
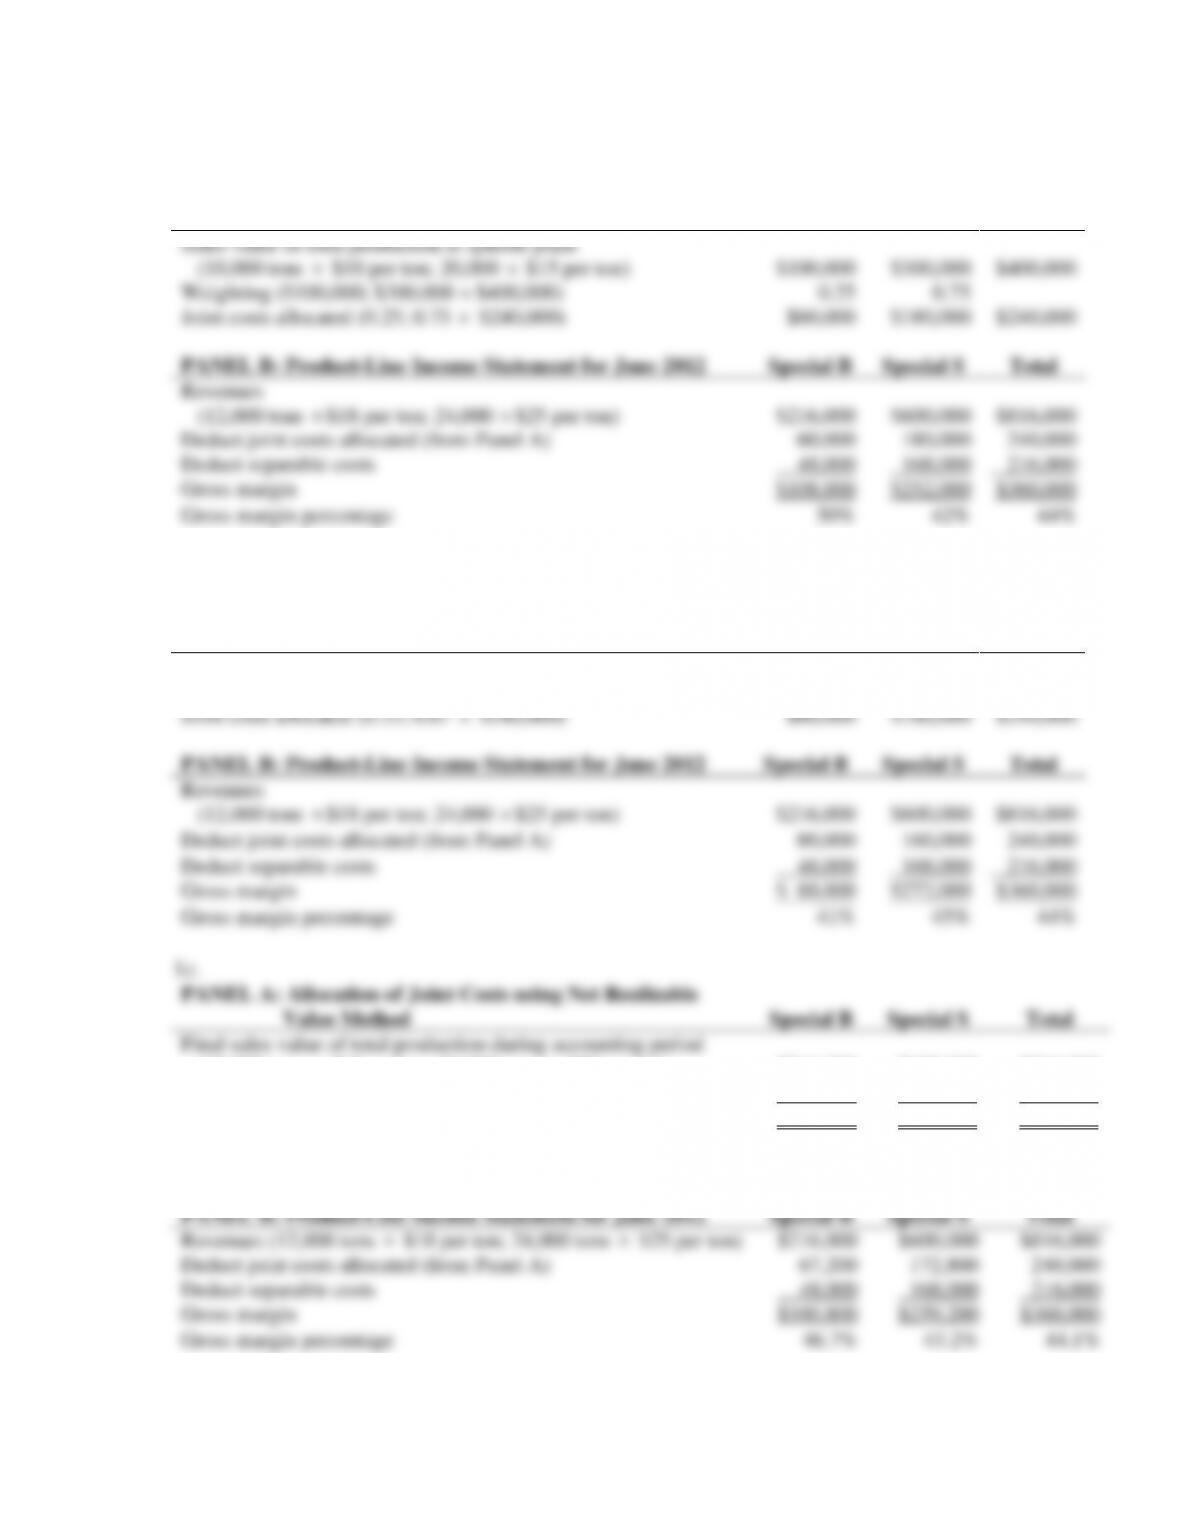
PANEL A: Allocation of Joint Costs using Sales Value at
Splitoff Method
Special B/
Beef
Ramen
Special S/
Shrimp
Ramen
Total
Sales value of total production at splitoff point
(10,000 tons
$10 per ton; 20,000
$15 per ton)
$100,000
$300,000
$400,000
Weighting ($100,000; $300,000 ÷ $400,000)
0.25
0.75
Joint costs allocated (0.25; 0.75
$240,000)
$60,000
$180,000
$240,000
PANEL B: Product-Line Income Statement for June 2012
Special B
Special S
Total
Revenues
(12,000 tons
$18 per ton; 24,000
$25 per ton)
$216,000
$600,000
$816,000
Deduct joint costs allocated (from Panel A)
60,000
180,000
240,000
Deduct separable costs
48,000
168,000
216,000
Gross margin
$108,000
$252,000
$360,000
Gross margin percentage
50%
42%
44%
1b.
PANEL A: Allocation of Joint Costs using Physical-Measure
Method
Special B/
Beef
Ramen
Special S/
Shrimp
Ramen
Total
Physical measure of total production (tons)
10,000
20,000
30,000
Weighting (10,000 tons; 20,000 tons ÷ 30,000 tons)
33%
67%
Joint costs allocated (0.33; 0.67
$240,000)
$80,000
$160,000
$240,000
PANEL B: Product-Line Income Statement for June 2012
Special B
Special S
Total
Revenues
(12,000 tons
$18 per ton; 24,000
$25 per ton)
$216,000
$600,000
$816,000
Deduct joint costs allocated (from Panel A)
80,000
160,000
240,000
Deduct separable costs
48,000
168,000
216,000
Gross margin
$ 88,000
$272,000
$360,000
Gross margin percentage
41%
45%
44%
1c.
PANEL A: Allocation of Joint Costs using Net Realizable
Value Method
Special B
Special S
Total
Final sales value of total production during accounting period
(12,000 tons
$18 per ton; 24,000 tons
$25 per ton)
$216,000
$600,000
$816,000
Deduct separable costs
48,000
168,000
216,000
Net realizable value at splitoff point
$168,000
$432,000
$600,000
Weighting ($168,000; $432,000 ÷ $600,000)
28%
72%
Joint costs allocated (0.28; 0.72
$240,000)
$67,200
$172,800
$240,000
PANEL B: Product-Line Income Statement for June 2012
Special B
Special S
Total
Revenues (12,000 tons
$18 per ton; 24,000 tons
$25 per ton)
$216,000
$600,000
$816,000
Deduct joint costs allocated (from Panel A)
67,200
172,800
240,000
Deduct separable costs
48,000
168,000
216,000
Gross margin
$100,800
$259,200
$360,000
Gross margin percentage
46.7%
43.2%
44.1%
16-14
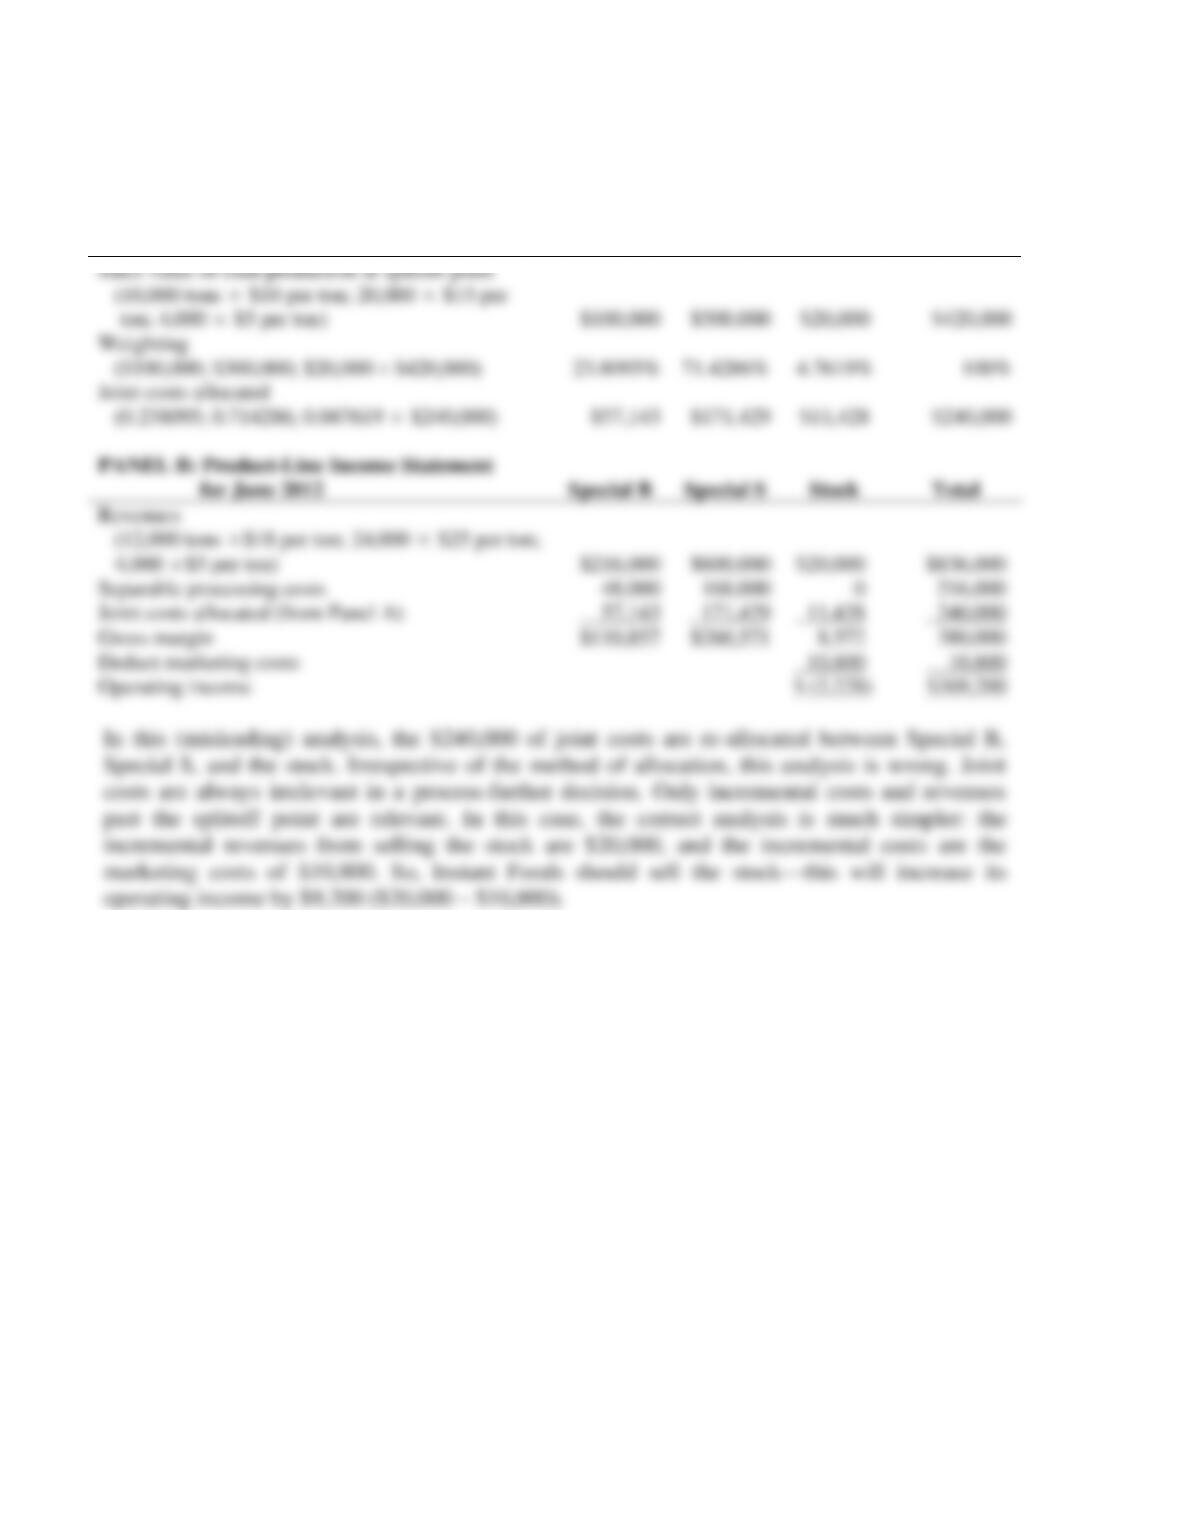
2. Sherrie Dong probably performed the analysis shown below to arrive at the net loss of
$2,228 from marketing the stock:
PANEL A: Allocation of Joint Costs using
Sales Value at Splitoff
Special B/
Beef
Ramen
Special S/
Shrimp
Ramen
Stock
Total
Sales value of total production at splitoff point
(10,000 tons
$10 per ton; 20,000
$15 per
ton; 4,000
$5 per ton)
$100,000
$300,000
$20,000
$420,000
Weighting
($100,000; $300,000; $20,000 ÷ $420,000)
23.8095%
71.4286%
4.7619%
100%
Joint costs allocated
(0.238095; 0.714286; 0.047619
$240,000)
$57,143
$171,429
$11,428
$240,000
PANEL B: Product-Line Income Statement
for June 2012
Special B
Special S
Stock
Total
Revenues
(12,000 tons
$18 per ton; 24,000
$25 per ton;
4,000
$5 per ton)
$216,000
$600,000
$20,000
$836,000
Separable processing costs
48,000
168,000
0
216,000
Joint costs allocated (from Panel A)
57,143
171,429
11,428
240,000
Gross margin
$110,857
$260,571
8,572
380,000
Deduct marketing costs
10,800
10,800
Operating income
$ (2,228)
$369,200
In this (misleading) analysis, the $240,000 of joint costs are re-allocated between Special B,
Special S, and the stock. Irrespective of the method of allocation, this analysis is wrong. Joint
costs are always irrelevant in a process-further decision. Only incremental costs and revenues
past the splitoff point are relevant. In this case, the correct analysis is much simpler: the
incremental revenues from selling the stock are $20,000, and the incremental costs are the
marketing costs of $10,800. So, Instant Foods should sell the stock—this will increase its
operating income by $9,200 ($20,000 – $10,800).
16-15
1.
a. Sales value at splitoff method:
Cookies/
Soymeal
Soyola/
Soy Oil
Total
Sales value of total production at splitoff,
500lbs × $1; 100 gallons × $4
$ 500
$ 400
$900
Weighting, $500; $400
$900
0.556
0.444
Joint costs allocated,
0.556; 0.444 $500
$ 278
$ 222
$500
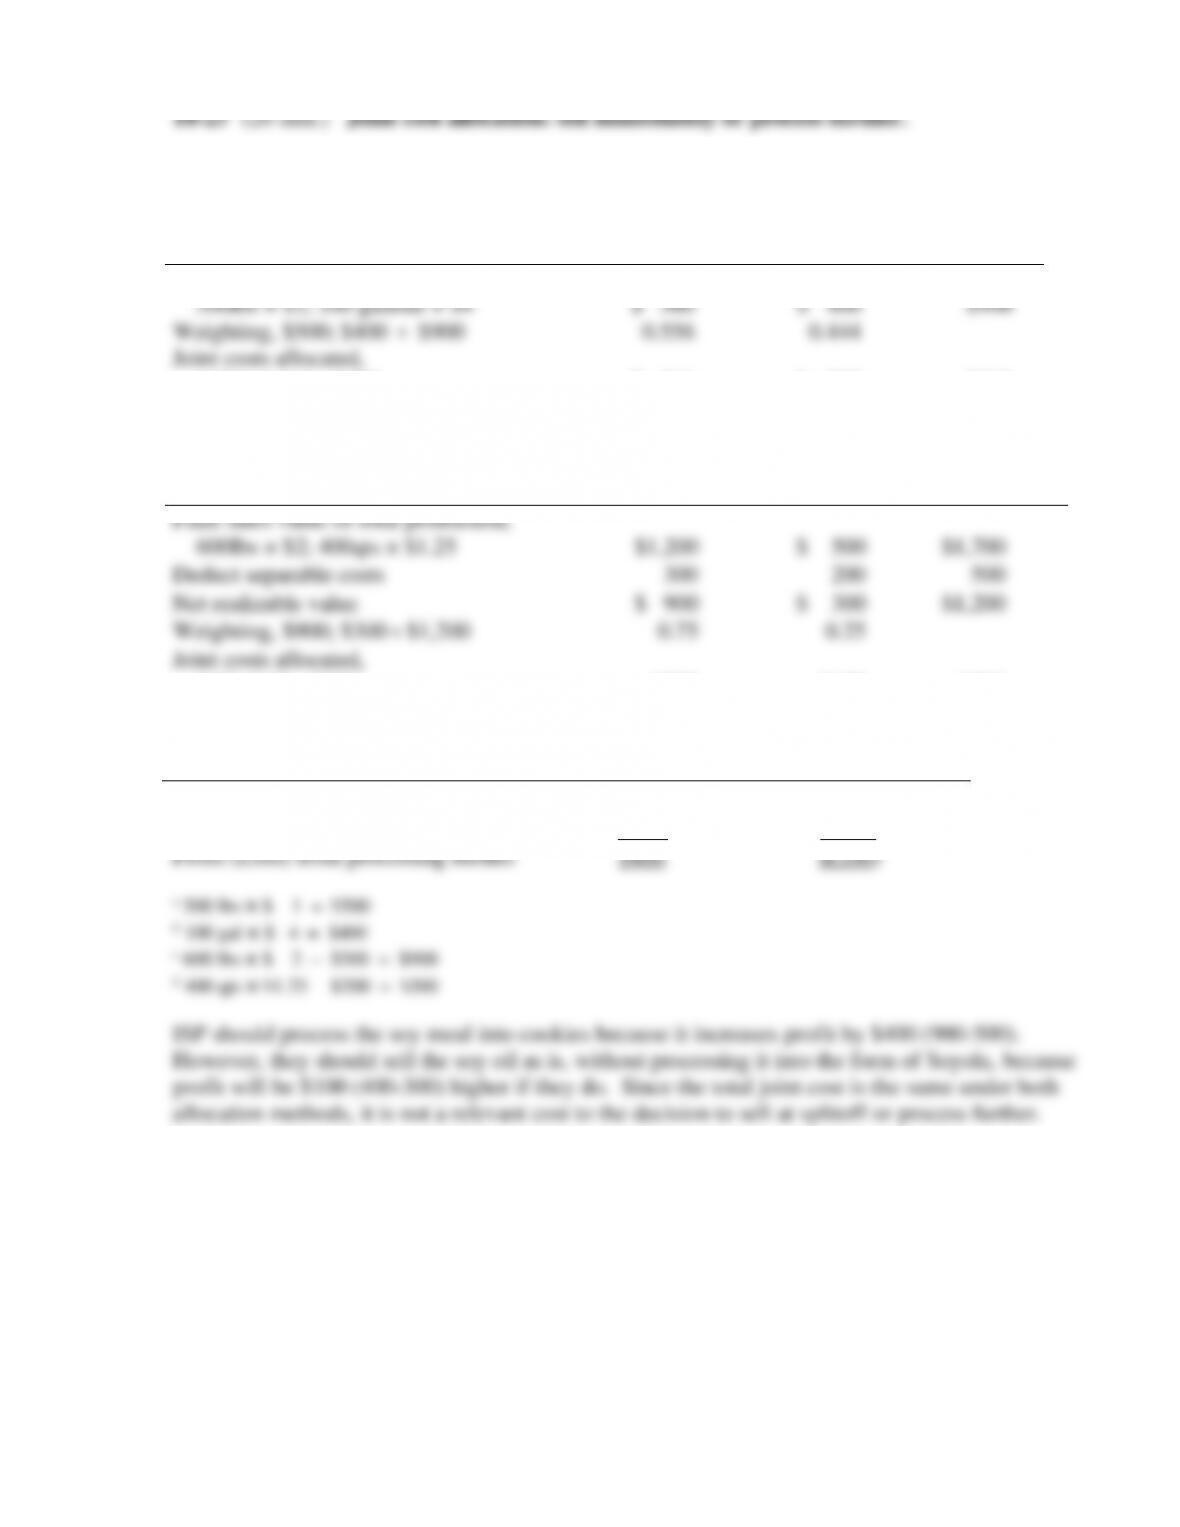
b. Net realizable value method:
Cookies
Soyola
Total
Final sales value of total production,
600lbs × $2; 400qts × $1.25
$1,200
$ 500
$1,700
Deduct separable costs
300
200
500
Net realizable value
$ 900
$ 300
$1,200
Weighting, $900; $300
$1,200
0.75
0.25
Joint costs allocated,
0.75; 0.25 $500
$375
$125
$500
2.
Cookies/Soy Meal
Soyola/Soy Oil
Revenue if sold at splitoff
$500a
$ 400 b
Process further NRV
900 c
300 d
Profit (Loss) from processing further
$400
$(100)
a 500 lbs × $ 1 = $500
b 100 gal × $ 4 = $400
c 600 lbs × $ 2 – $300 = $900
d 400 qts × $1.25 – $200 = $300
ISP should process the soy meal into cookies because it increases profit by $400 (900-500).
However, they should sell the soy oil as is, without processing it into the form of Soyola, because
profit will be $100 (400-300) higher if they do. Since the total joint cost is the same under both
allocation methods, it is not a relevant cost to the decision to sell at splitoff or process further.
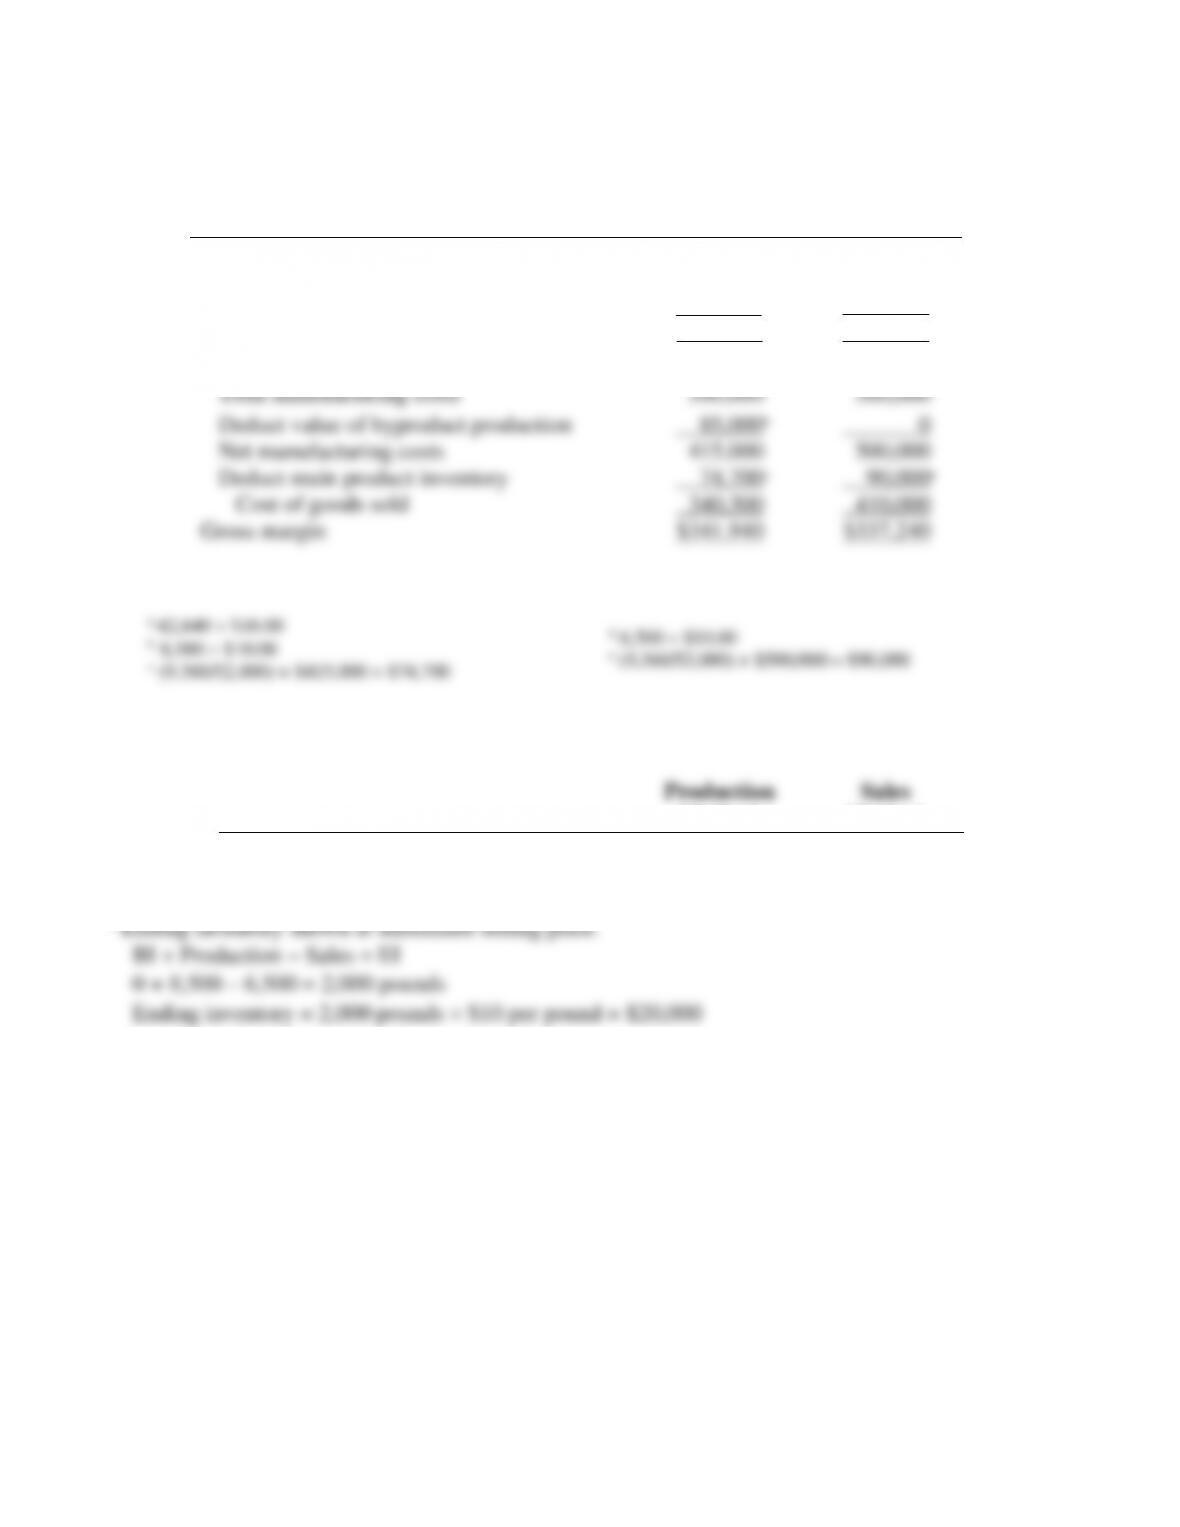
16-24 (30 min.) Accounting for a main product and a byproduct.
Production
Method
Sales
Method
1.
Revenues
Main product
$682,240a
$682,240
Byproduct
––__
65,000d
Total revenues
682,240
747,240
Cost of goods sold
Total manufacturing costs
500,000
500,000
Deduct value of byproduct production
85,000b
0
Net manufacturing costs
415,000
500,000
Deduct main product inventory
74,700c
90,000e
Cost of goods sold
340,300
410,000
Gross margin
$341,940
$337,240
2.
Main Product
$74,700
Byproduct
16-17
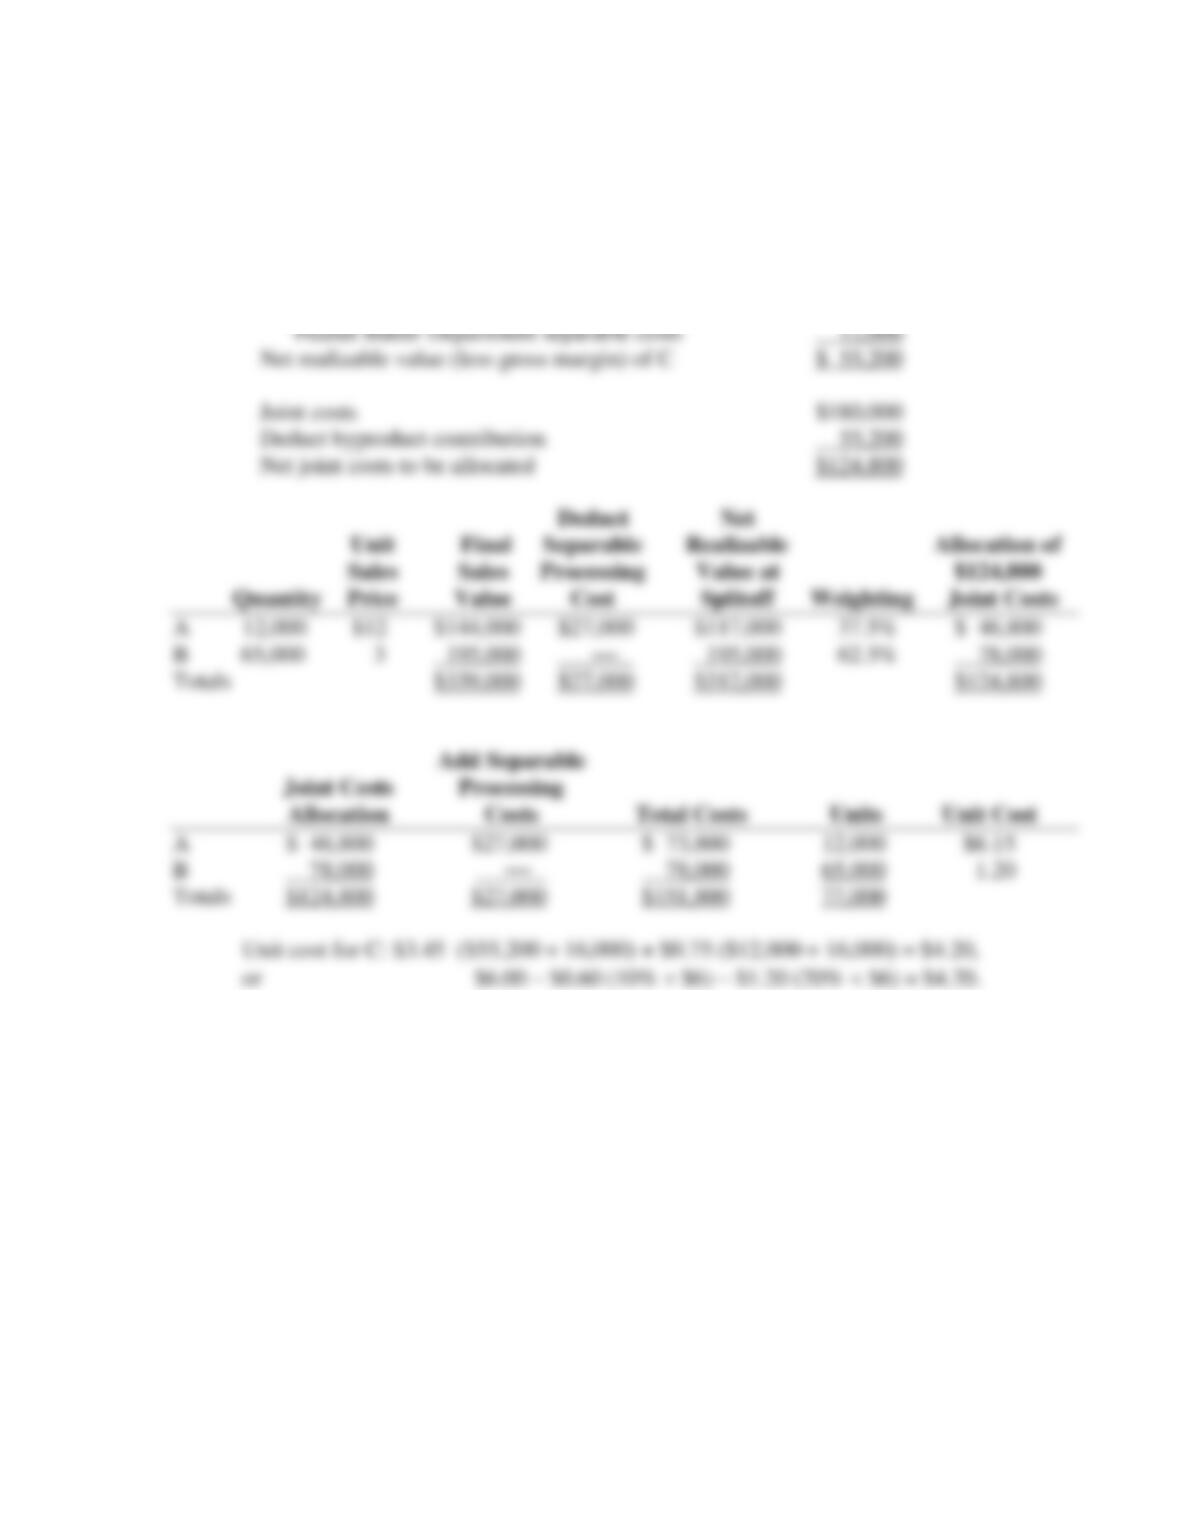
16-25 (35-45 min.) Joint costs and byproducts.
1. Computing byproduct deduction to joint costs:
Revenues from C, 16,000 $6 $ 96,000
Deduct:
Gross margin, 10% of revenues 9,600
Marketing costs, 20% of revenues 19,200
16-18
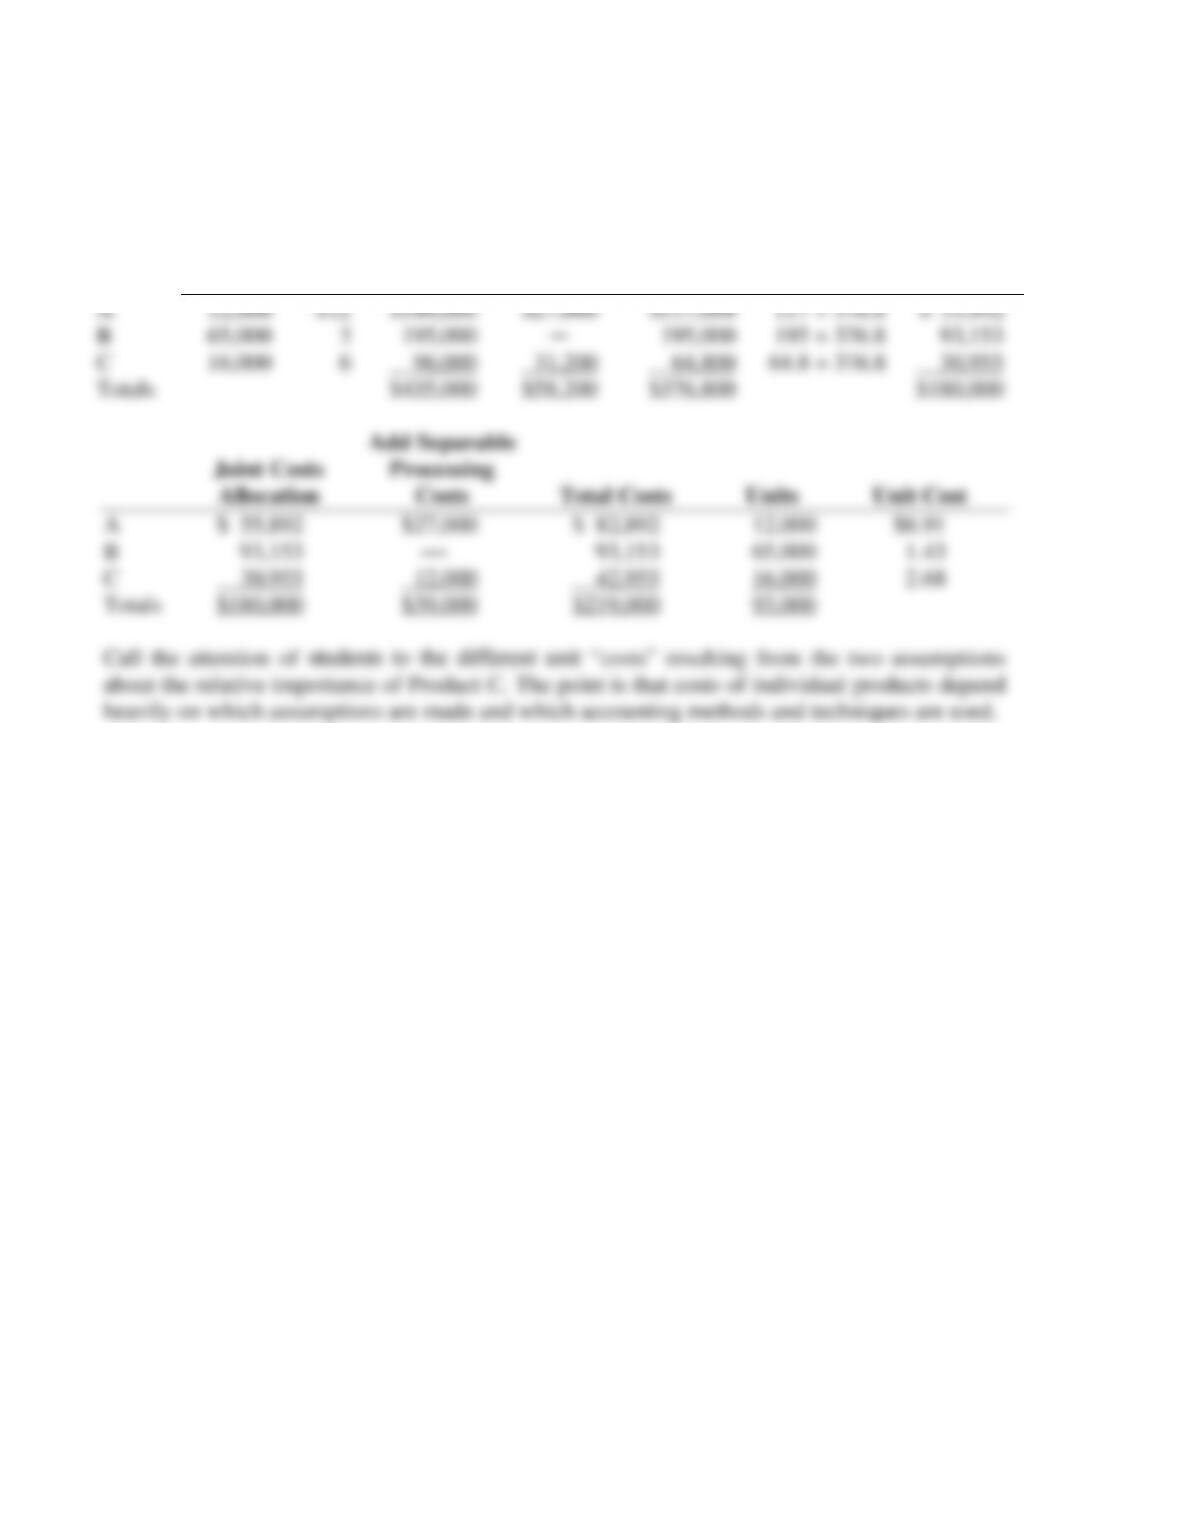
2. If all three products are treated as joint products:
Quantity
Unit
Sales
Price
Final
Sales
Value
Deduct
Separable
Processing
Cost
Net
Realizable
Value at
Splitoff
Weighting
Allocation
of
$180,000
Joint
Costs
A
12,000
$12
$144,000
$27,000
$117,000
117 ÷ 376.8
$ 55,892
B
65,000
3
195,000
─
195,000
195 ÷ 376.8
93,153
C
16,000
6
96,000
31,200
64,800
64.8 ÷ 376.8
30,955
Totals
$435,000
$58,200
$376,800
$180,000
Add Separable
Joint Costs Processing
Allocation Costs Total Costs Units Unit Cost
A $ 55,892 $27,000 $ 82,892 12,000 $6.91
B 93,153 –– 93,153 65,000 1.43
C 30,955 12,000 42,955 16,000 2.68
Totals $180,000 $39,000 $219,000 93,000
Call the attention of students to the different unit “costs” resulting from the two assumptions
about the relative importance of Product C. The point is that costs of individual products depend
heavily on which assumptions are made and which accounting methods and techniques are used.
16-19
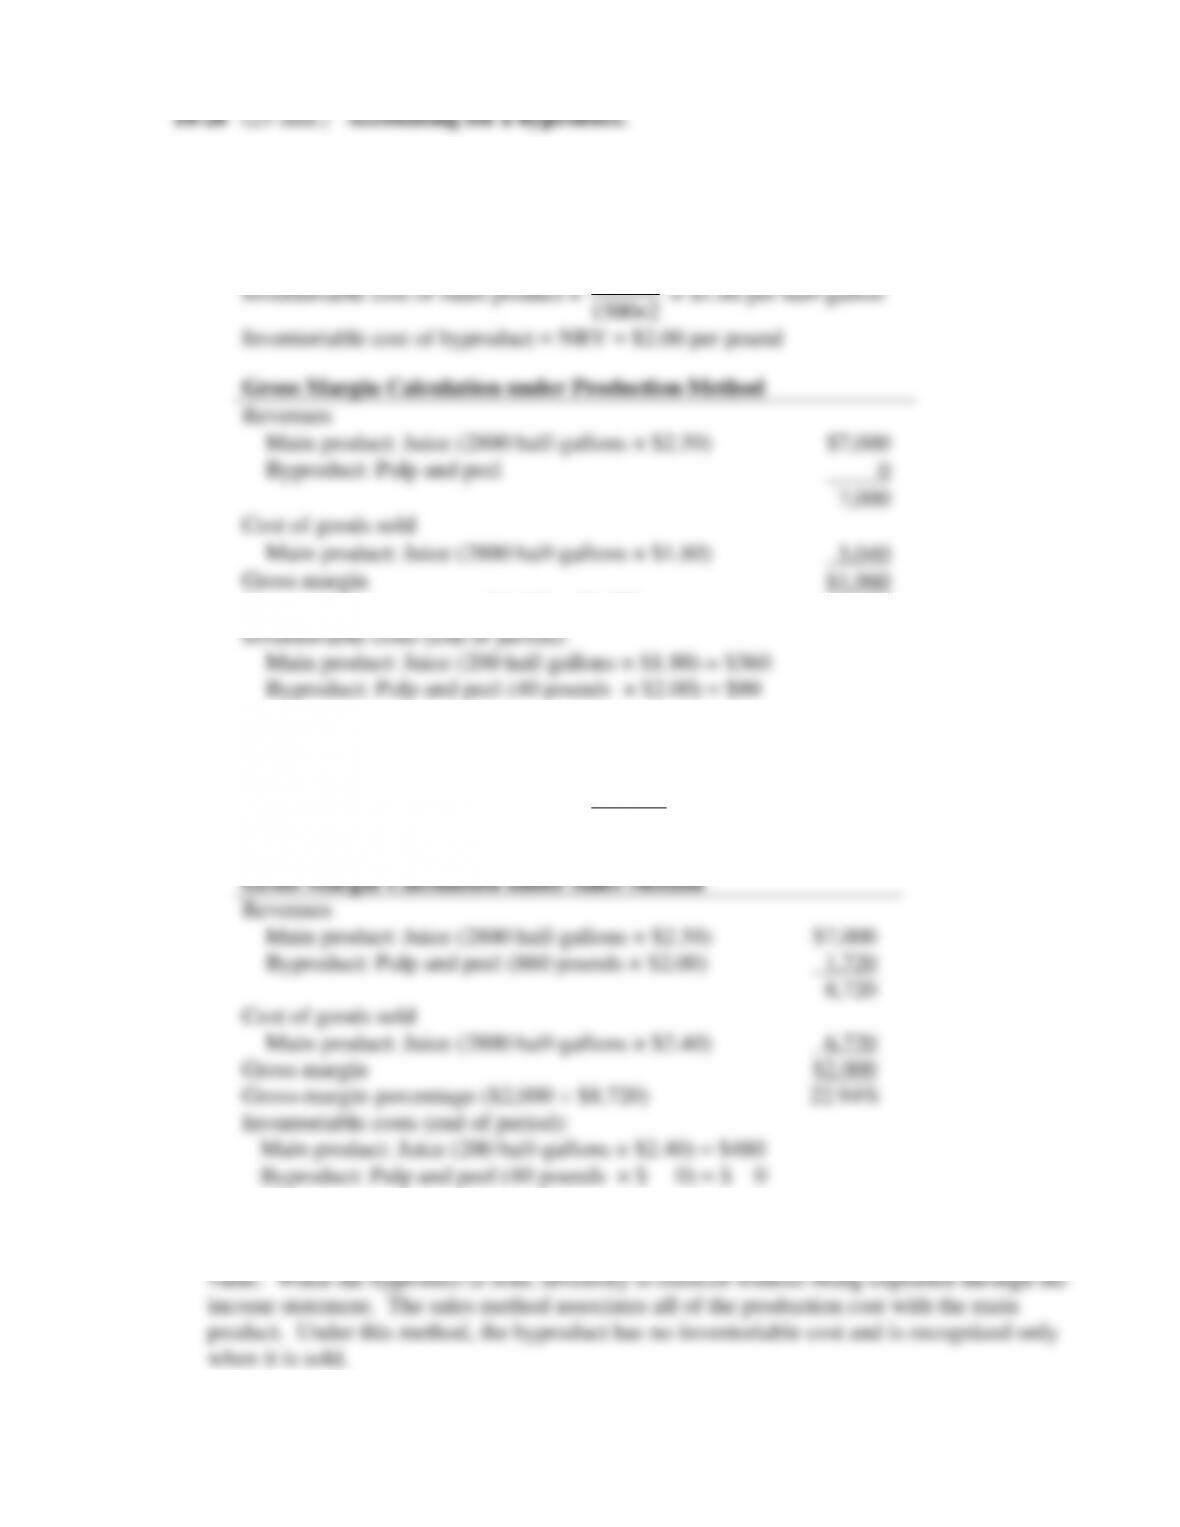
1. Byproduct recognized at time of production:
Joint cost = $7,200
Joint cost to be charged to main product = Joint Cost – NRV of Byproduct = $7,200 – (900 lbs. × $2)
= $5,400
$5400
1500×2
Inventoriable cost of byproduct = NRV = $2.00 per pound
Gross Margin Calculation under Production Method
Revenues
Main product: Juice (2800 half-gallons × $2.50)
$7,000
Byproduct: Pulp and peel
0
7,000
Cost of goods sold
Main product: Juice (2800 half-gallons × $1.80)
5,040
Gross margin
$1,960
Gross-margin percentage ($1,960 ÷ $7,000)
28.00%
2. Byproduct recognized at time of sale:
Joint cost to be charged to main product = Total joint cost = $7,200
Inventoriable cost of main product =
$7,200
1,500×2
= $2.40 per half-gallon
Inventoriable cost of byproduct = $0
Gross Margin Calculation under Sales Method
Revenues
Main product: Juice (2800 half-gallons × $2.50)
$7,000
Byproduct: Pulp and peel (860 pounds × $2.00)
1,720
8,720
Cost of goods sold
Main product: Juice (2800 half-gallons × $2.40)
6,720
Gross margin
$2,000
Gross-margin percentage ($2,000 ÷ $8,720)
22.94%
Inventoriable costs (end of period):
Main product: Juice (200 half-gallons × $2.40) = $480
Byproduct: Pulp and peel (40 pounds × $ 0) = $ 0
3. The production method recognizes the byproduct cost as inventory in the period it is
produced. This method sets the cost of the byproduct inventory equal to its net realizable
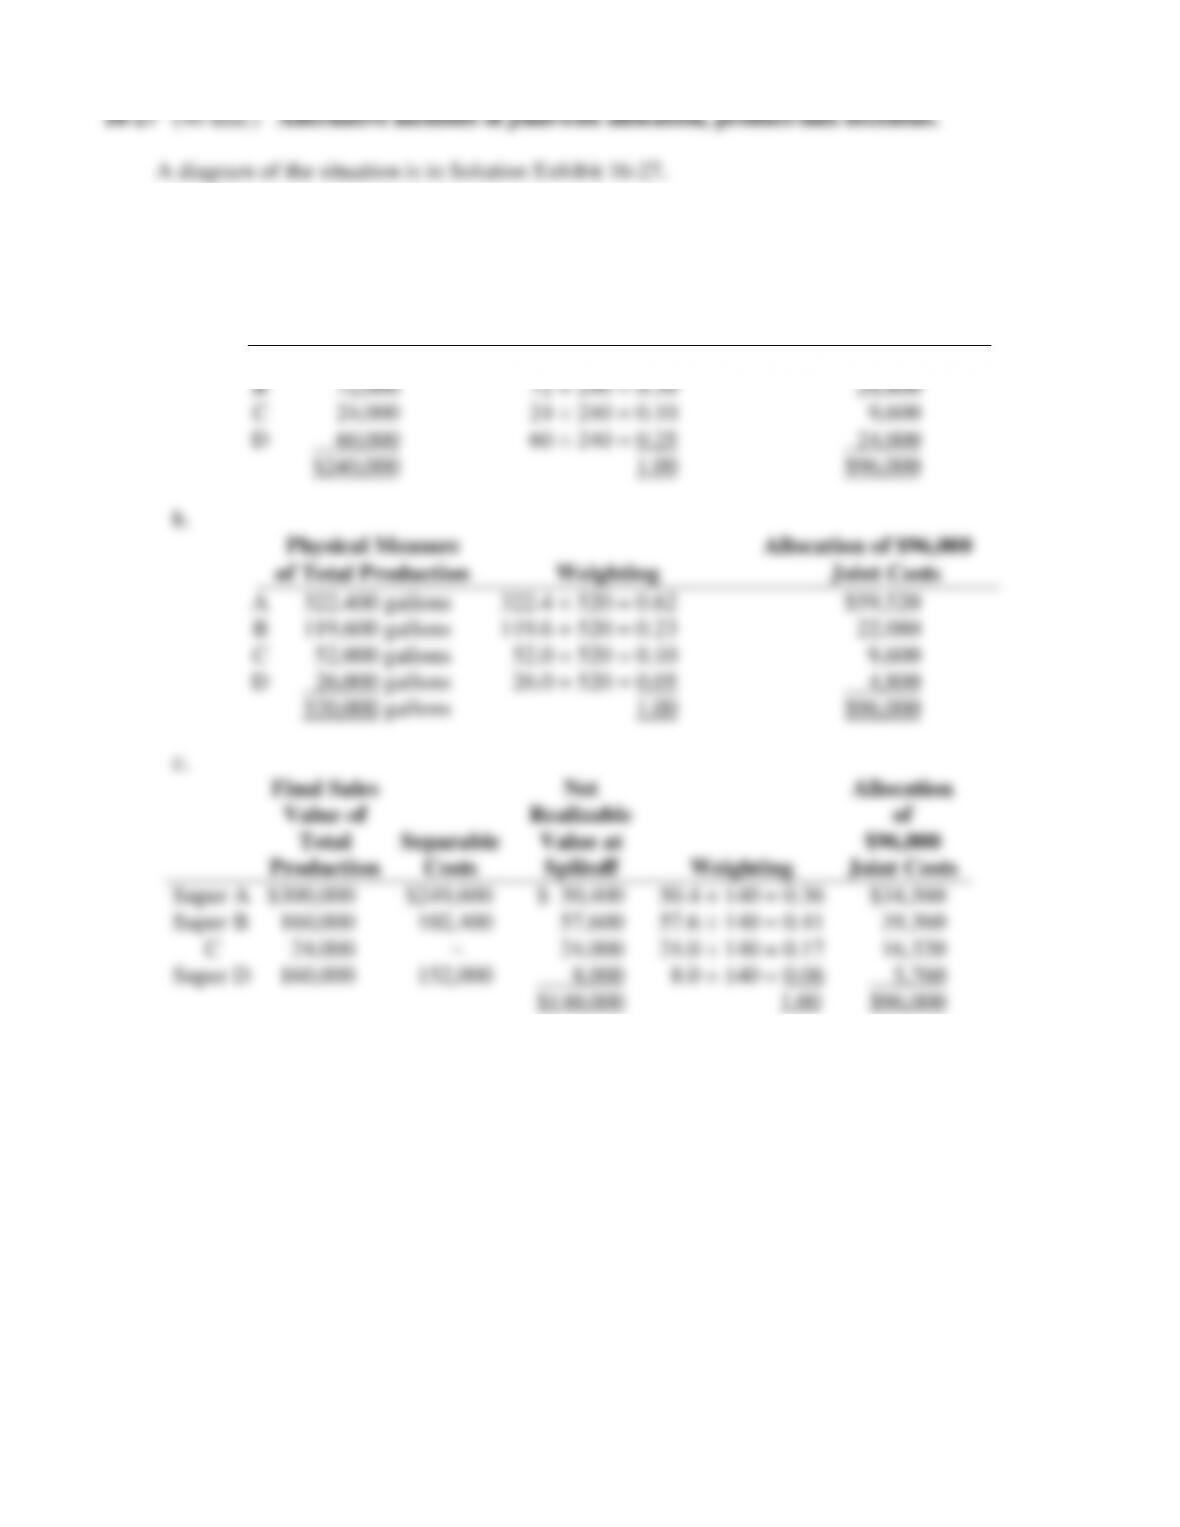
1. Computation of joint-cost allocation proportions:
a. Sales Value of
Total Production Allocation of $96,000
at Splitoff Weighting Joint Costs
A $ 84,000 84 ÷ 240 = 0.35 $33,600