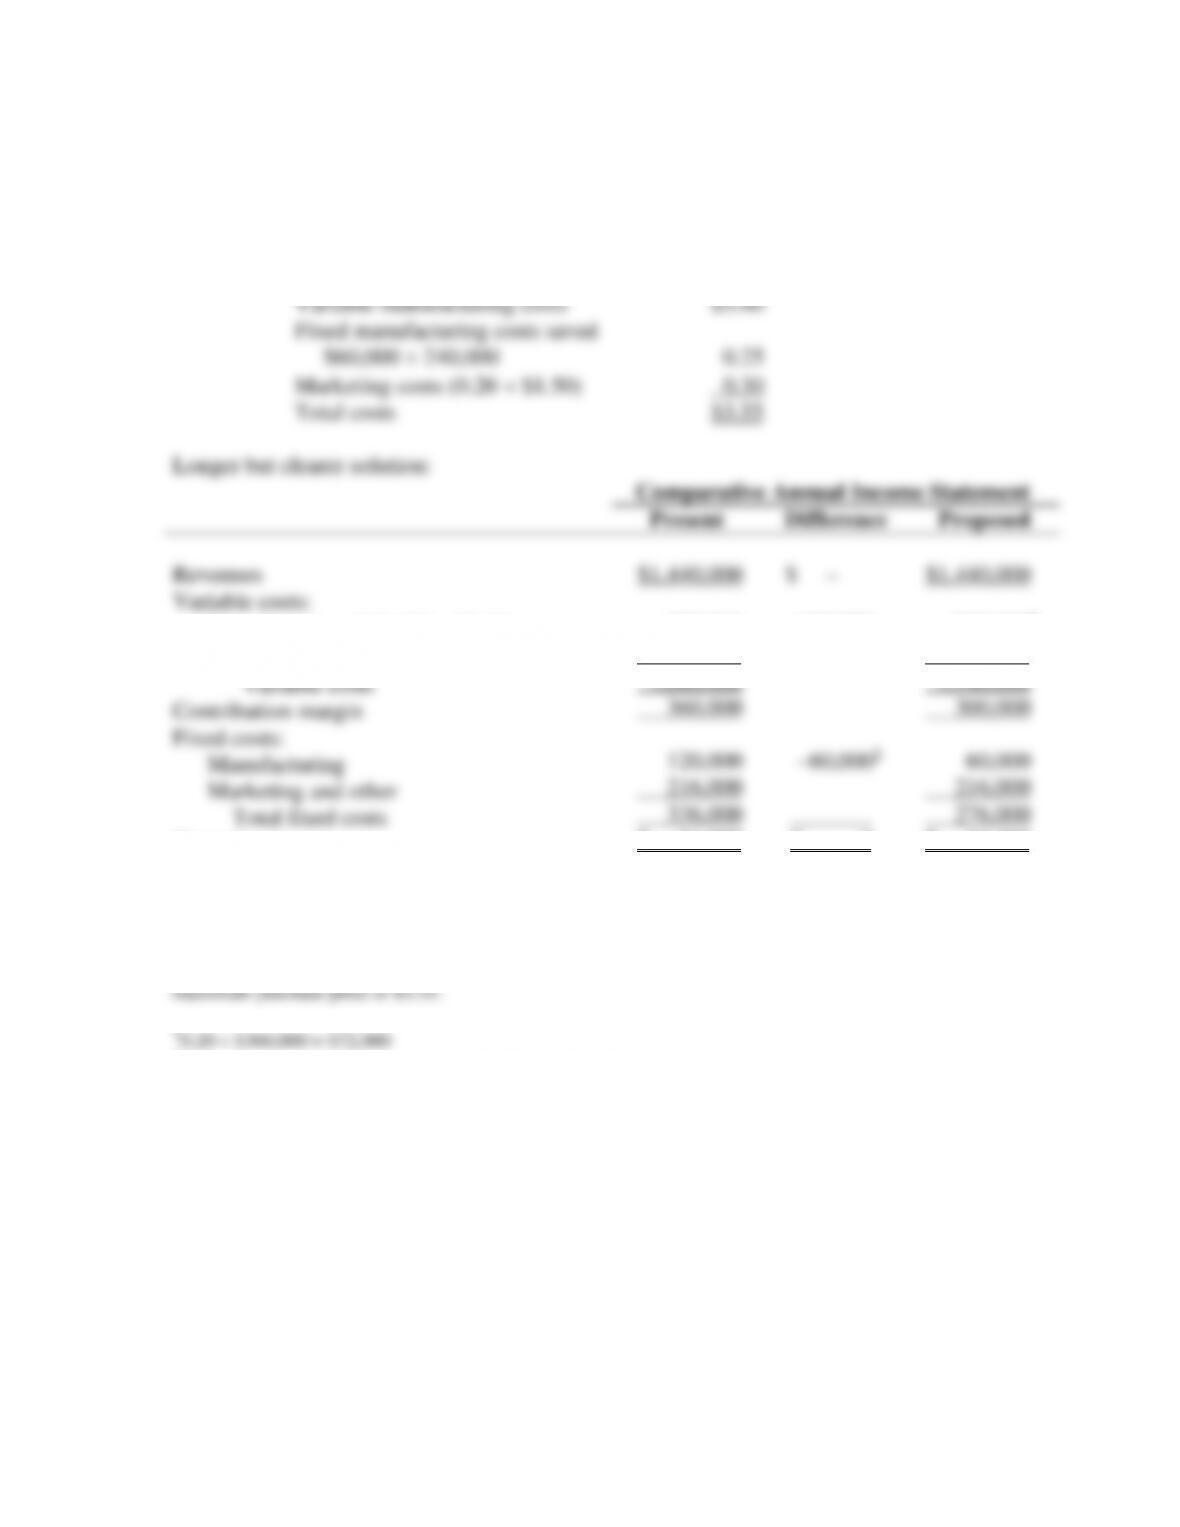
7. (e) None of these. The correct answer is $3.55. This part always gives students trouble.
The short-cut solution below is followed by a longer solution that is helpful to students.
Short-cut solution:
The highest price to be paid would be measured by those costs that could be avoided by
halting production and subcontracting:
11-32
11-38 (25 min.) Closing down divisions.
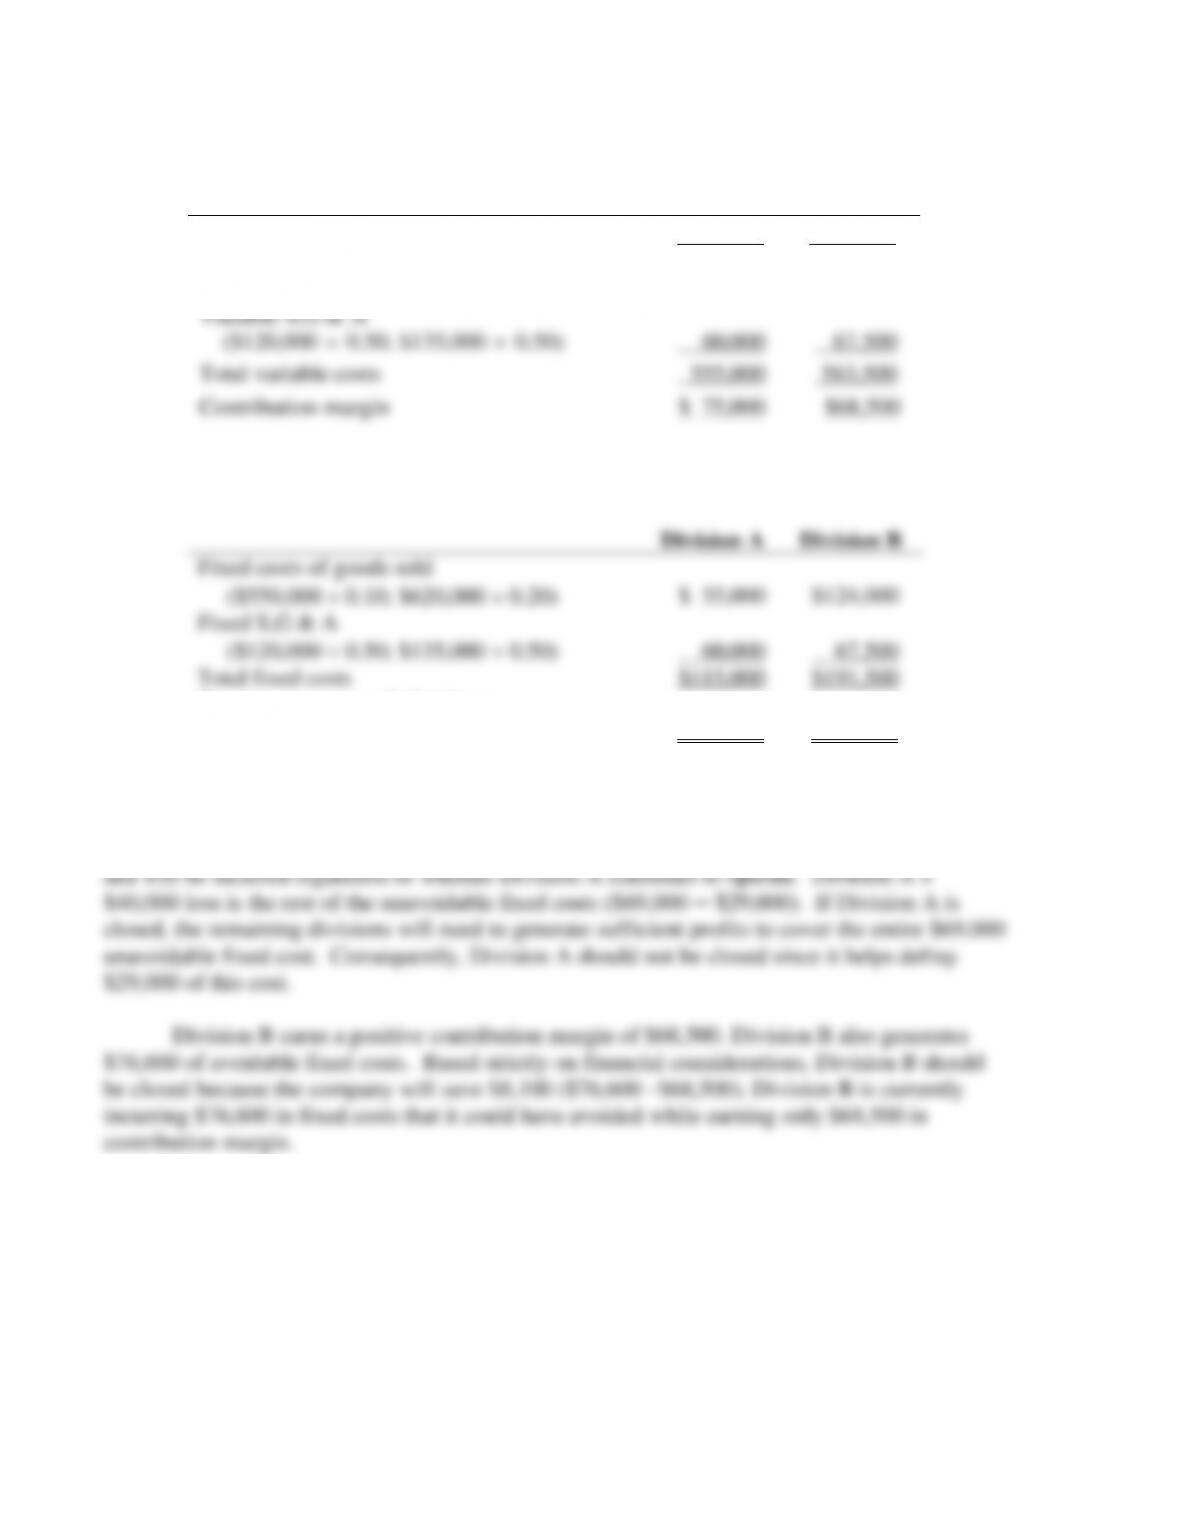
1. and 2.
Division A
Division B
Sales
$630,000
$632,000
Variable costs of goods sold
($550,000
0.90; $620,000
0.80)
495,000
496,000
Variable S,G & A
($120,000
0.50; $135,000
0.50)
60,000
67,500
Total variable costs
555,000
563,500
Contribution margin
$ 75,000
$68,500
Division A
Division B
Fixed costs of goods sold
($550,000 0.10; $620,000 0.20)
$ 55,000
$124,000
Fixed S,G & A
($120,000 0.50; $135,000 0.50)
60,000
67,500
Total fixed costs
$115,000
$191,500
Fixed costs savings if shutdown
($115,000
0.40; $191,500
0.40)
$ 46,000
$ 76,600
Division A’s contribution margin of $75,000 more than covers its avoidable fixed costs
of $46,000. The difference of $29,000 helps cover the company’s unavoidable fixed costs.
Since $46,000 of Division A’s fixed costs are avoidable, the remaining $69,000 is unavoidable
11-33
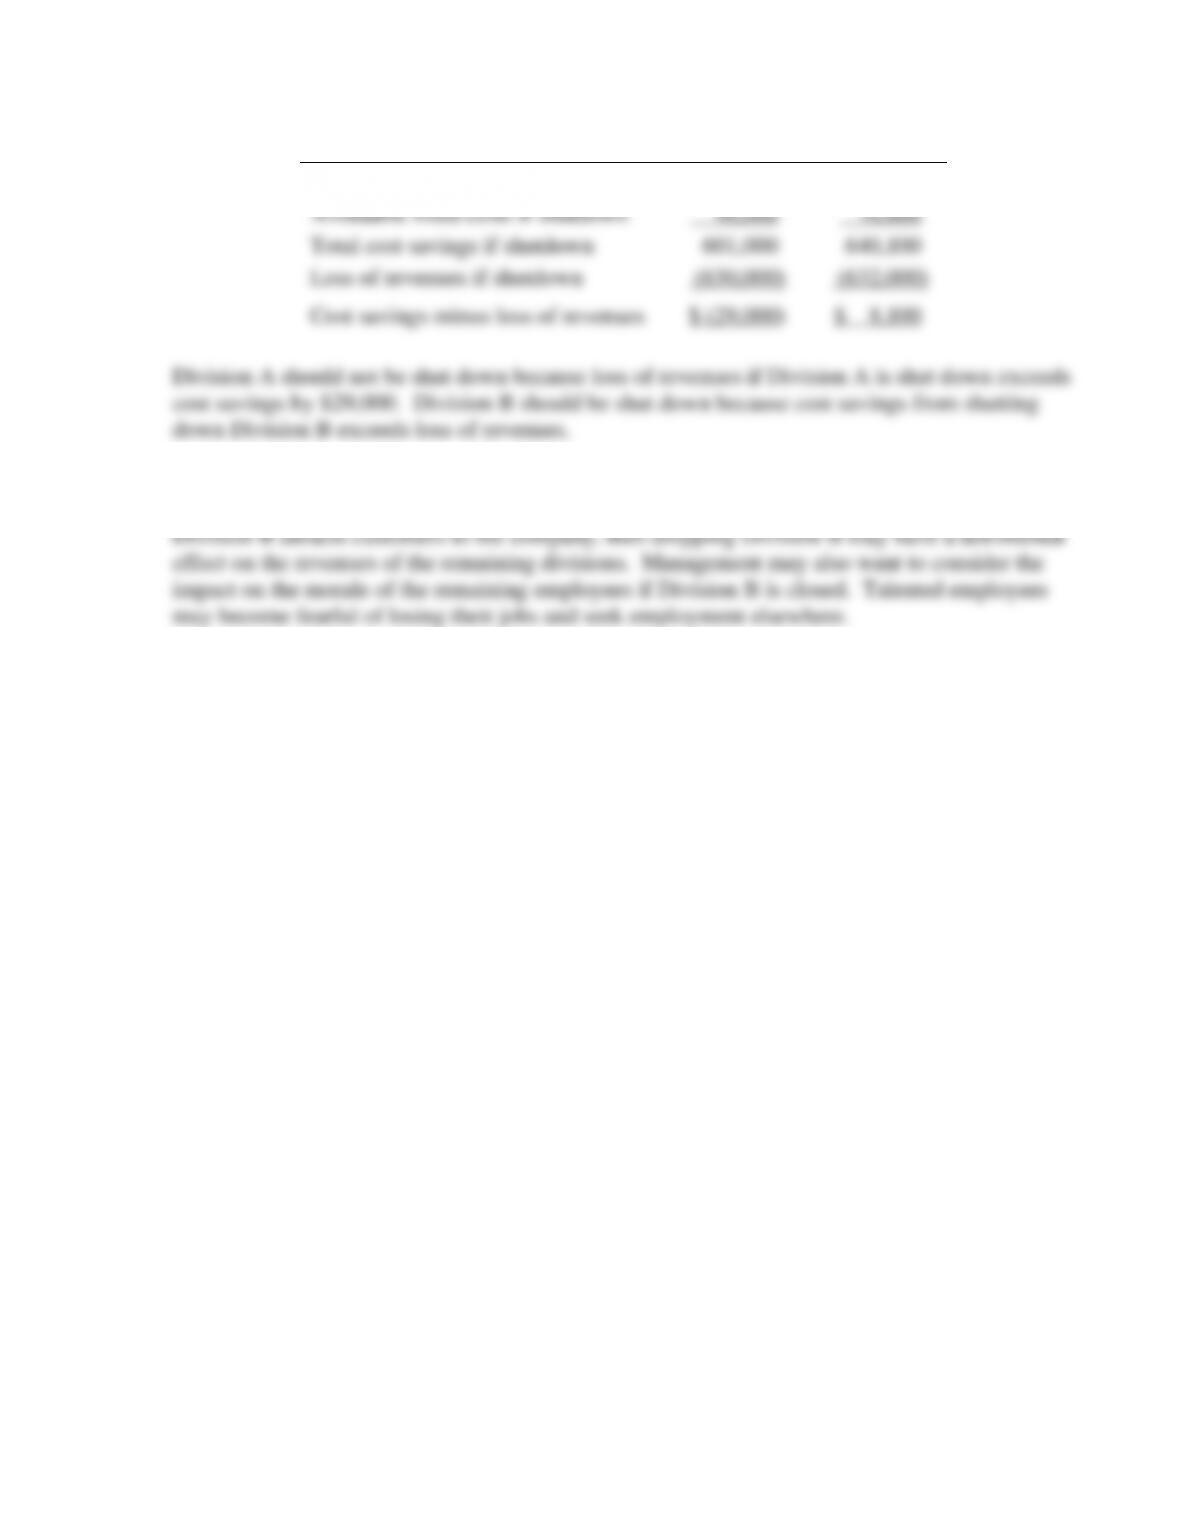
An alternative set of calculations is as follows:
Division A
Division B
Total variable costs
$555,000
$563,500
Avoidable fixed costs if shutdown
46,000
76,600
Total cost savings if shutdown
601,000
640,100
Loss of revenues if shutdown
(630,000)
(632,000)
Cost savings minus loss of revenues
$ (29,000)
$ 8,100
Division A should not be shut down because loss of revenues if Division A is shut down exceeds
cost savings by $29,000. Division B should be shut down because cost savings from shutting
down Division B exceeds loss of revenues.
3. Before deciding to close Division B, management should consider the role that the Division’s
product line plays relative to other product lines. For instance, if the product manufactured by
11-39 (25 min.) Product mix, constrained resource.
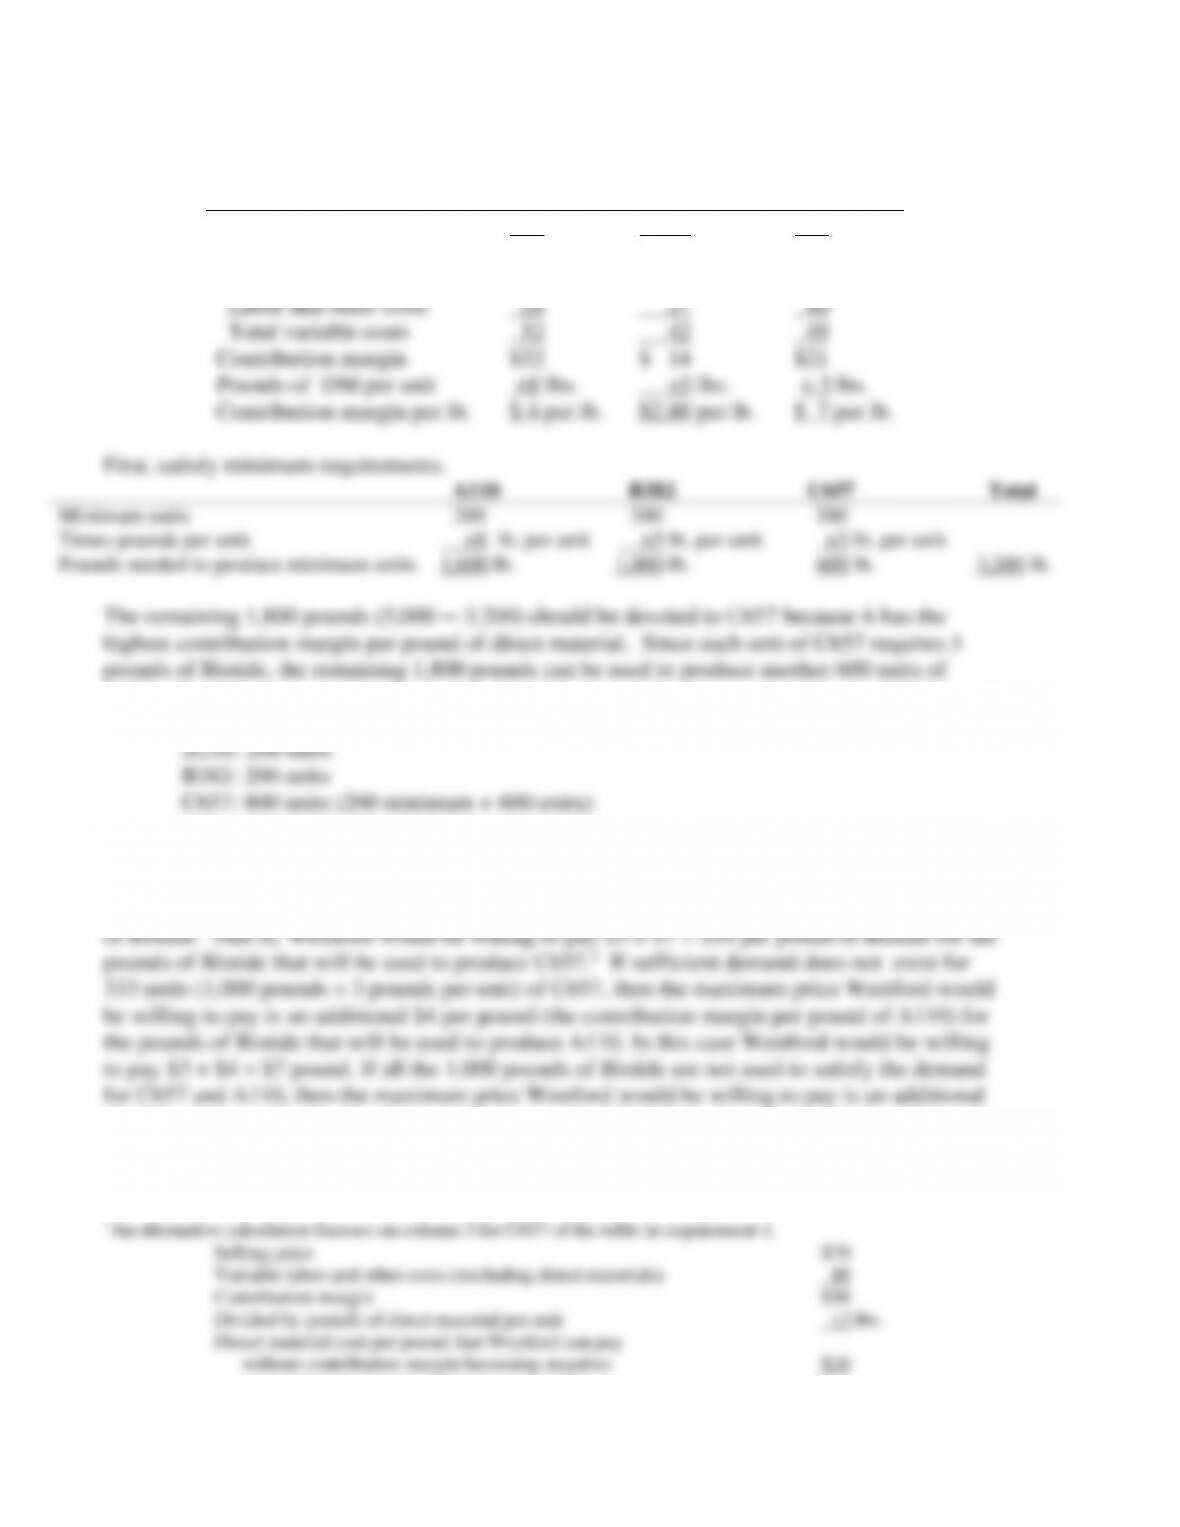
1.
A110
B382
C657
Selling price
$84
$ 56
$70
Variable costs:
Direct materials (DM)
24
15
9
Labor and other costs
28
27
40
Total variable costs
52
42
49
Contribution margin
$32
$ 14
$21
Pounds of DM per unit
÷8 lbs.
÷5 lbs.
÷ 3 lbs.
Contribution margin per lb.
$ 4 per lb.
$2.80 per lb.
$ 7 per lb.
First, satisfy minimum requirements.
A110
B382
C657
Total
Minimum units
200
200
200
Times pounds per unit
×8 lb. per unit
×5 lb. per unit
×3 lb. per unit
Pounds needed to produce minimum units
1,600 lb.
1,000 lb.
600 lb.
3,200 lb.
The remaining 1,800 pounds (5,000 ─ 3,200) should be devoted to C657 because it has the
highest contribution margin per pound of direct material. Since each unit of C657 requires 3
pounds of Bistide, the remaining 1,800 pounds can be used to produce another 600 units of
C657. The following combination yields the highest contribution margin given the 5,000 pounds
constraint on availability of Bistide.
2. The demand for Westford’s products exceeds the materials available. Assuming that fixed
costs are covered by the original product mix, Westford would be willing to pay up to an
additional $7 per pound (the contribution margin per pound of C657) for another 1,000 pounds
$2.80 per pound (the contribution margin per pound of B382) for the pounds of Bistide that will
be used to produce B382. Westford would be willing to pay $2.80 + $3 = $5.80 per pound of
Bistide.
11-35
11-40 (30–40 min.) Optimal product mix.
1. Let D represent the batches of Della’s Delight made and sold.
Let B represent the batches of Bonny’s Bourbon made and sold.
The contribution margin per batch of Della’s Delight is $300.
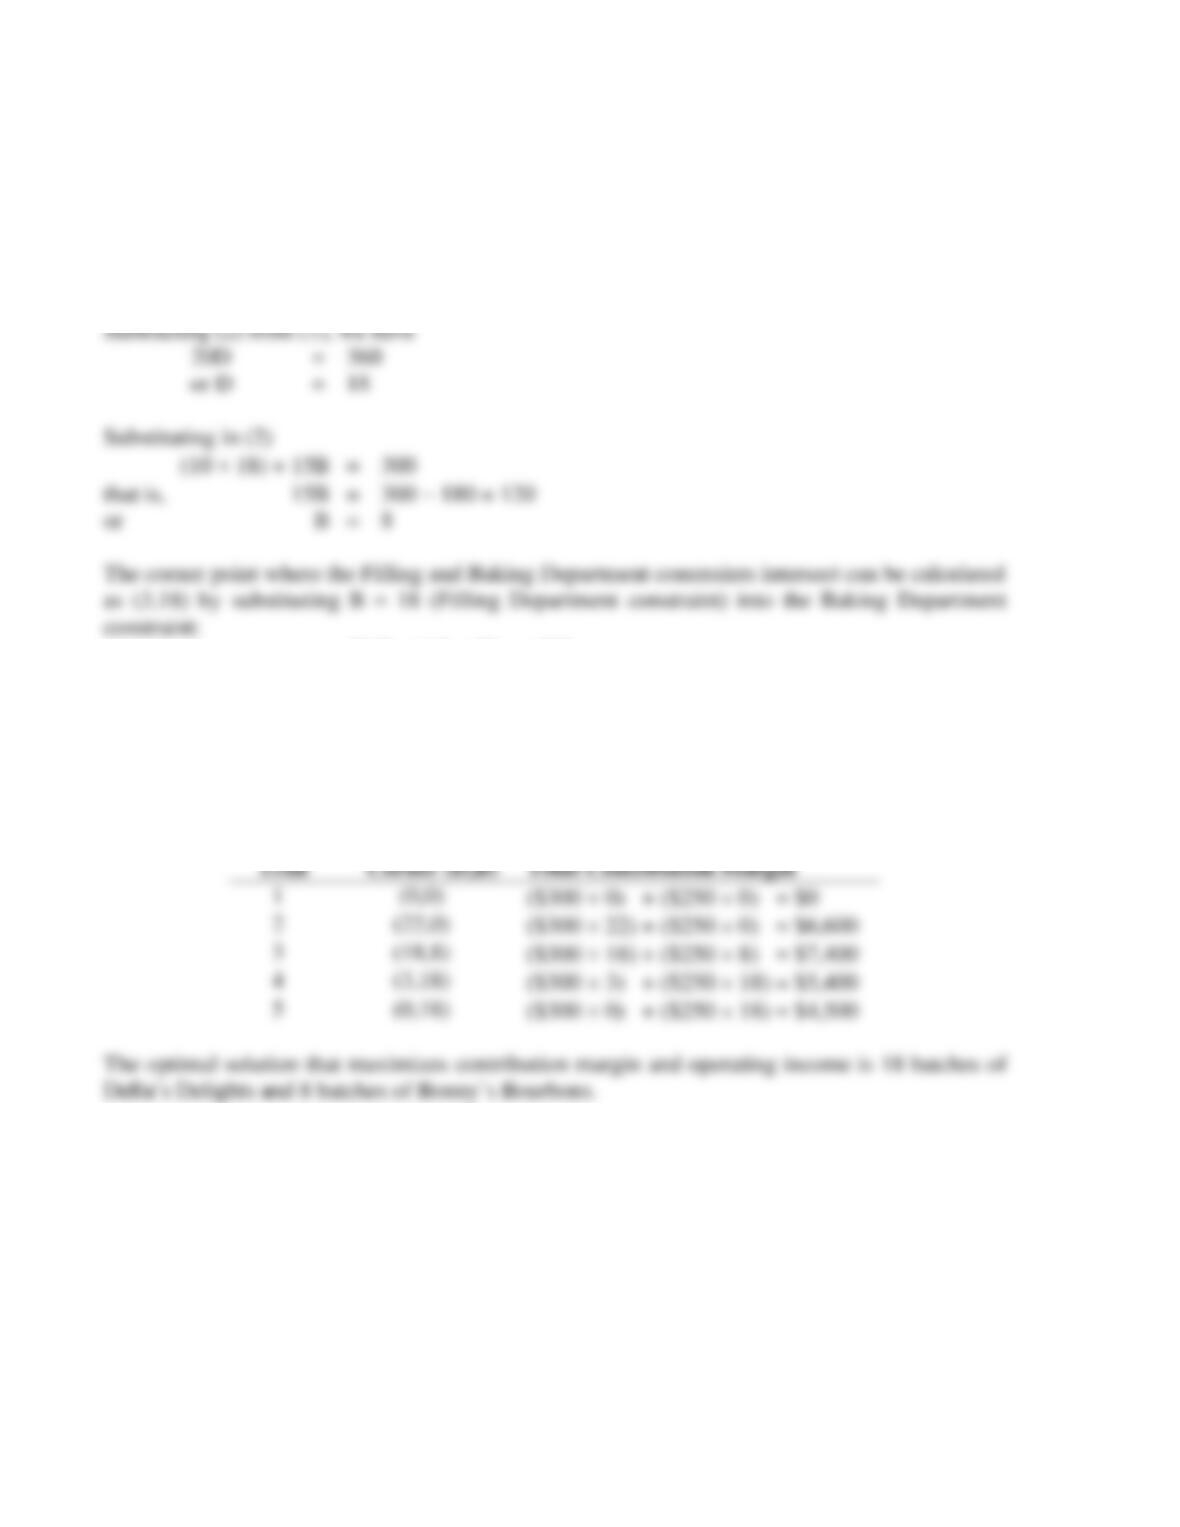
2. Solution Exhibit 11-40 presents a graphical summary of the relationships. The optimal
corner is the point (18, 8) i.e., 18 batches of Della’s Delights and 8 of Bonny’s Bourbons.
SOLUTION EXHIBIT 11-40
Graphic Solution to Find Optimal Mix, Della Simpson, Inc.
3, 18
0, 18
0, 44
22, 0
Della Simpson Production Model
0
5
10
15
20
25
30
35
40
45
50
0
5
10
15
20
25
30
35
40
D (batches of Della‘s Delight)
B (batches of Bonny’s Bourbons)
Filling Dept. Constraint
Mixing Dept. Constraint
Baking Dept. Constraint
Equal Contribution
Margin Lines
Optimal Corner (18,8)
Feasible Region
11-36
We next calculate the optimal production mix using the trial-and-error method.
The corner point where the Mixing Dept. and Baking Dept. constraints intersect can be
calculated as (18, 8) by solving:
30D + 15B = 660 (1) Mixing Dept. constraint
10D + 15B = 300 (2) Baking Dept. constraint
10 D + (15
18) = 300
10 D = 300 − 270 = 30
D = 3
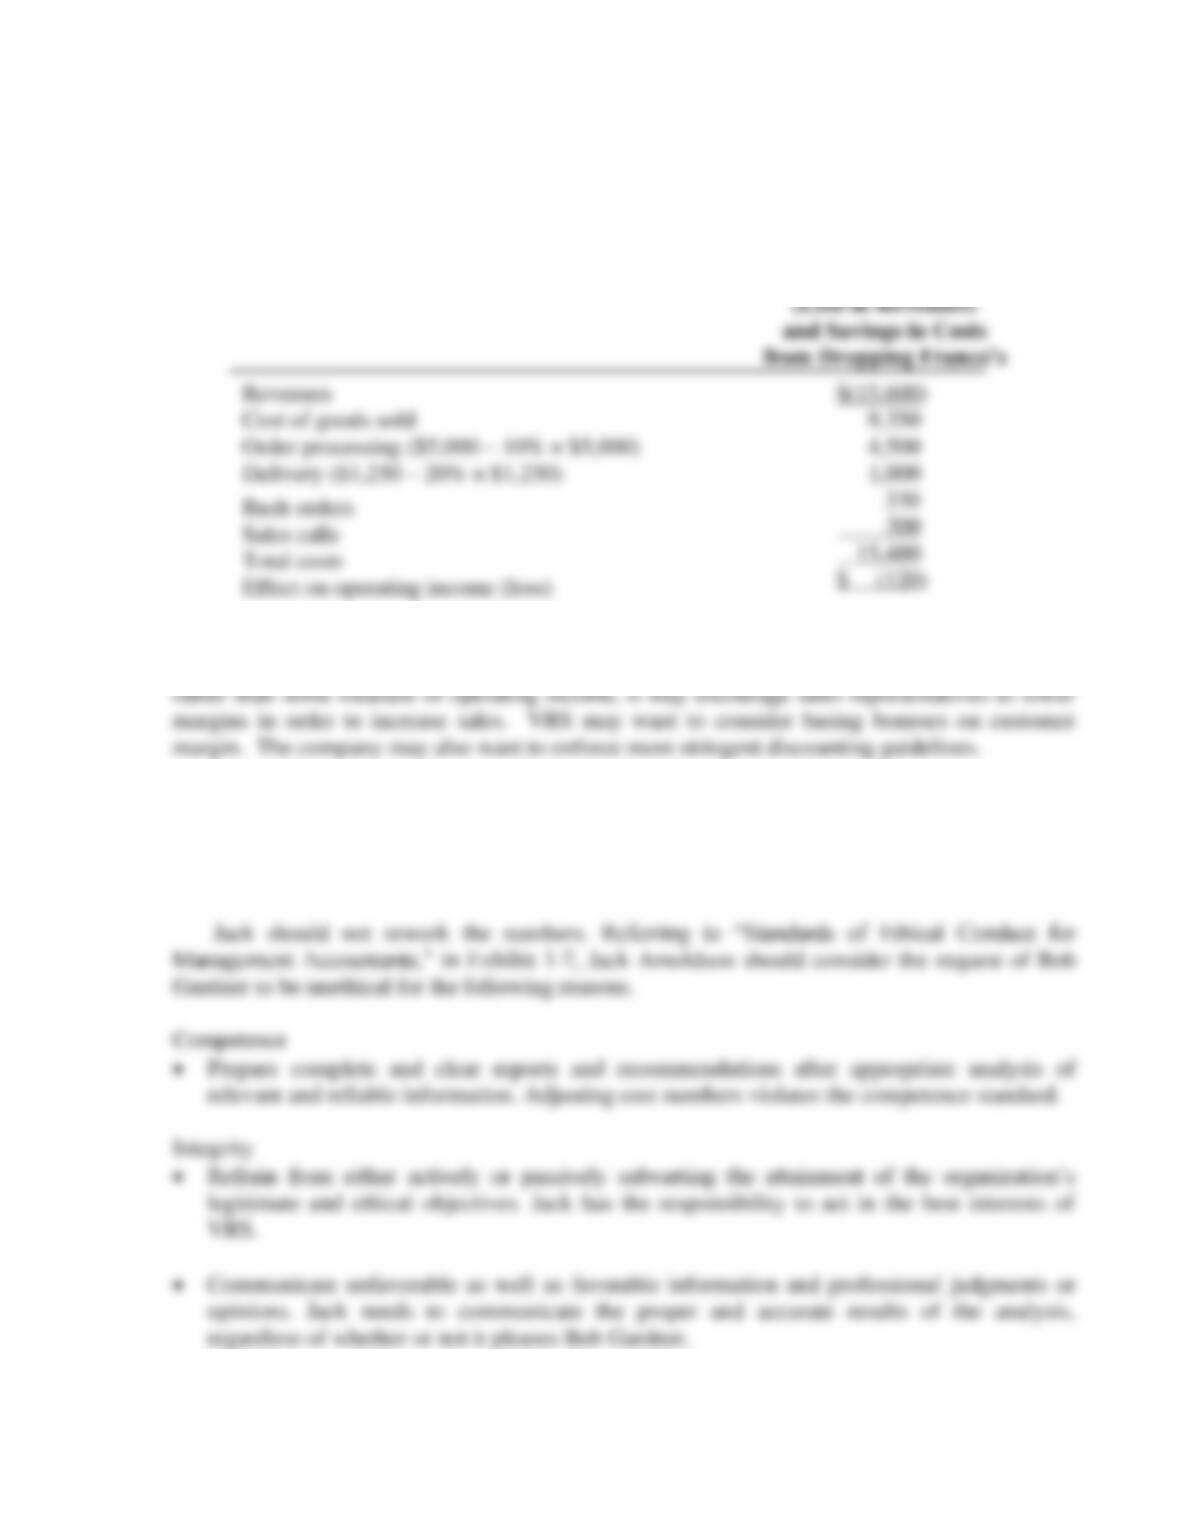
The feasible region, defined by 5 corner points, is shaded in Solution Exhibit 11-40. We next use
the trial-and-error method to check the contribution margins at each of the five corner points of
the area of feasible solutions.
Trial
Corner (D,B)
Total Contribution Margin
1
(0,0)
($300 0) + ($250 0) = $0
2
(22,0)
($300 22) + ($250 0) = $6,600
3
(18,8)
($300 18) + ($250 8) = $7,400
4
(3,18)
($300 3) + ($250 18) = $5,400
5
(0,18)
($300 0) + ($250 18) = $4,500
The optimal solution that maximizes contribution margin and operating income is 18 batches of
Della’s Delights and 8 batches of Bonny’s Bourbons.
11-37
11-41 (25 min.) Dropping a customer, activity-based costing, ethics.
1. VRS would not benefit from dropping Franco’s because it would lose $15,600 in revenues
and save $15,480 in costs resulting in a $120 decrease in operating income.
Difference:
Incremental
(Loss in Revenues)
and Savings in Costs
from Dropping Franco’s
Revenues
Cost of goods sold
Order processing ($5,000 – 10% × $5,000)
Delivery ($1,250 – 20% × $1,250)
Rush orders
Sales calls
Total costs
Effect on operating income (loss)
$(15,600)
9,350
4,500
1,000
330
300
15,480
$ (120)
2. The drop in gross margin percentage indicates that Jack may be giving Franco’s excessive
discounts, perhaps in excess of company guidelines. If VRS awards bonuses based on sales
3. Jack could suggest that Bob approach Franco’s about reducing the number of different orders
that they place. If the orders could be placed less frequently, the company could reduce both
order processing and delivery costs. Bob could also investigate the causes of the rush orders to
see if they could be avoided.
11-38
• Refrain from engaging in or supporting any activity that would discredit the profession.
Falsifying the analysis would discredit Jack and the profession.
Credibility
• Communicate information fairly and objectively. Jack needs to perform an objective analysis
11-39
11-42 (30 min.) Equipment replacement decisions and performance evaluation.
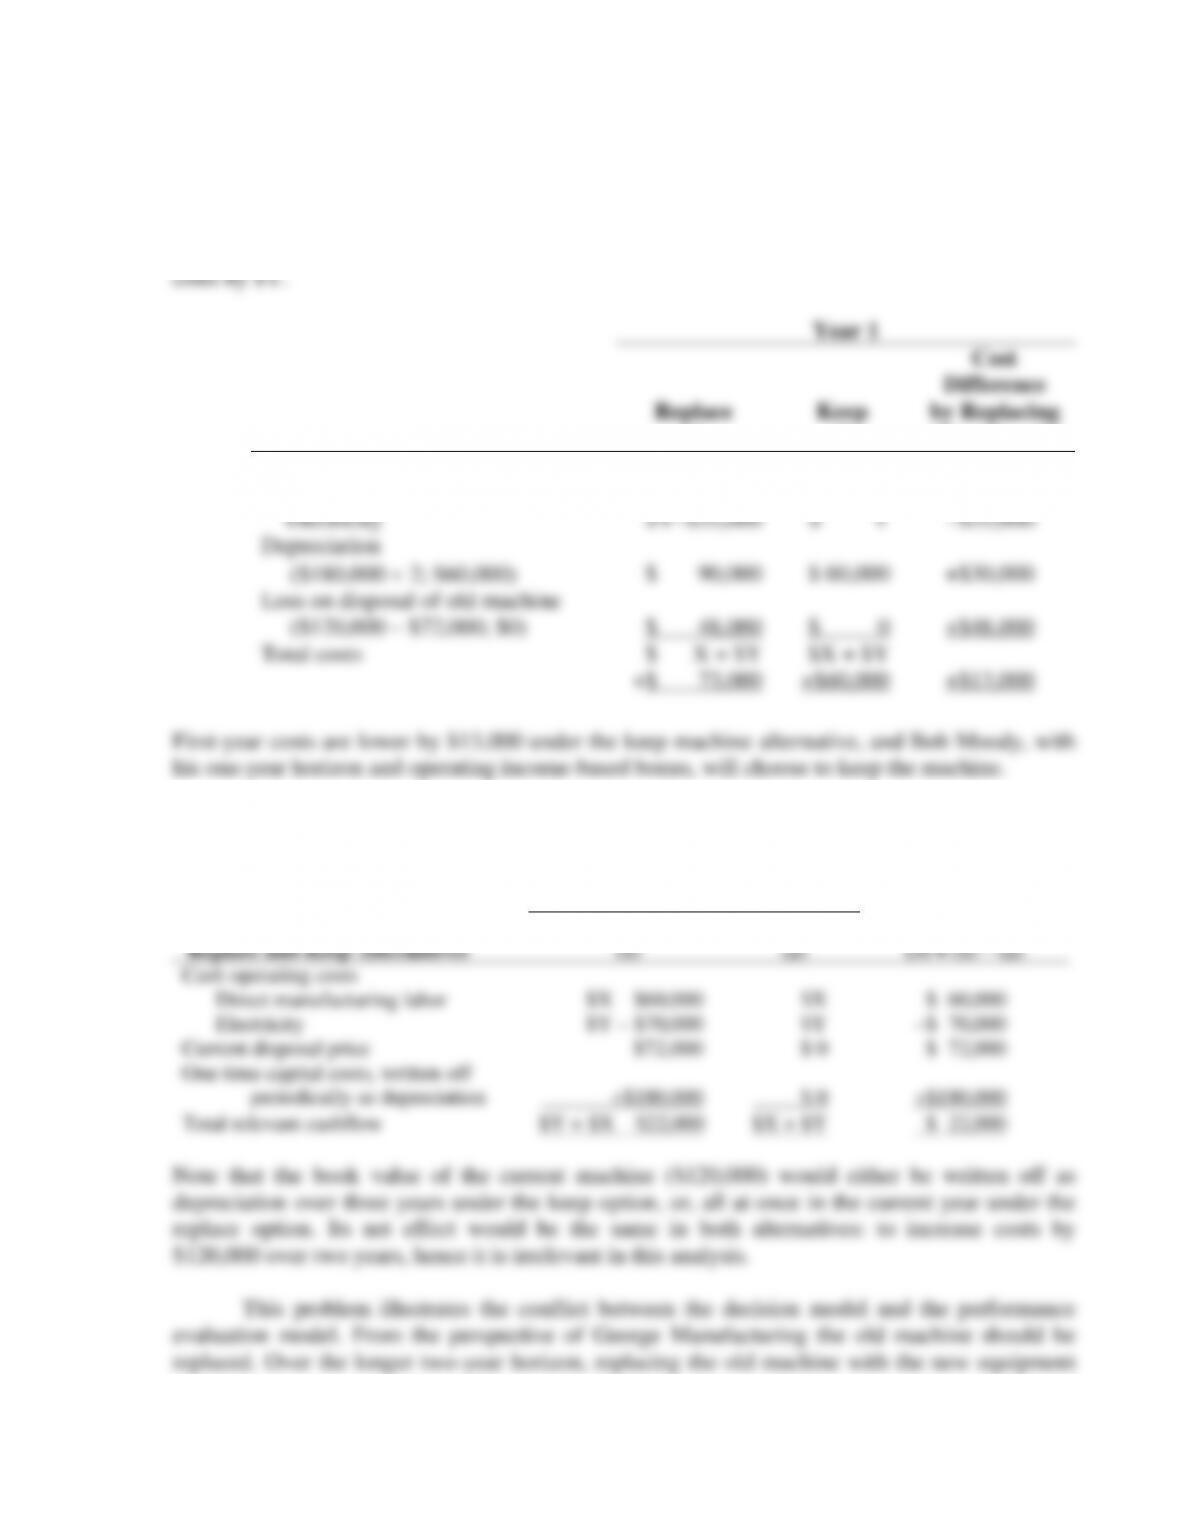
1. Operating income for the first year under the keep and replace alternatives are shown
below:
Denote the current direct manufacturing labor costs by $X and the current electricity
Year 1
Replace
Keep
Cost
Difference
by Replacing
(1)
(2)
(3) = (1) – (2)
Cash operating costs
Direct manufacturing labor
$X–$30,000
$ X
–$30,000
Electricity
$Y–$35,000
$ Y
–$35,000
Depreciation
($180,000 2; $60,000)
$ 90,000
$ 60,000
+$30,000
Loss on disposal of old machine
($120,000 – $72,000; $0)
$ 48,000
$ 0
+$48,000
Total costs
$ X + $Y
$X + $Y
+$ 73,000
+$60,000
+$13,000
First-year costs are lower by $13,000 under the keep machine alternative, and Bob Moody, with
his one-year horizon and operating income-based bonus, will choose to keep the machine.
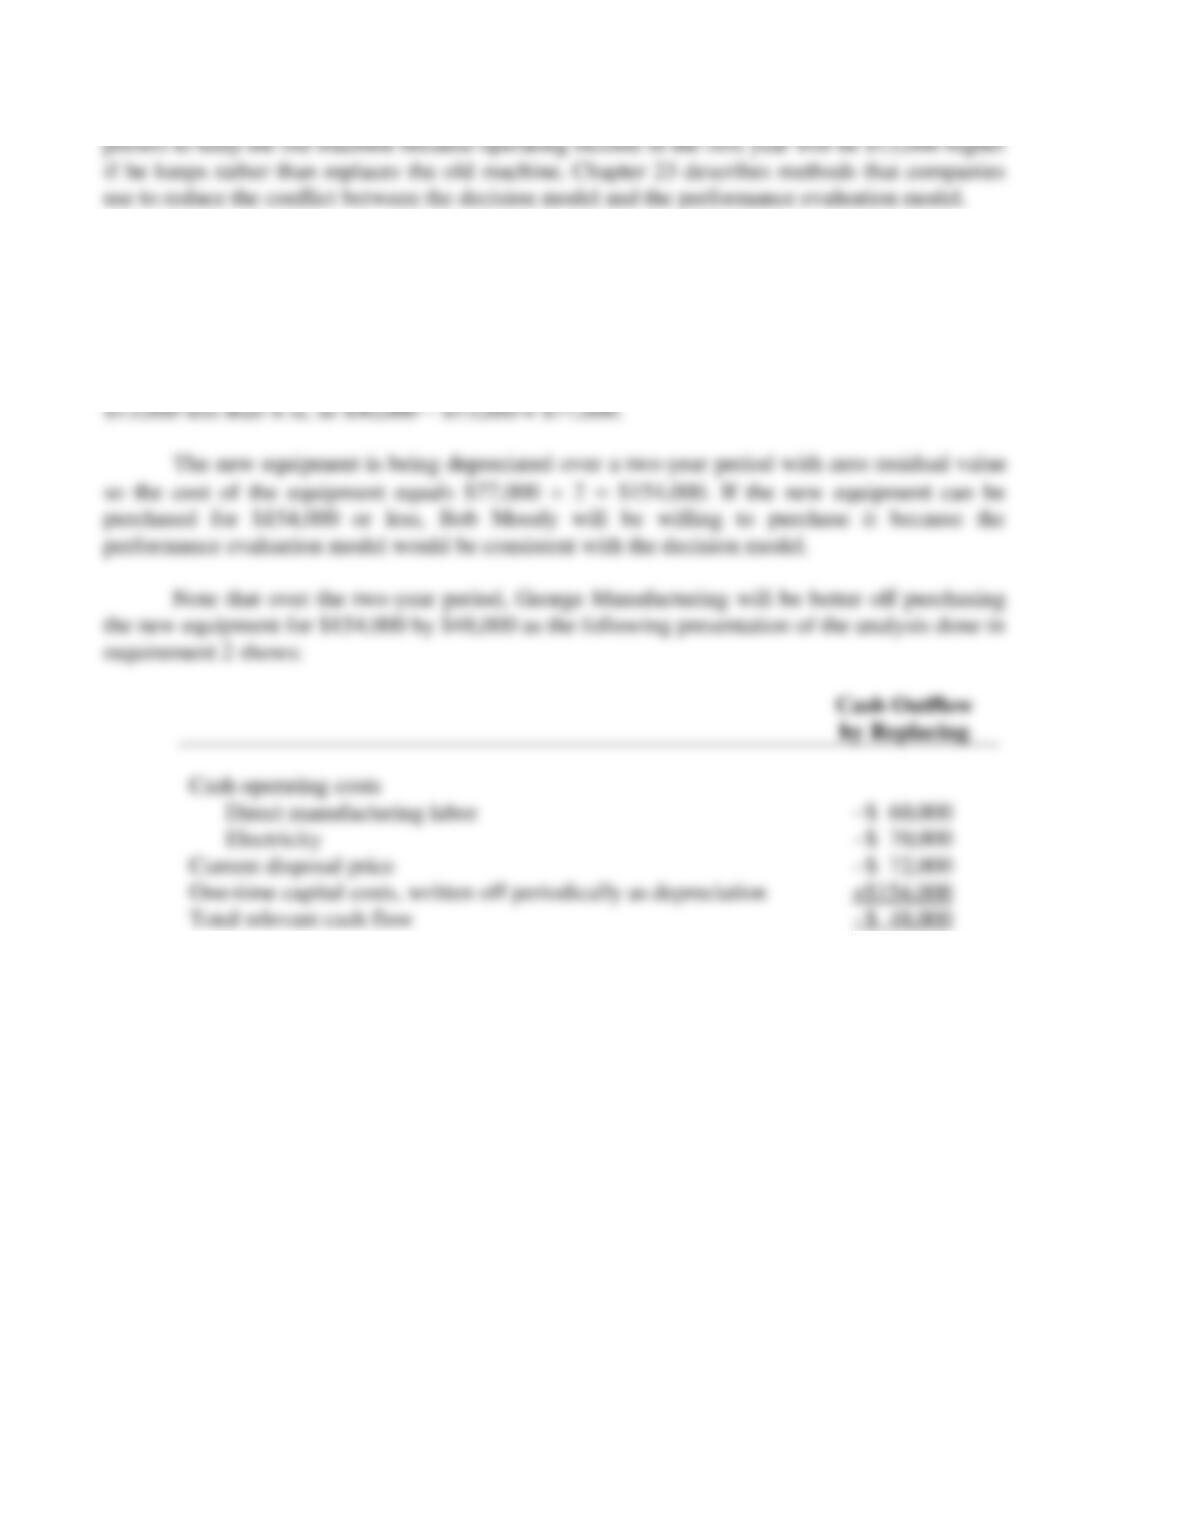
2. Based on the analysis in the table below, George Manufacturing will be better off by
$22,000 over two years if it replaces the current equipment.
Over 2 Years
Cash Outflow
Comparing Relevant Costs of
Replace
Keep
By Replacing
Replace and Keep Alternatives
(1)
(2)
(3) = (1) – (2)
Cash operating costs
Direct manufacturing labor
$X – $60,000
$X
–$ 60,000
Electricity
$Y – $70,000
$Y
–$ 70,000
Current disposal price
–$72,000
$ 0
–$ 72,000
One time capital costs, written off
periodically as depreciation
+$180,000
$ 0
+$180,000
Total relevant cashflow
$Y + $X – $22,000
$X + $Y
–$ 22,000
Note that the book value of the current machine ($120,000) would either be written off as
depreciation over three years under the keep option, or, all at once in the current year under the
replace option. Its net effect would be the same in both alternatives: to increase costs by
$120,000 over two years, hence it is irrelevant in this analysis.
This problem illustrates the conflict between the decision model and the performance
evaluation model. From the perspective of George Manufacturing the old machine should be
replaced. Over the longer two-year horizon, replacing the old machine with the new equipment
saves George Manufacturing $22,000. From a performance evaluation perspective, Bob Moody
3. Moody would be willing to purchase the new equipment if the effect on operating income
in the first year would be zero or positive, that is, if the cost of operating the new equipment in
the first year were lower than the cost of operating the old machine.
From requirement 1, the cost difference in the first year from replacing the old machine
needs to be reduced by $13,000. This means that depreciation on the new equipment must be