Chapter 09 – Interest Rate Risk II
9-32
Education.
Price – market Price – duration Amount
determined estimation of error
c. Given that convexity is 212.4, what are the bond price predictions in each of the four
cases using the duration plus convexity relationship? What is the amount of error in
these predictions?
Price Price
Price duration & duration &
market convexity convexity Amount
determined estimation estimation of error
At +0.10%: $988.85 -$11.15 $988.85 $0.00
Chapter 09 – Interest Rate Risk II
9-33
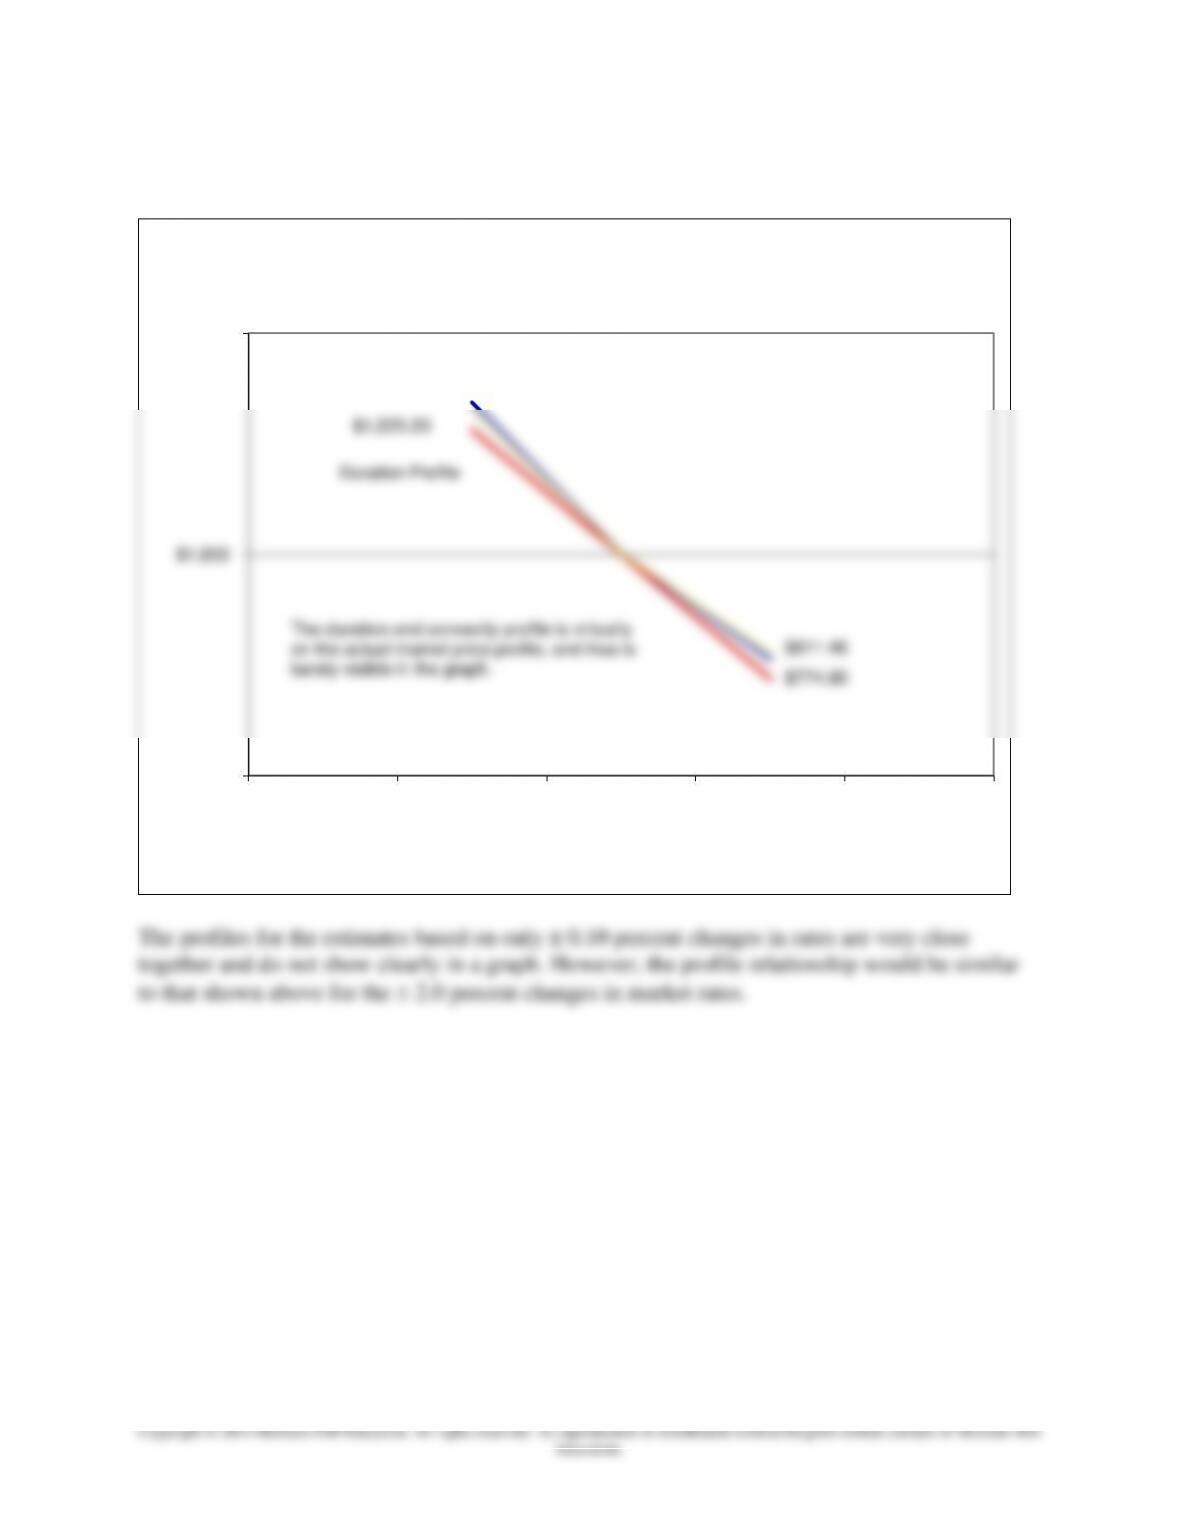
d. Diagram and label clearly the results in parts (a), (b) and (c).
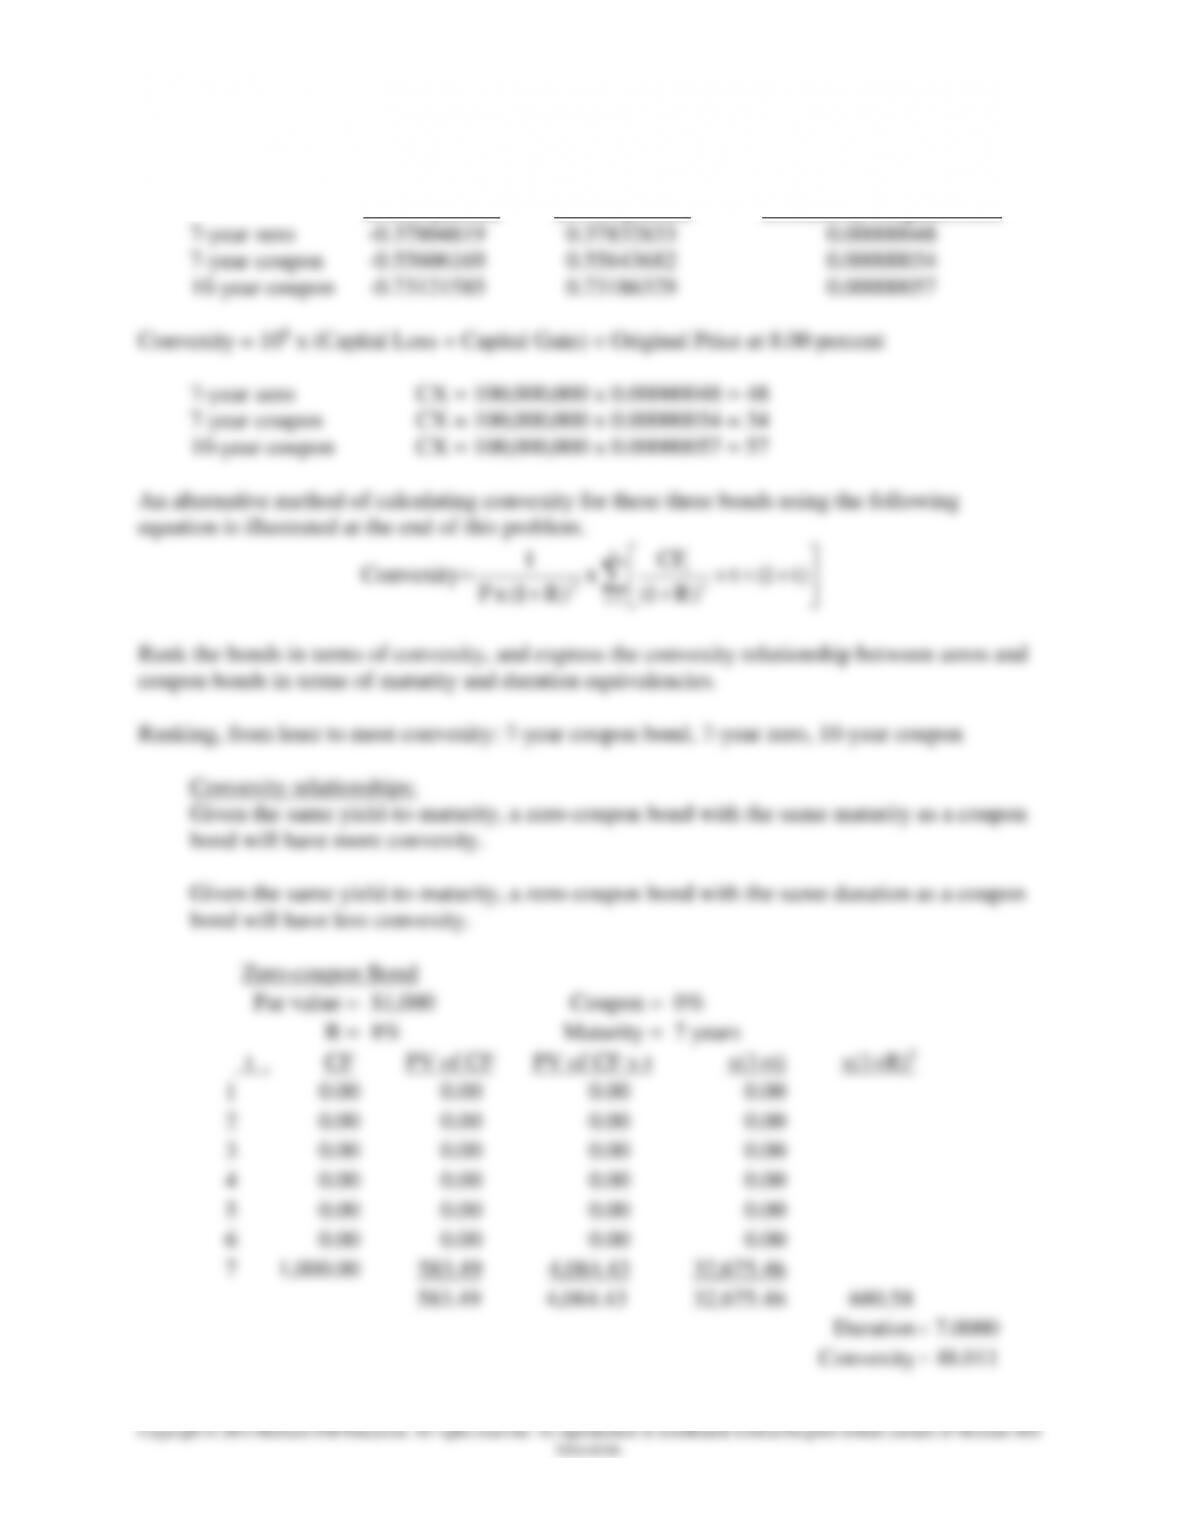
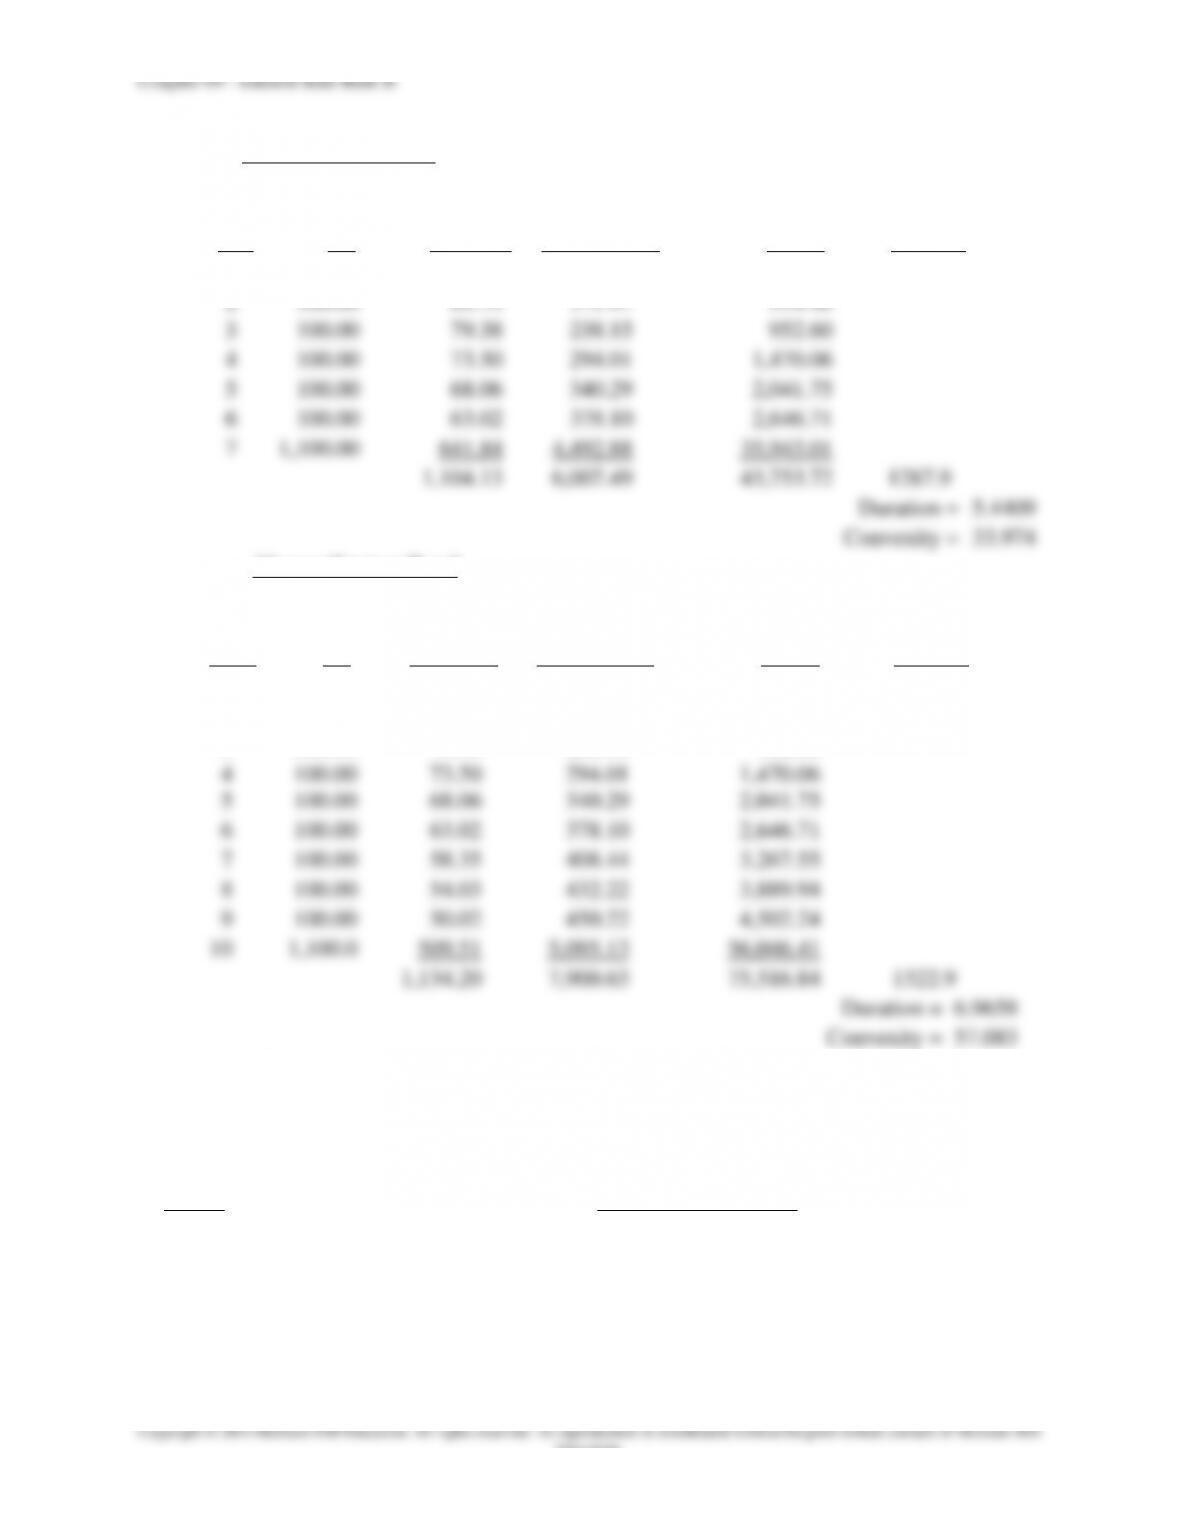
35. Estimate the convexity for each of the following three bonds, all of which trade at yield to
maturity of 8 percent and have face values of $1,000.
A 7-year, zero-coupon bond.
A 7-year, 10 percent annual coupon bond.
A 10-year, 10 percent annual coupon bond that has a duration value of 6.994 years (i.e.,
approximately 7 years).
$600
$1,000
$1,400
46810 12
Percent Yield-to-Maturity
Rate-Price Relationships
Actual Market Price
Duration Profile
The duration and convexity profile is virtually
on the actual market price profile, and thus is
barely visible in the graph.
$811.46
$774.80
$1,275.30
$1,225.20
Chapter 09 – Interest Rate Risk II
Market Value Market Value Capital Loss + Capital Gain
at 8.01 percent at 7.99 percent Divided by Original Price
9-35
Education.
7-year Coupon Bond
Par value =
$1,000
Coupon =
10%
R =
8%
Maturity =
7 years
t .
CF
PVof CF
PV of CF x t
x(1+t)
x(1+R)2
1
100.00
92.59
92.59
185.19
2
100.00
85.73
171.47
514.40
3
100.00
79.38
238.15
952.60
4
100.00
73.50
294.01
1,470.06
5
100.00
68.06
340.29
2,041.75
6
100.00
63.02
378.10
2,646.71
7
1,100.00
641.84
4,492.88
35,943.01
1,104.13
6,007.49
43,753.72
1287.9
Duration
=
5.4409
Convexity
=
33.974
10-year Coupon Bond
Par value =
$1,000
Coupon =
10%
R =
8%
Maturity =
10 years
t .
CF
PV of CF
PV of CF x t
x(1+t)
x(1+R)2
1
100.00
92.59
92.59
185.19
2
100.00
85.73
171.47
514.40
3
100.00
79.38
238.15
952.60
4
100.00
73.50
294.01
1,470.06
5
100.00
68.06
340.29
2,041.75
6
100.00
63.02
378.10
2,646.71
7
100.00
58.35
408.44
3,267.55
8
100.00
54.03
432.22
3,889.94
9
100.00
50.02
450.22
4,502.24
10
1,100.0
509.51
5,095.13
56,046.41
1,134.20
7,900.63
75,516.84
1322.9
Duration
=
6.9658
Convexity
=
57.083
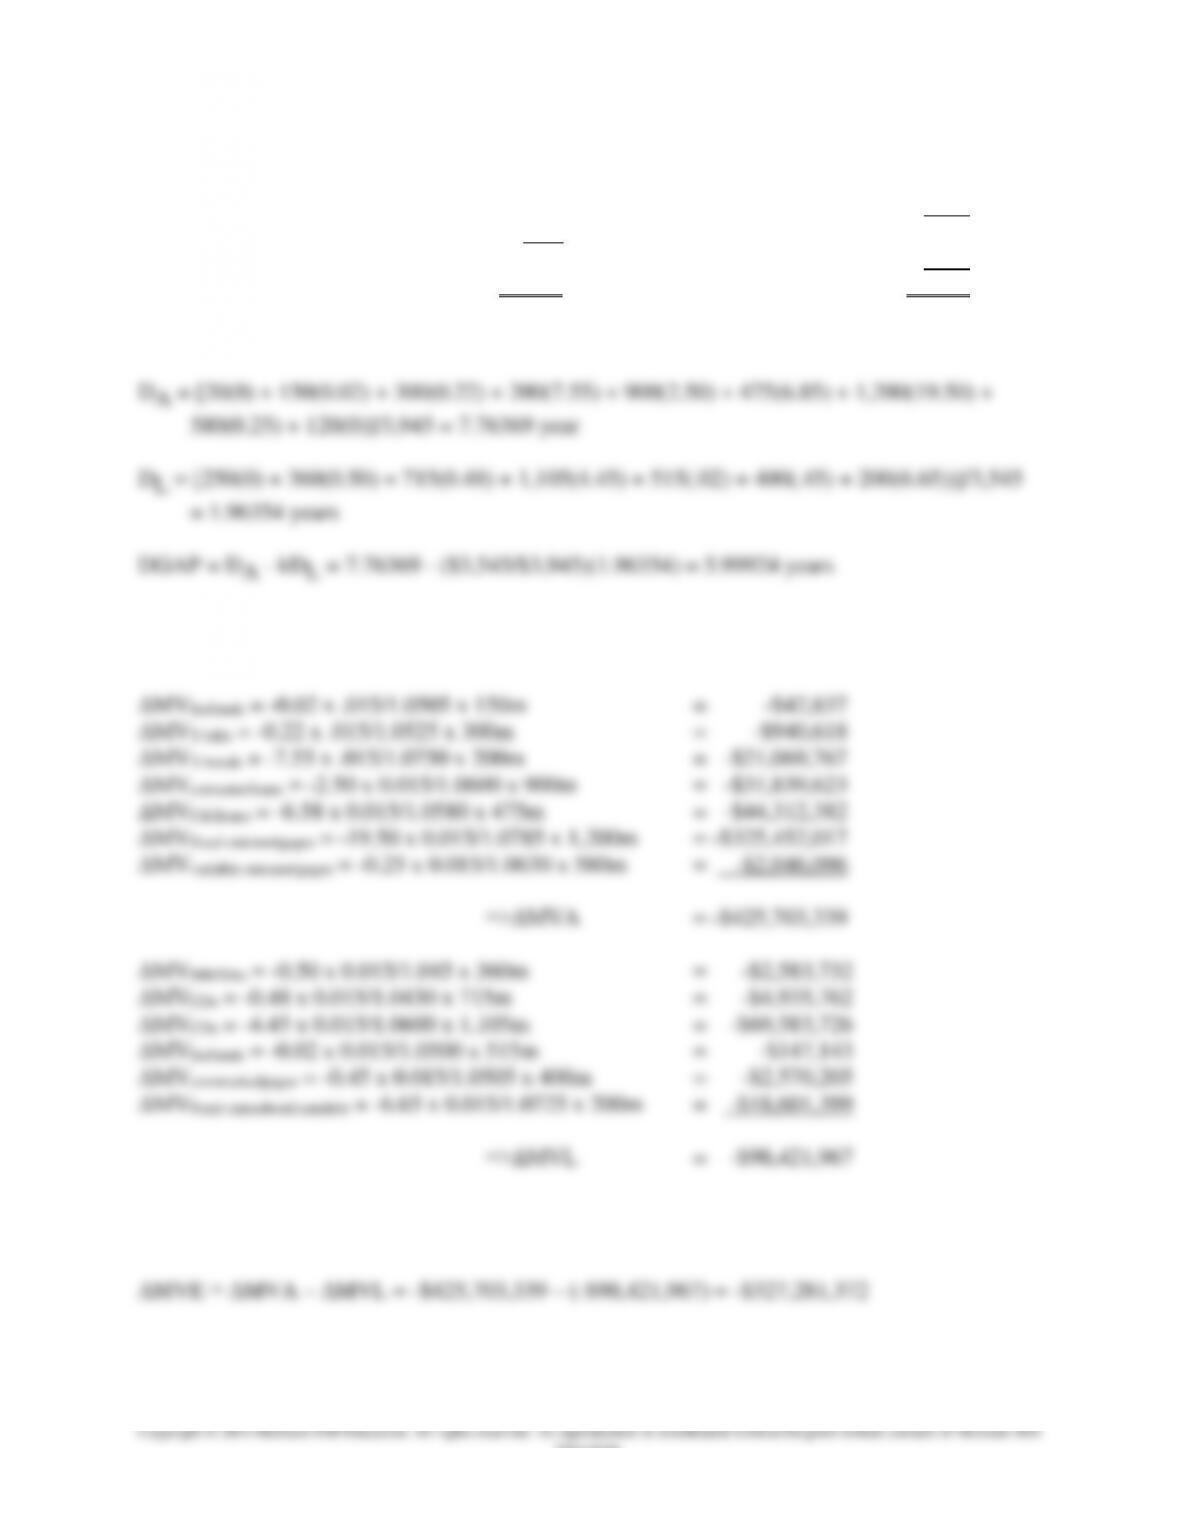
Integrated Mini Case: Calculating and Using Duration GAP
State Bank’s balance sheet is listed below. Market yields and durations (in years) are in
parenthesis, and amounts are in millions.
Assets Liabilities and Equity
Cash $20 Demand deposits $250
Fed funds (5.05%, 0.02) 150 MMDAs (4.5%, 0.50)
T-bills (5.25%, 0.22) 300 (no minimum balance requirement) 360
T-bonds (7.50%, 7.55) 200 CDs (4.3%, 0.48) 715
Consumer loans (6%, 2.50) 900 CDs (6%, 4.45) 1,105
C&I loans (5.8%, 6.58) 475 Fed funds (5%, 0.02) 515
Chapter 09 – Interest Rate Risk II
9-36
Education.
Fixed-rate mortgages (7.85%, 19.50) 1,200 Commercial paper (5.05%, 0.45) 400
Variable-rate mortgages, Subordinated debt:
repriced @ quarter (6.3%, 0.25) 580 Fixed-rate (7.25%, 6.65) 200
Premises and equipment 120 Total liabilities $3,545
Equity 400
Total assets $3,945 Total liabilities and equity $3,945
a. What is State Bank’s duration gap?
b. Use these duration values to calculate the expected change in the value of the assets and
liabilities of State Bank for a predicted increase of 1.5 percent in interest rates.
c. What is the change in equity value forecasted from the duration values for a predicted increase
in interest rates of 1.5 percent?
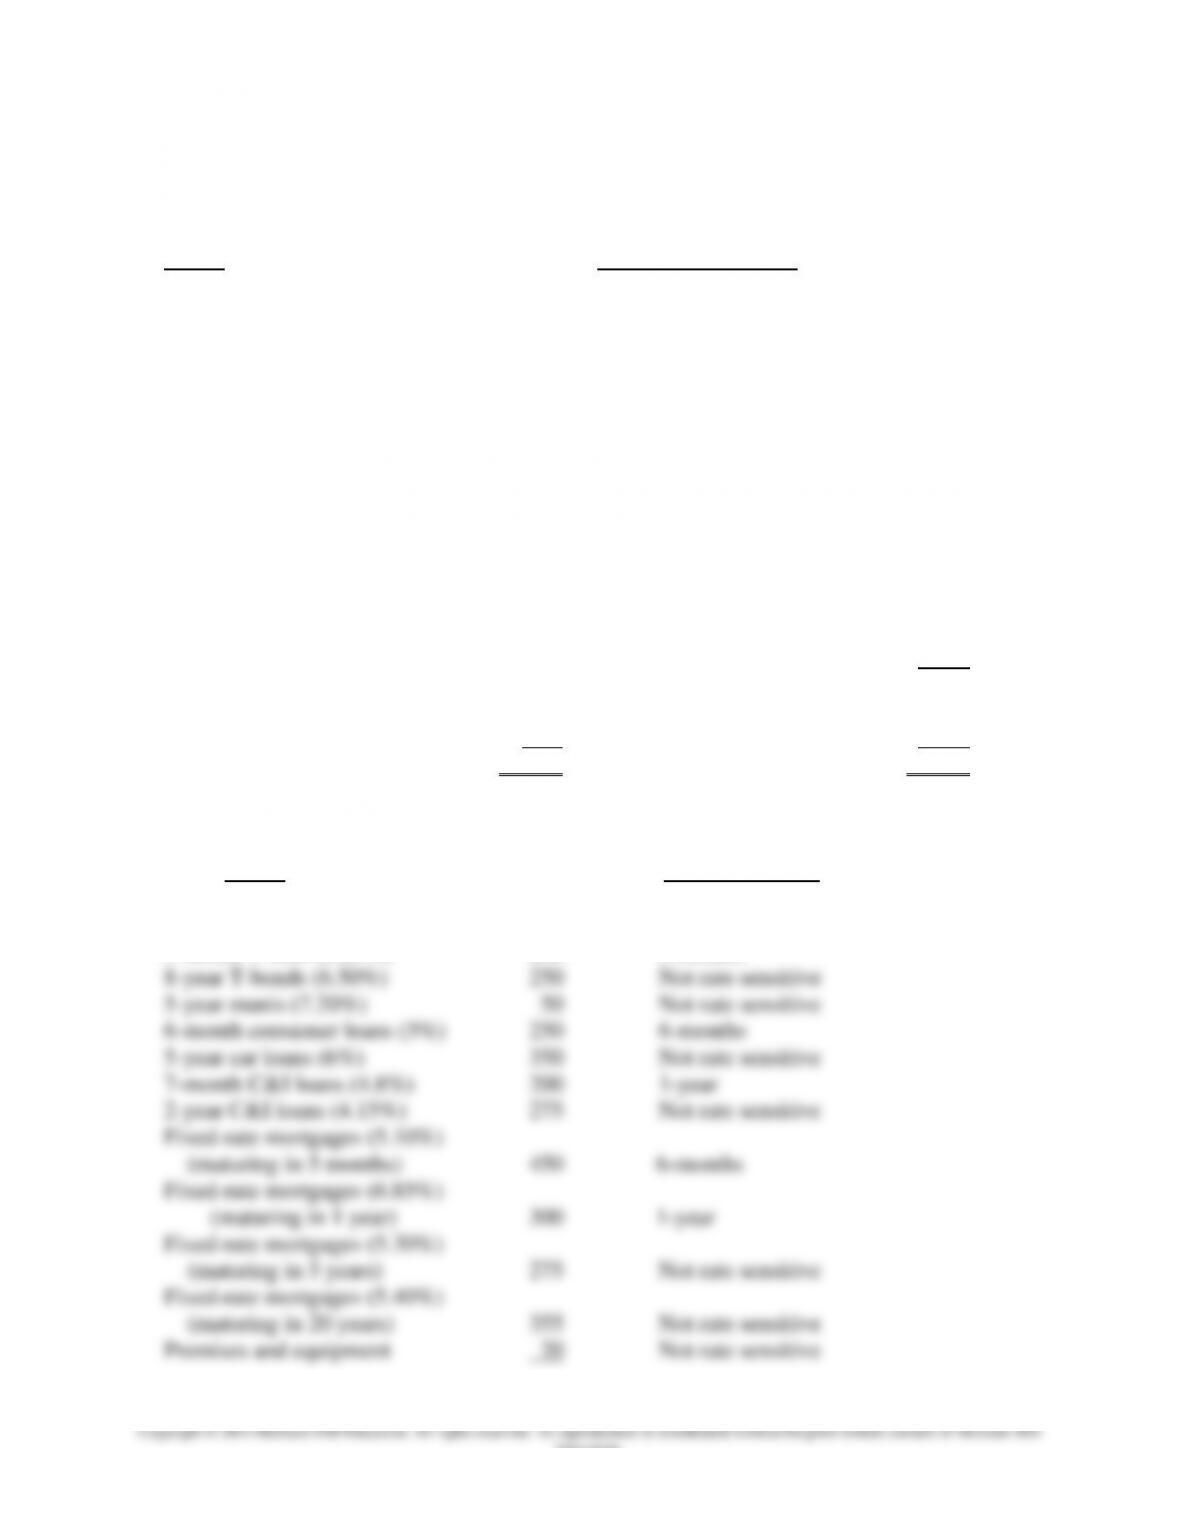
Integrated Mini Case Chapters 8 and 9: Calculating and Using Repricing and Duration GAP
Chapter 09 – Interest Rate Risk II
9-37
Education.
State Bank’s balance sheet is listed below. Market yields and durations (in years) are in
parenthesis, and amounts are in millions.
Assets Liabilities and Equity
Cash $31 Demand deposits $253
Fed funds (2.05%, 0.02) 150 Savings accounts (0.5%, 1.25) 50
3-month T-bills (3.25%, 0.22) 200 MMDAs (3.5%, 0.50)
8-year T-bonds (6.50%, 7.55) 250 (no minimum balance requirement) 460
5-year munis (7.20%, 4.25) 50 3-month CDs (3.2%, 0.20) 175
6-month consumer loans (5%, 0.42) 250 1-year CDs (3.5%, 0.95) 375
5-year car loans (6%, 3.78) 350 5-year CDs (5%, 4.85) 350
7-month C&I loans (4.8%, 0.55) 200 Fed funds (2%, 0.02) 225
2-year C&I loans (4.15%, 1.65) 275 Repos (2%, 0.05) 290
Fixed-rate mortgages (5.10%, 0.48) 6-month commercial paper
(maturing in 5 months) 450 (4.05%, 0.55) 300
Fixed-rate mortgages (6.85%, 0.85) Subordinate notes:
(maturing in 1 year) 300 1-year fixed rate (5.55%, 0.92) 200
Fixed-rate mortgages (5.30%, 4.45) Subordinated debt:
(maturing in 5 years) 275 7-year fixed rate (6.25%, 6.65) 100
Fixed-rate mortgages (5.40%, 18.25) Total liabilities $2,778
(maturing in 20 years) 355
Premises and equipment 20 Equity 3078
Total assets $3,156 Total liabilities and equity $3,156
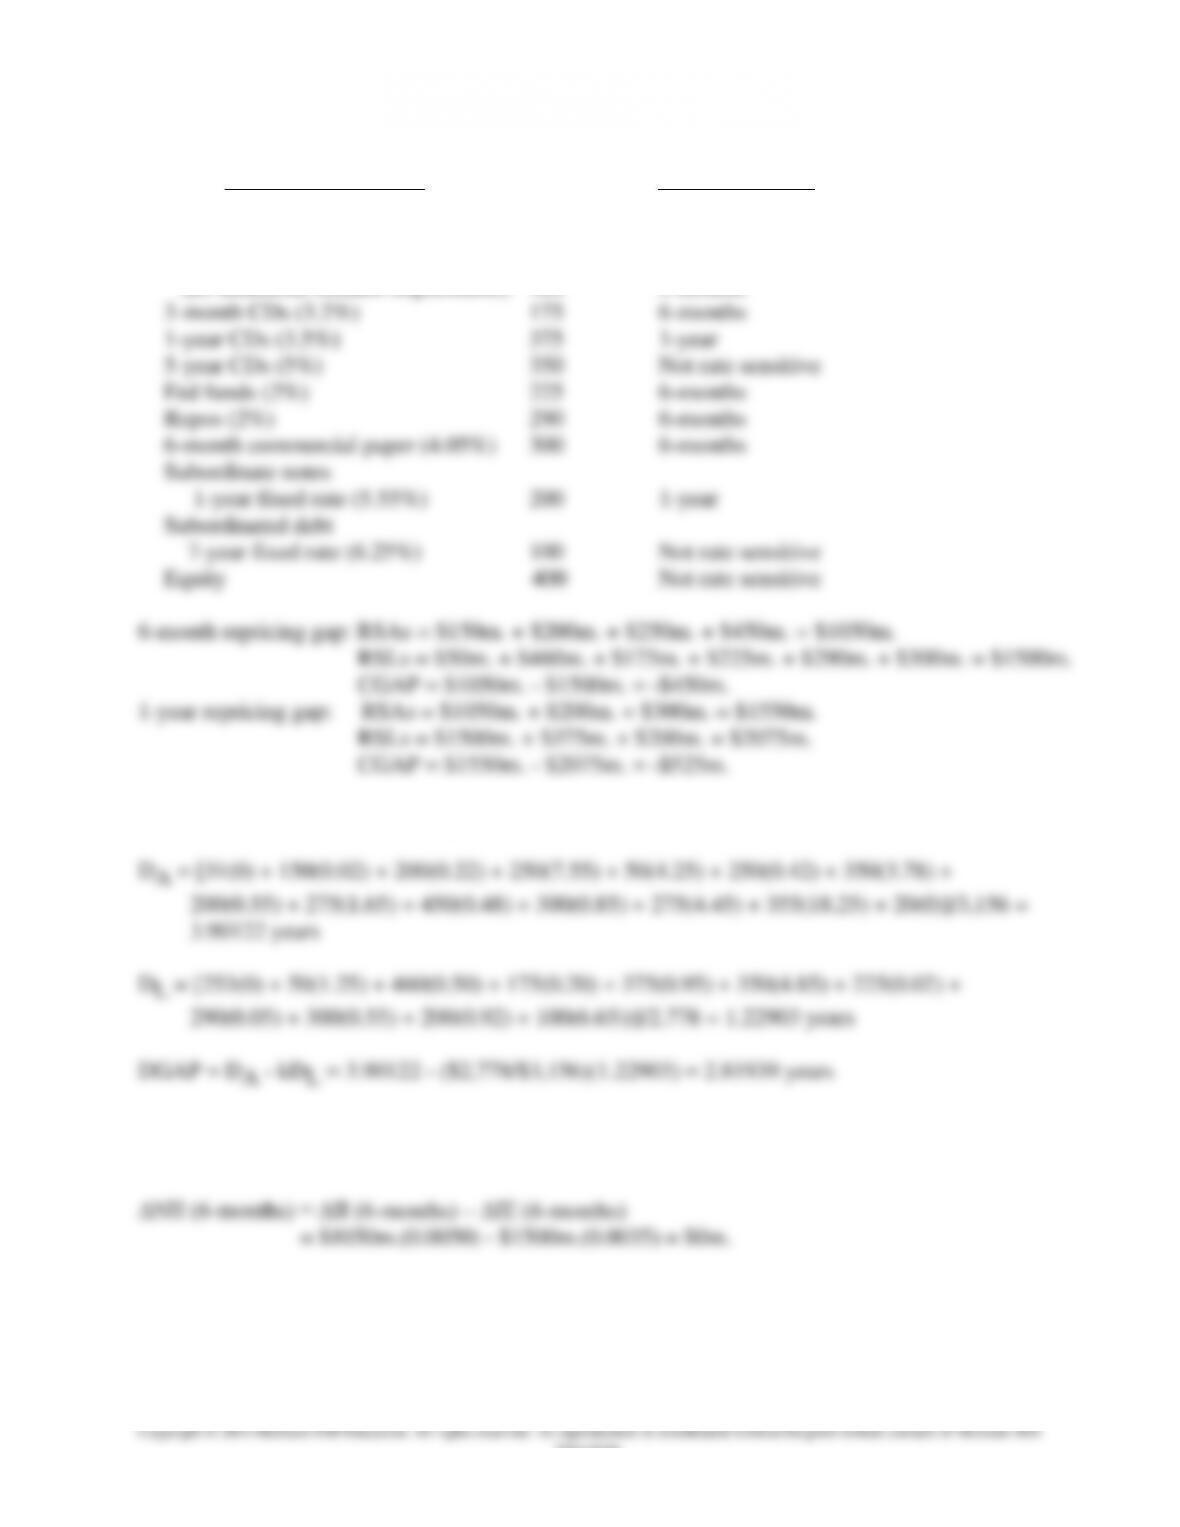
a. What is the repricing gap if the planning period is six months? One year?
Assets Repricing period
Cash $31 Not rate sensitive
Fed funds (2.05%) 150 6-months
3-month T-bills (3.25%) 200 6-months
Chapter 09 – Interest Rate Risk II
9-38
Education.
Liabilities and Equity Repricing Period
Demand deposits $253 Not rate sensitive
Savings accounts (0.5%) 50 6-months
MMDAs (3.5%)
(no minimum balance requirement) 460 6-months
b. What is State Bank’s duration gap?
c. What is the impact over the next six months on net interest income if interest rates on RSAs
increase 50 basis points and on RSLs increase 35 basis points? Explain the results.
Chapter 09 – Interest Rate Risk II
9-39
Education.
d. What is the impact over the next year on net interest income if interest rates on RSAs decrease
(increase) 35 basis points and on RSLs decrease (increase) 50 basis points? Explain the results.
e. Use these duration values to calculate the expected change in the value of the assets and
liabilities of State Bank for a predicted decrease of 0.35 percent in interest rates on assets and
0.50 percent on liabilities.
Chapter 09 – Interest Rate Risk II
9-40
Education.
f. What is the change in equity value forecasted from the duration values for decrease of 0.35
percent in interest rates on assets and 0.50 percent on liabilities?
g. Use the duration gap model to calculate the change in equity value if the relative change in all
market interest rates is a decrease of 50 basis points.
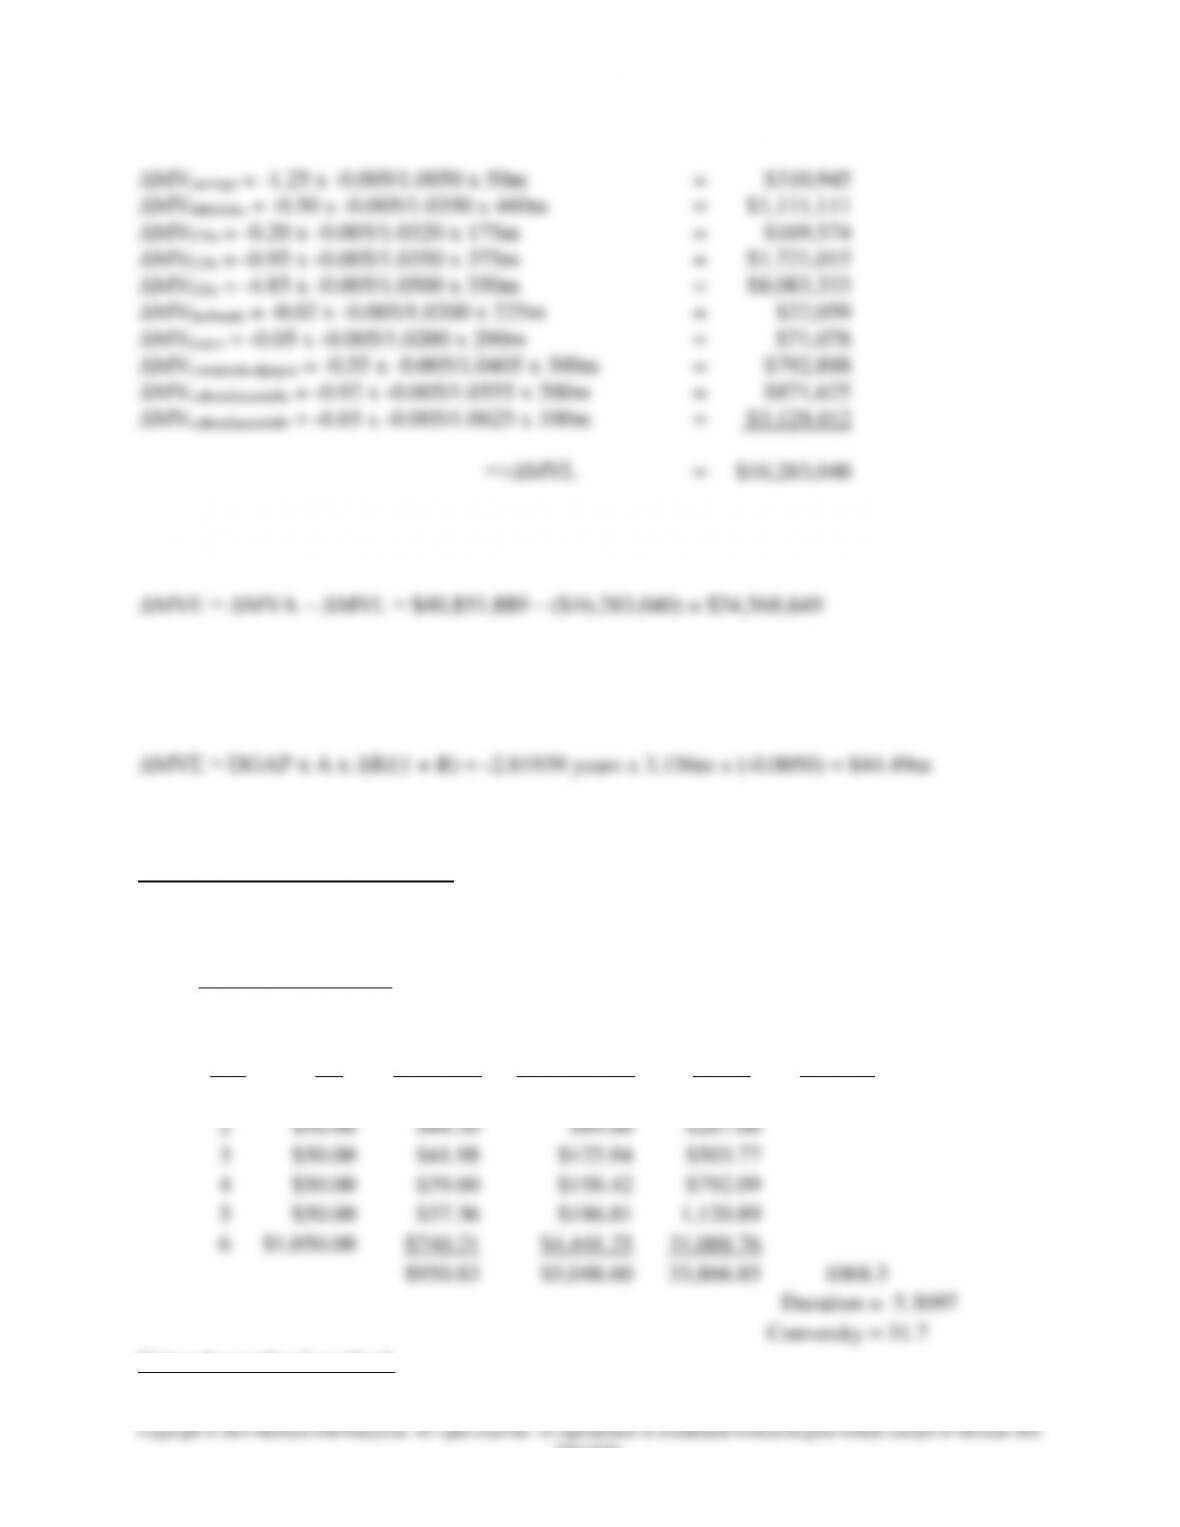
Additional Example for Chapter 9
This example is to estimate both the duration and convexity of a 6-year bond paying 5 percent
coupon annually and the annual yield to maturity is 6 percent.
6-year Coupon Bond
Par value =
$1,000
Coupon =
5%
R =
6%
Maturity =
6 years
t .
CF
PV of CF
PV of CF x t
x(1+t)
x(1+R)2
1
$50.00
$47.17
$47.17
$94.34
2
$50.00
$44.50
$89.00
$267.00
3
$50.00
$41.98
$125.94
$503.77
4
$50.00
$39.60
$158.42
$792.09
5
$50.00
$37.36
$186.81
1,120.89
6
$1,050.00
$740.21
$4,441.25
31,088.76
$950.83
$5,048.60
33,866.85
1068.3
Duration
=
5.3097
Convexity
=
31.7
Using the textbook method:
Chapter 09 – Interest Rate Risk II
9-41
Copyright © 2014 McGraw-Hill Education. All rights reserved. No reproduction or distribution without the prior written consent of McGraw-Hill
Education.
CX = 108 [(950.3506-950.8268)/950.8268 + (951.3032-950.8268)/950.8268]
= 108[-0.0005007559 + 0.0005501073] = 31.70
What is the effect of a 2 percent increase in interest rates, from 6 percent to 8 percent?
Using Present Values, the percentage change is:
= ($950.8268 – $861.3136)/ $950.8268 = -9.41%
Using the duration formula: ΔMVA = -D x ΔR/(1 + R) + 0.5CX(R)2
= -5.3097 x [(0.02)/1.06] + 0.5(31.7)(0.02)2
= -0.1002 + .0063 = -9.38%
Adding convexity adds more precision. Duration alone would have given the answer of -10.02%.