14-1
CHAPTER 14
14-1 Disagree. Cost accounting data plays a key role in many management planning and
control decisions. The division president will be able to make better operating and strategy
1. To provide information for economic decisions.
3. To justify costs or compute reimbursement amounts.
14-3 Exhibit 14-2 lists four criteria used to guide cost allocation decisions:
2. Benefits received.
4. Ability to bear.
purpose.
14-4 Disagree. In general, companies have three choices regarding the allocation of corporate
costs to divisions: allocate all corporate costs, allocate some corporate costs (those “controllable”
14-5 Disagree. If corporate costs allocated to a division can be reallocated to the indirect cost
pools of the division on the basis of a logical cause-and-effect relationship, then it is in fact
preferable to do so—this will result in fewer division indirect cost pools and a more cost-
14-2
14-6 Customer profitability analysis highlights to managers how individual customers
14-7 Companies that separately record (a) the list price and (b) the discount have sufficient
14-8 No. A customer-profitability profile highlights differences in current period’s profitability
across customers. Dropping customers should be the last resort. An unprofitable customer in one
14-9 Five categories in a customer cost hierarchy are identified in the chapter. The examples
given relate to the Spring Distribution Company used in the chapter:
• Customer output-unit-level costs—costs of activities to sell each unit (case) to a customer.
An example is product-handling costs of each case sold.
14-10 Charting cumulative profits by customer or product type generates a whale curve. This
14-11 Using the levels approach introduced in Chapter 7, the sales-volume variance is a Level 2
variance. By sequencing through Level 3 (sales-mix and sales-quantity variances) and then
14-12 The total sales-mix variance arises from differences in the budgeted contribution margin
14-13 A favorable sales-quantity variance arises because the actual units of all products sold
exceed the budgeted units of all products sold.
14-14 The sales-quantity variance can be decomposed into (a) a market-size variance (which
arises when the actual total market size in units is different from the budgeted market size in
14-15 The direct materials efficiency variance is a Level 3 variance. Further insight into this
variance can be gained by moving to a Level 4 analysis where the effect of mix and yield
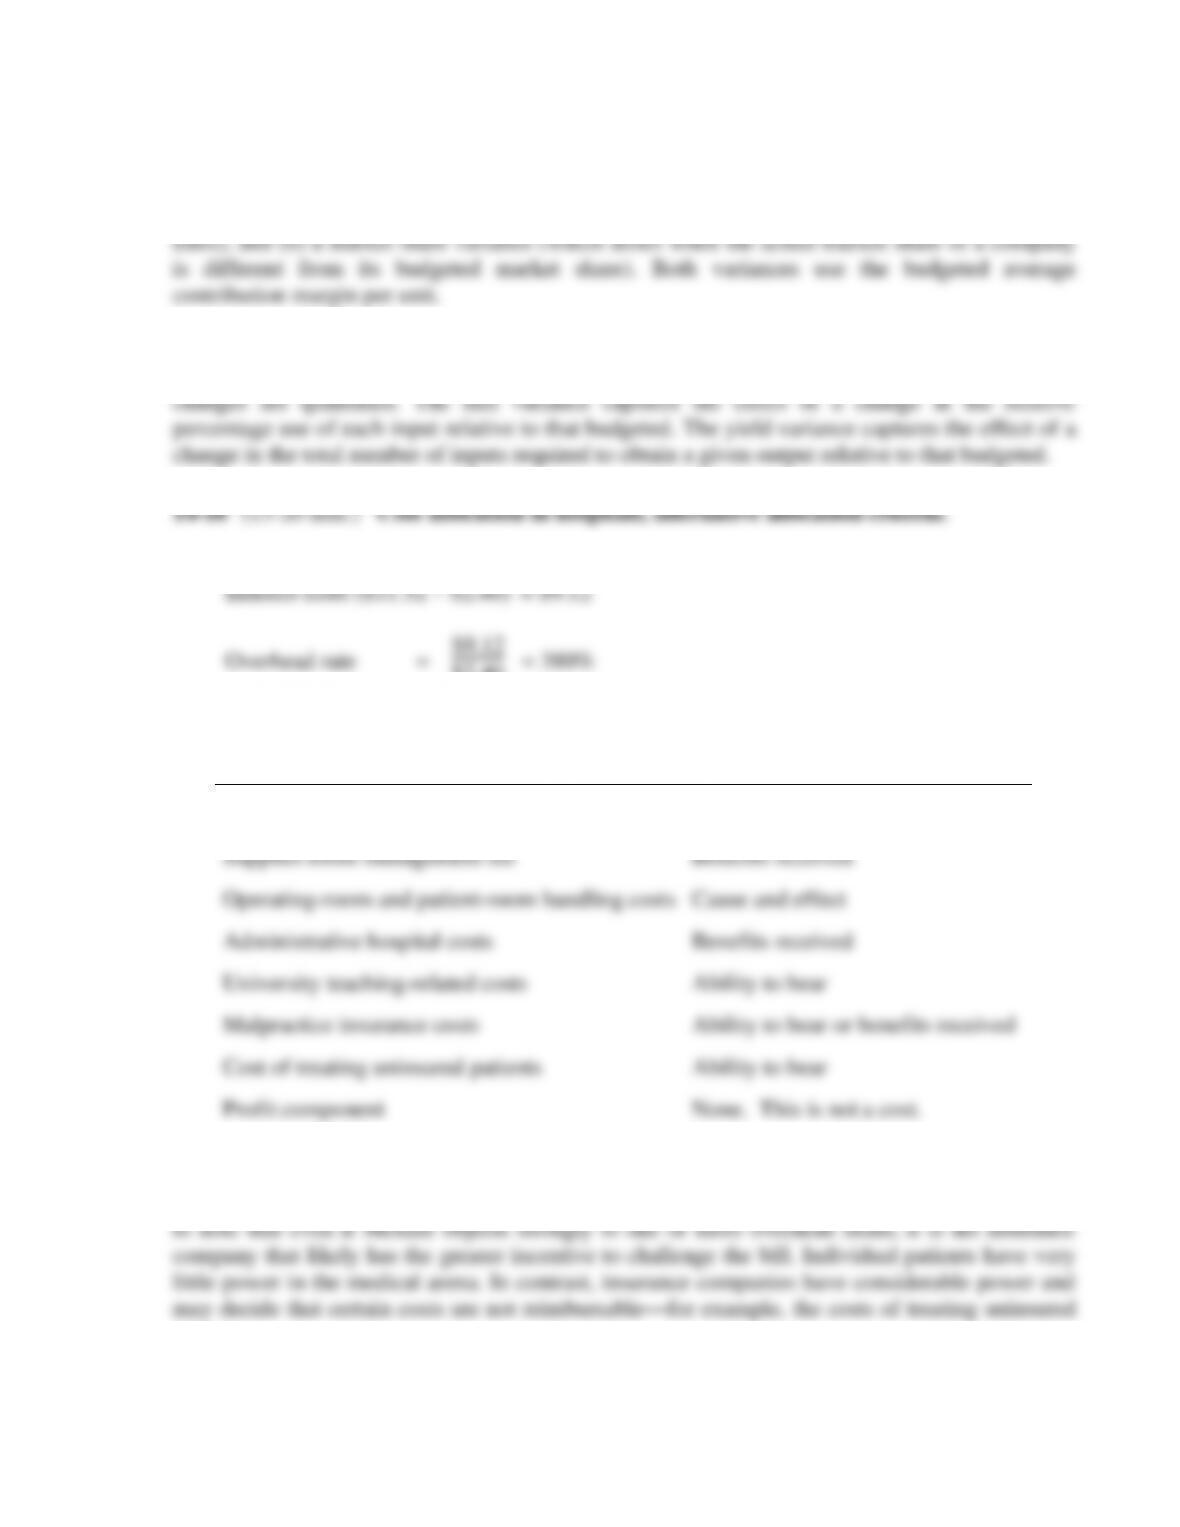
1. Direct costs = $2.40
$2.40 = 380%
2. The answers here are less than clear-cut in some cases.
Overhead Cost Item
Allocation Criteria
Processing of paperwork for purchase
Supplies room management fee
Operating-room and patient-room handling costs
Administrative hospital costs
University teaching-related costs
Malpractice insurance costs
Cost of treating uninsured patients
Profit component
Cause and effect
Benefits received
Cause and effect
Benefits received
Ability to bear
Ability to bear or benefits received
Ability to bear
None. This is not a cost.
3. Assuming that Meltzer’s insurance company is responsible for paying the $4,800 bill,
Meltzer probably can only express outrage at the amount of the bill. The point of this question is
14-4
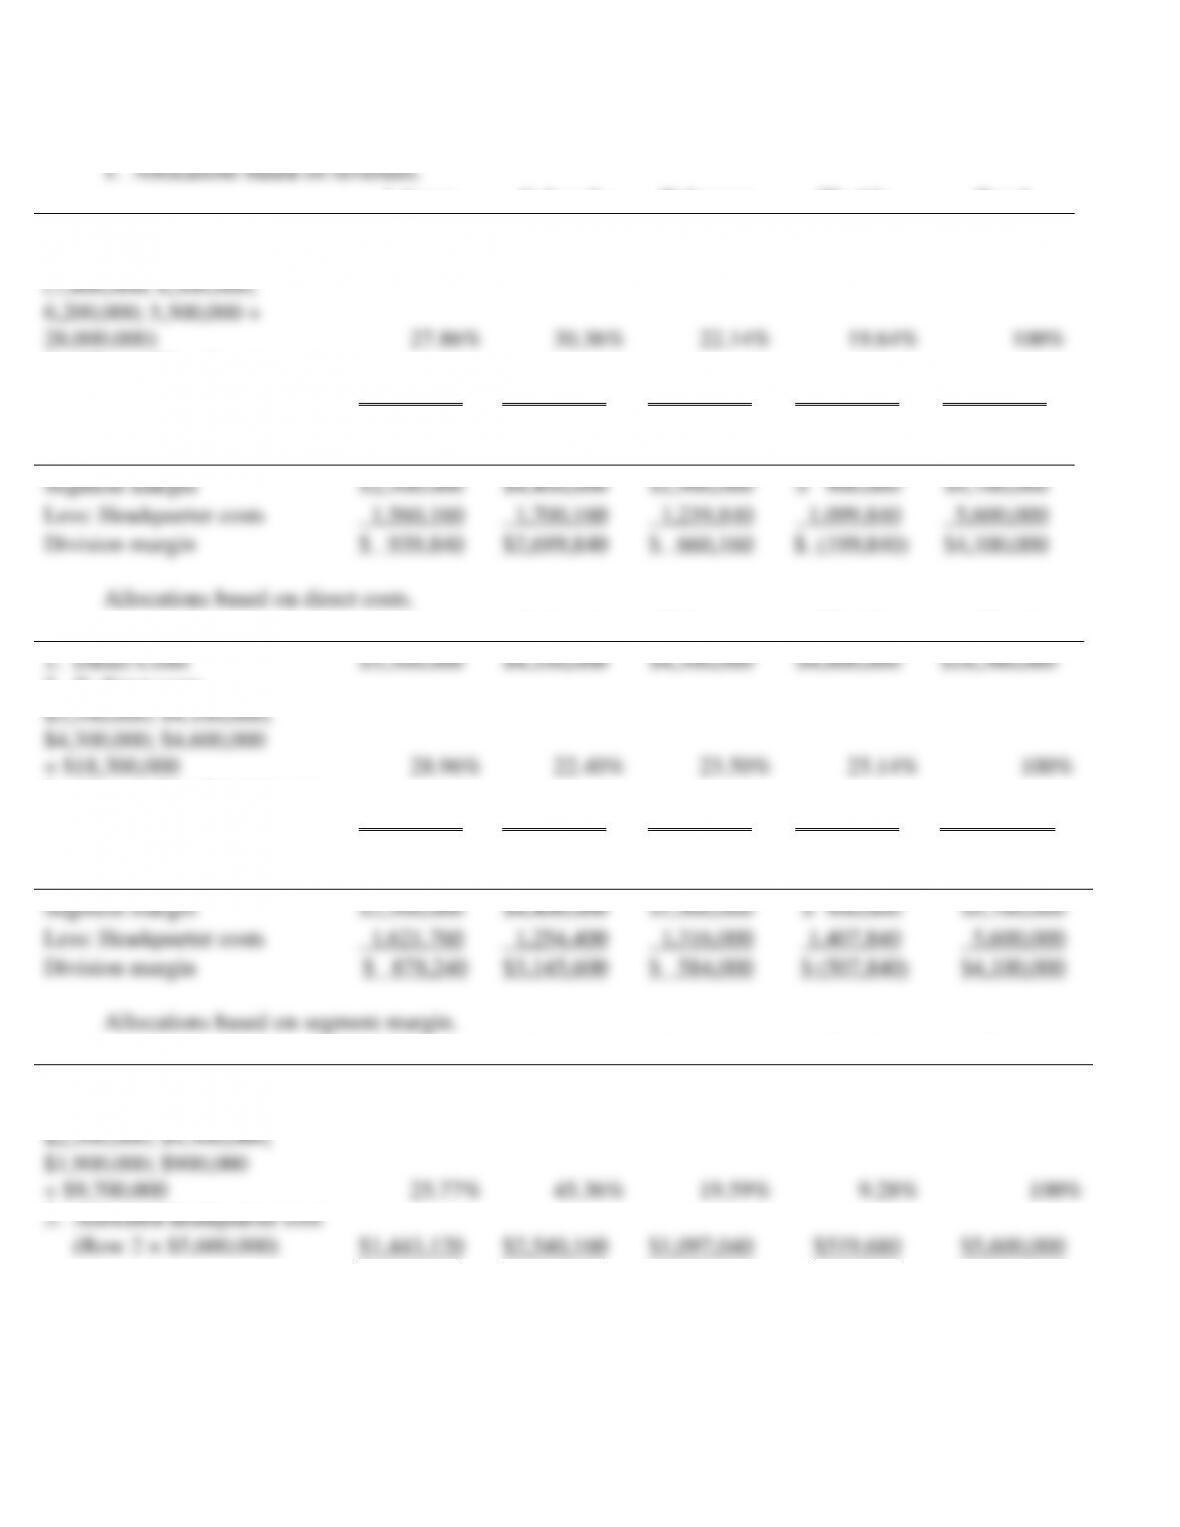
14-17 (15 min.) Cost Allocation and Decision Making
Arizona
Colorado
Delaware
Florida
Total
1. Revenues
7,800,000
8,500,000
6,200,000
5,500,000
28,000,000
2. % revenues
(7,800,000; 8,500,000;
6,200,000; 5,500,000 ÷
28,000,000)
27.86%
30.36%
22.14%
19.64%
100%
3. Allocated headquarter cost
(Row 2 × $5,600,000)
$1,560,160
$1,700,160
$1,239,840
$1,099,840
$5,600,000
Arizona
Colorado
Delaware
Florida
Total
Segment margin
$2,500,000
$4,400,000
$1,900,000
$ 900,000
$9,700,000
Less: Headquarter costs
1,560,160
1,700,160
1,239,840
1,099,840
5,600,000
Division margin
$ 939,840
$2,699,840
$ 660,160
$ (199,840)
$4,100,000
Allocations based on direct costs.
Arizona
Colorado
Delaware
Florida
Total
1. Direct Costs
$5,300,000
$4,100,000
$4,300,000
$4,600,000
$18,300,000
2. % direct costs
$5,300,000; $4,100,000;
$4,300,000; $4,600,000
÷ $18,300,000
28.96%
22.40%
23.50%
25.14%
100%
3. Allocated headquarter cost
(Row 2 × $5,600,000)
$1,621,760
$1,254,400
$1,316,000
$1,407,840
$ 5,600,000
Arizona
Colorado
Delaware
Florida
Total
Segment margin
$2,500,000
$4,400,000
$1,900,000
$ 900,000
$9,700,000
Less: Headquarter costs
1,621,760
1,254,400
1,316,000
1,407,840
5,600,000
Division margin
$ 878,240
$3,145,600
$ 584,000
$ (507,840)
$4,100,000
Allocations based on segment margin.
Arizona
Colorado
Delaware
Florida
Total
1. Segment Margins
$2,500,000
$4,400,000
$1,900,000
$900,000
$9,700,000
2. % segment margins
$2,500,000; $4,400,000;
$1,900,000; $900,000
÷ $9,700,000
25.77%
45.36%
19.59%
9.28%
100%
3. Allocated headquarter cost
(Row 2 × $5,600,000)
$1,443,120
$2,540,160
$1,097,040
$519,680
$5,600,000
14-5
Arizona
Colorado
Delaware
Florida
Total
Segment margin
$2,500,000
$4,400,000
$1,900,000
$900,000
$9,700,000
Less: Headquarter costs
1,443,120
2,540,160
1,097,040
519,680
5,600,000
Division margin
$1,056,880
$1,859,840
$ 802,960
$380,320
$4,100,000
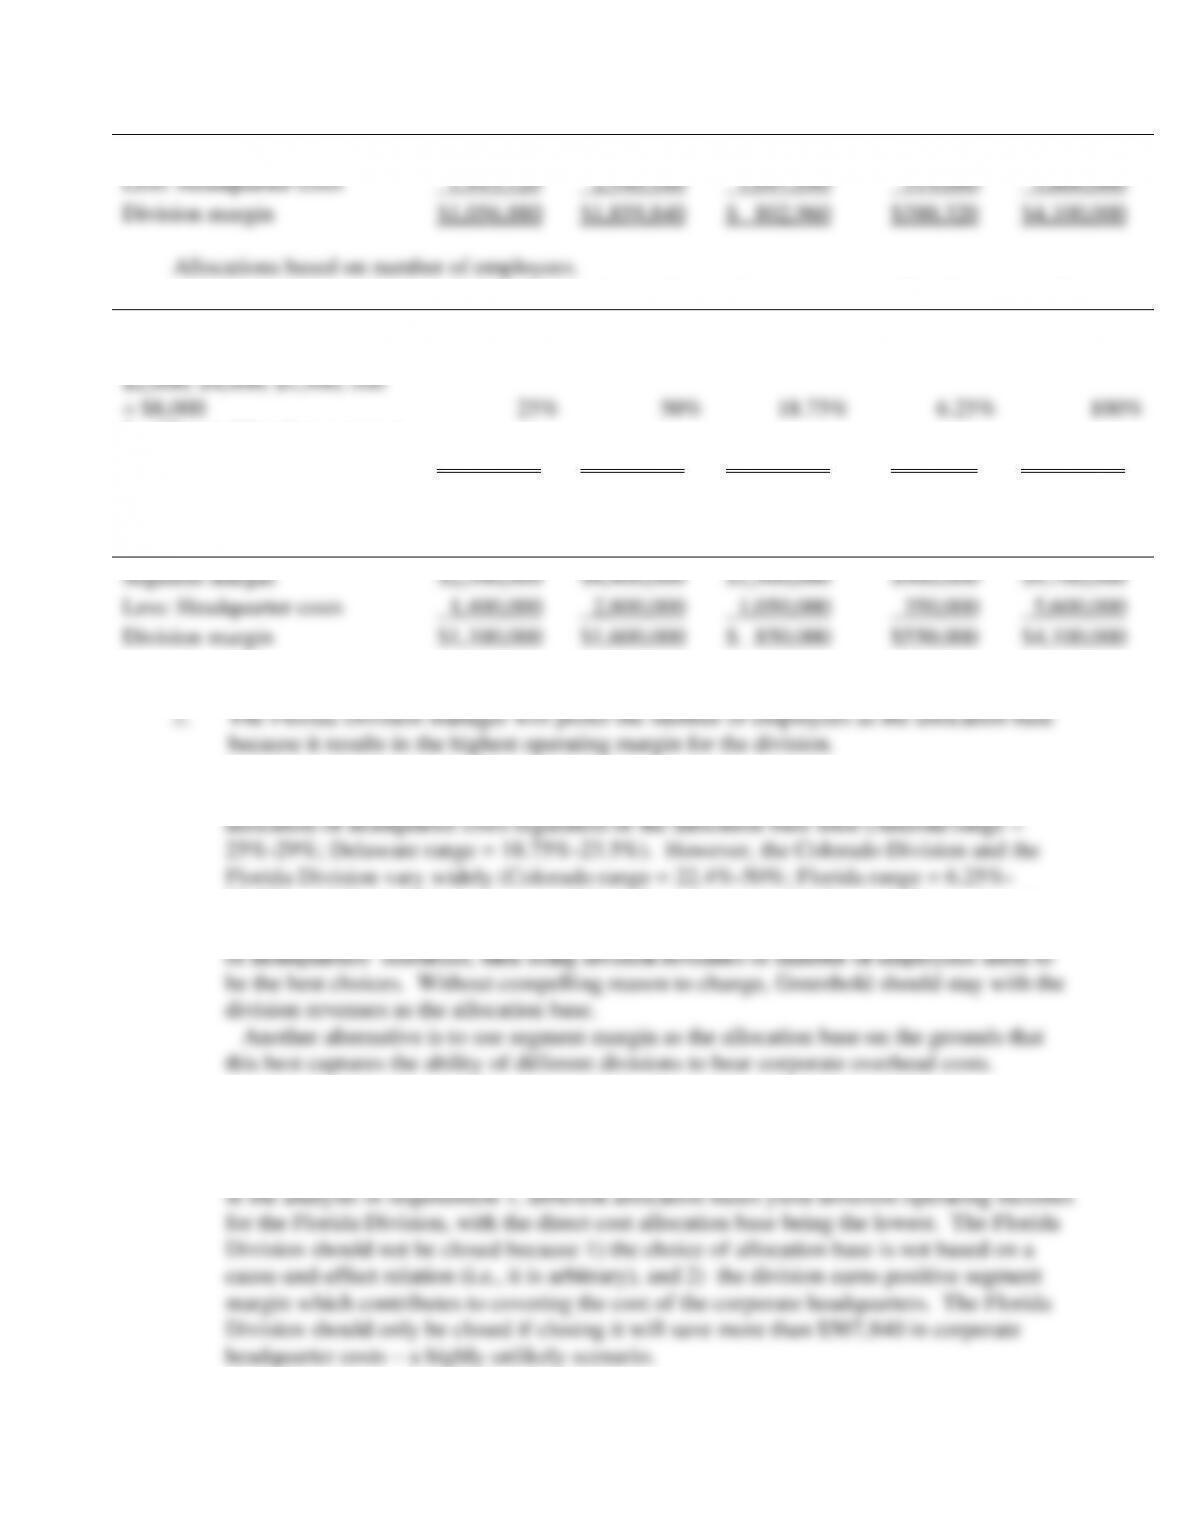
Allocations based on number of employees.
Arizona
Colorado
Delaware
Florida
Total
1. Number of Employees
2,000
4,000
1,500
500
8,000
2. % segment margins
$2,000; $4,000; $1,500; 500
÷ $8,000
25%
50%
18.75%
6.25%
100%
3. Allocated headquarter cost
(Row 2 × $5,600,000)
$1,400,000
$2,800,000
$1,050,000
$350,000
$5,600,000
Arizona
Colorado
Delaware
Florida
Total
Segment margin
$2,500,000
$4,400,000
$1,900,000
$900,000
$9,700,000
Less: Headquarter costs
1,400,000
2,800,000
1,050,000
350,000
5,600,000
Division margin
$1,100,000
$1,600,000
$ 850,000
$550,000
$4,100,000
3. The Arizona Division and the Delaware Division receive roughly the same percentage
25.1%). All four methods are reasonable options, but none clearly meets the cause-and-
effect criterion for selecting the allocation base. If larger divisions tend to consume more
4. If Greenbold elects to use direct costs as the allocation base, the Florida Division will
appear to have a $507,840 operating loss. Even so, the Florida Division generates a
$900,000 segment margin before allocating the cost of the corporate headquarters. As seen
14-6
1.
Hotel
Restaurant
Casino
Rembrandt
Revenue
$16,425,000
$5,256,000
$12,340,000
$34,021,000
Direct costs
9,819,260
3,749,172
4,248,768
17,817,200
Segment margin
$ 6,605,740
$1,506,828
$ 8,091,232
16,203,800
Fixed overhead costs
14,550,000
Income before taxes
$ 1,653,800
Segment margin %
40.22%
28.67%
65.57%
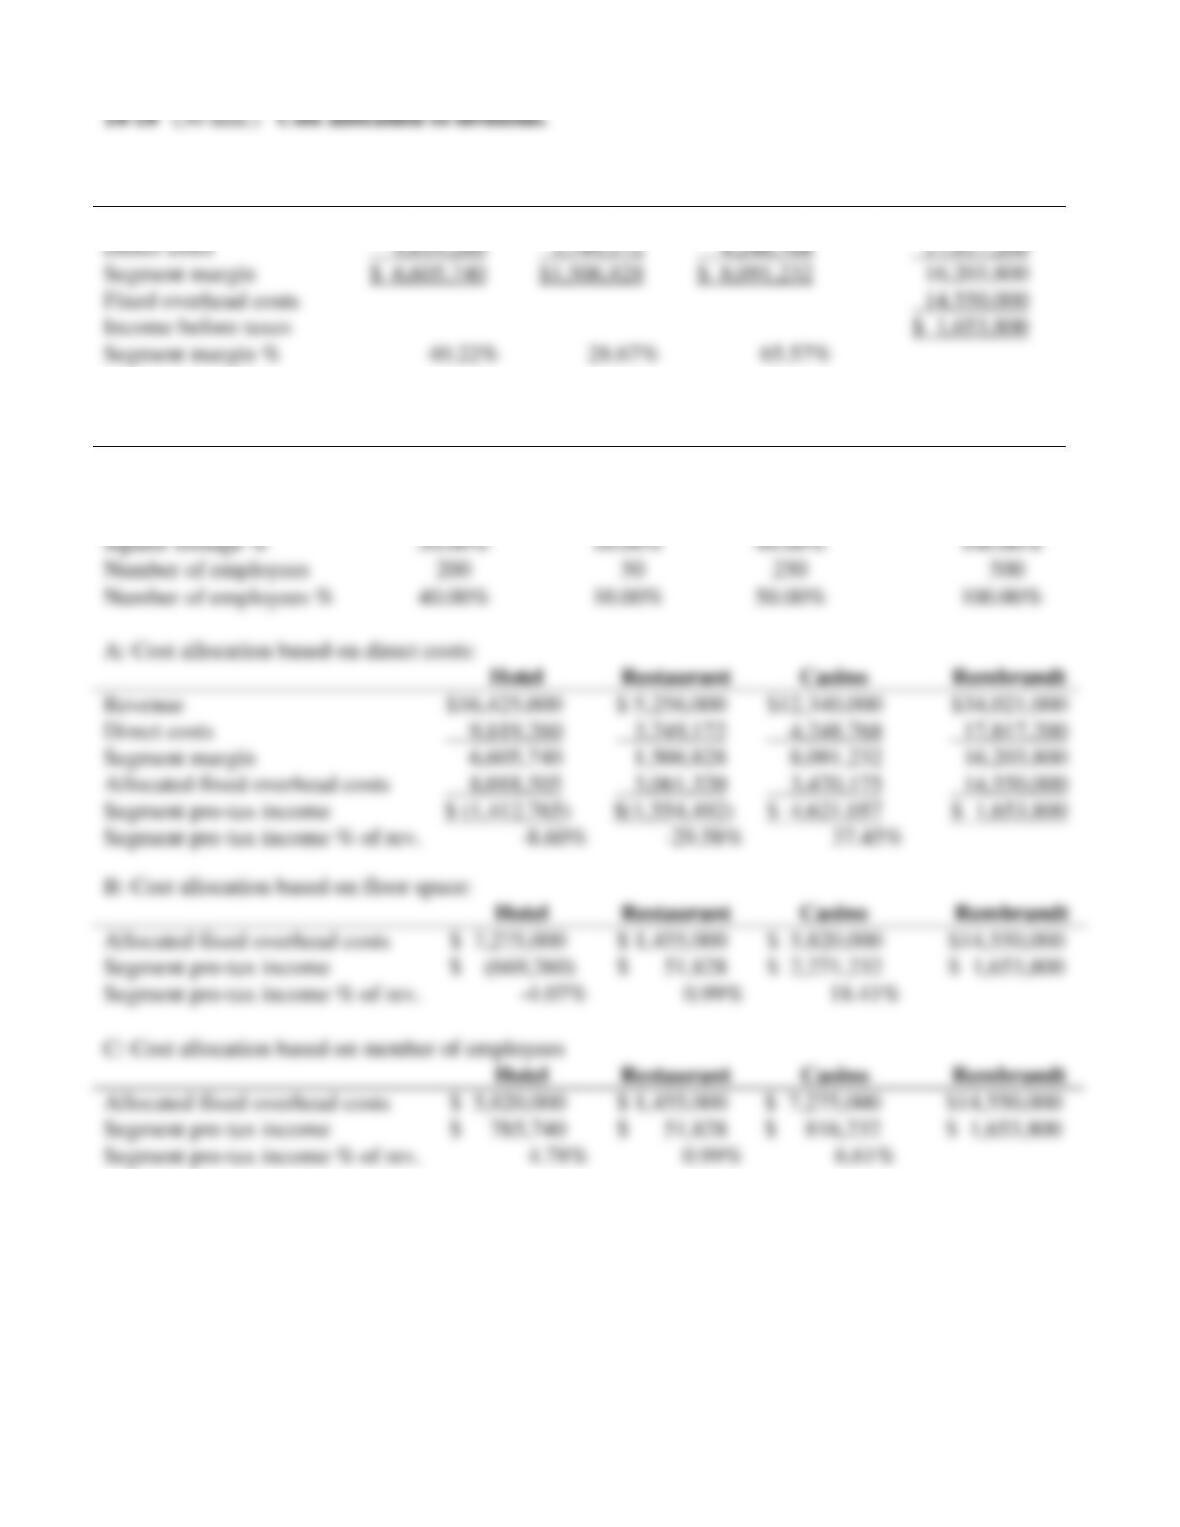
2.
Hotel
Restaurant
Casino
Rembrandt
Direct costs
$9819260
$3749172
$4248768
$17817200
Direct cost %
55.11%
21.04%
23.85%
100.00%
Square footage
80,000
16,000
64,000
160,000
Square footage %
50.00%
10.00%
40.00%
100.00%
Number of employees
200
50
250
500
Number of employees %
40.00%
10.00%
50.00%
100.00%
A: Cost allocation based on direct costs:
Hotel
Restaurant
Casino
Rembrandt
Revenue
$16,425,000
$ 5,256,000
$12,340,000
$34,021,000
Direct costs
9,819,260
3,749,172
4,248,768
17,817,200
Segment margin
6,605,740
1,506,828
8,091,232
16,203,800
Allocated fixed overhead costs
8,018,505
3,061,320
3,470,175
14,550,000
Segment pre-tax income
$ (1,412,765)
$(1,554,492)
$ 4,621,057
$ 1,653,800
Segment pre-tax income % of rev.
-8.60%
-29.58%
37.45%
B: Cost allocation based on floor space:
Hotel
Restaurant
Casino
Rembrandt
Allocated fixed overhead costs
$ 7,275,000
$ 1,455,000
$ 5,820,000
$14,550,000
Segment pre-tax income
$ (669,260)
$ 51,828
$ 2,271,232
$ 1,653,800
Segment pre-tax income % of rev.
-4.07%
0.99%
18.41%
C: Cost allocation based on number of employees
Hotel
Restaurant
Casino
Rembrandt
Allocated fixed overhead costs
$ 5,820,000
$ 1,455,000
$ 7,275,000
$14,550,000
Segment pre-tax income
$ 785,740
$ 51,828
$ 816,232
$ 1,653,800
Segment pre-tax income % of rev.
4.78%
0.99%
6.61%
14-7
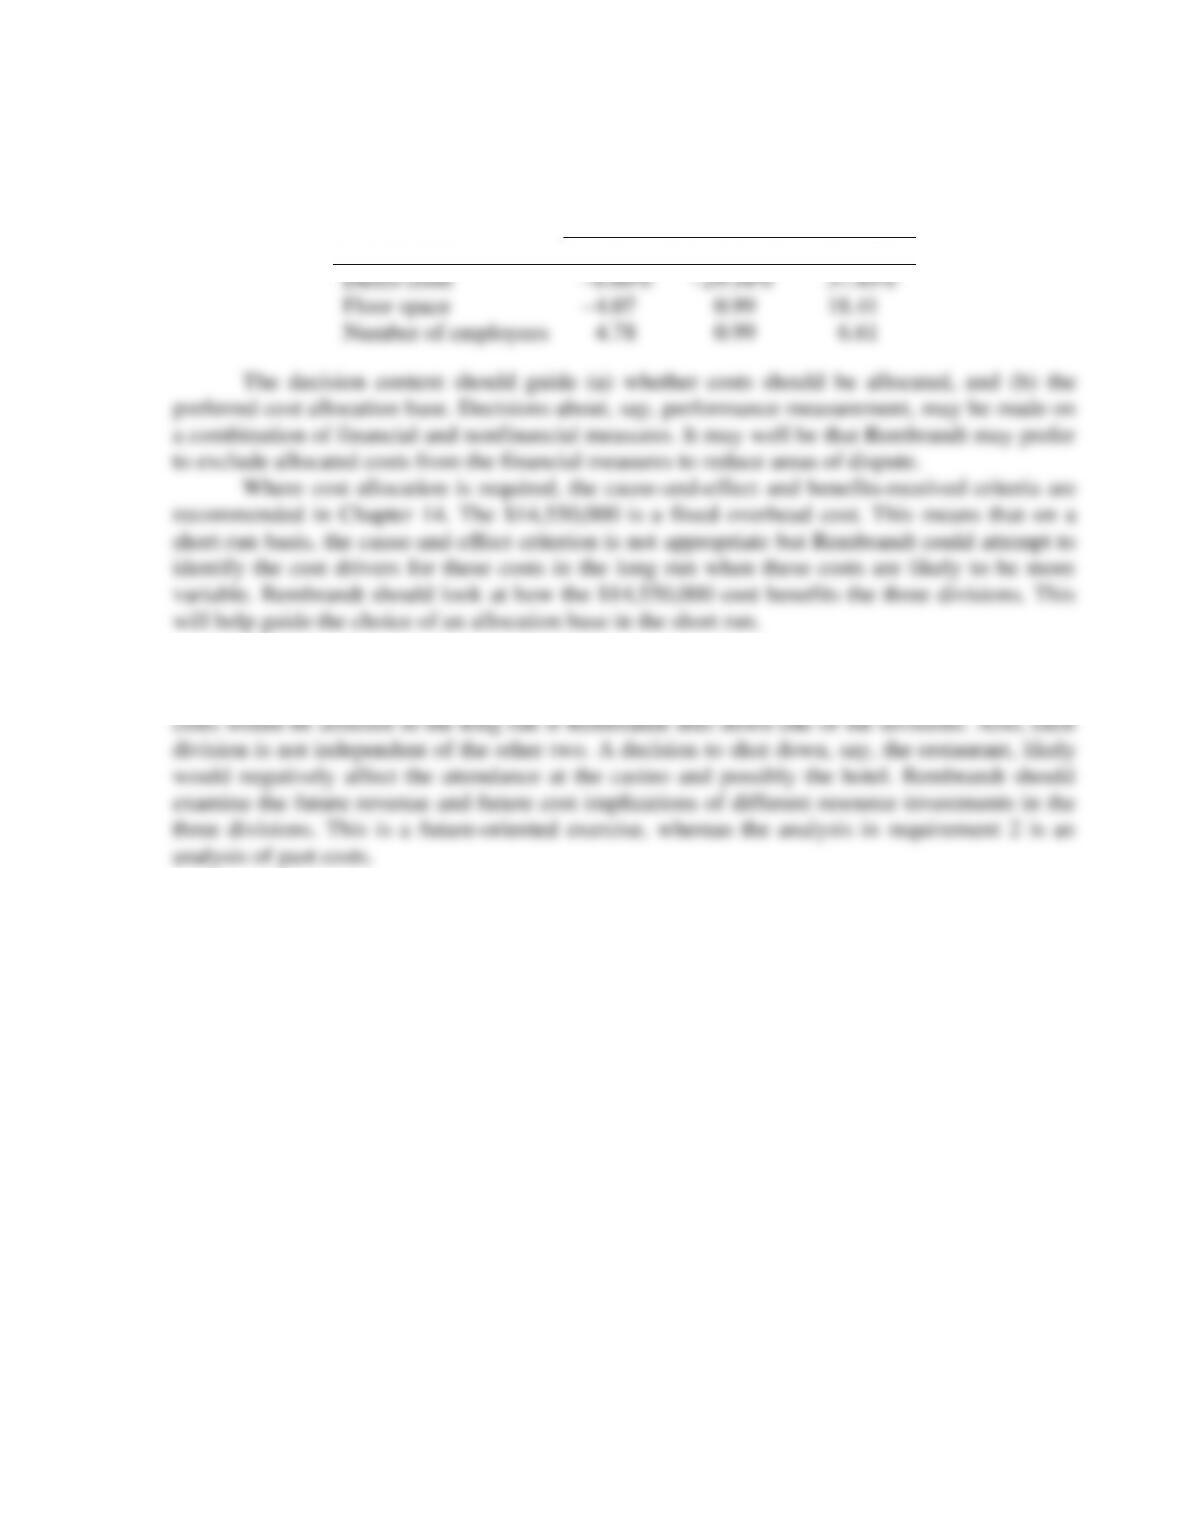
3. Requirement 2 shows the dramatic effect of the choice of cost allocation base on segment
pre-tax income as a percentage of revenues:
Pre-tax Income Percentage
Allocation Base
Hotel
Restaurant
Casino
Direct costs
–8.60%
–29.58%
37.45%
Floor space
–4.07
0.99
18.41
Number of employees
4.78
0.99
6.61
The decision context should guide (a) whether costs should be allocated, and (b) the
preferred cost allocation base. Decisions about, say, performance measurement, may be made on
a combination of financial and nonfinancial measures. It may well be that Rembrandt may prefer
to exclude allocated costs from the financial measures to reduce areas of dispute.
Where cost allocation is required, the cause-and-effect and benefits-received criteria are
recommended in Chapter 14. The $14,550,000 is a fixed overhead cost. This means that on a
short-run basis, the cause-and-effect criterion is not appropriate but Rembrandt could attempt to
identify the cost drivers for these costs in the long run when these costs are likely to be more
variable. Rembrandt should look at how the $14,550,000 cost benefits the three divisions. This
will help guide the choice of an allocation base in the short run.
4. The analysis in requirement 2 should not guide the decision on whether to shut down any
of the divisions. The overhead costs are fixed costs in the short run. It is not clear how these
14-8
14-19 (25 min.) Cost allocation to divisions.
Percentages for various allocation bases (old and new):
Pulp
Paper
Fibers
Total
(1) Division margin percentages
$2,400,000; $7,100,000; $9,500,000
$19,000,000
12.63157%
37.36843%
50.0%
100.0%
(2) Share of employees
$350; 250; 400
1,000
35.0
25.0
40.0
100.0
(3) Share of floor space
35,000; 24,000; 66,000
125,000
28.0
19.2
52.8
100.0
(4) Share of total division administrative costs
$2,000,000; $1,800,000; $3,200,000
$7,000,000
28.57142
25.71428
45.71428
100.0
1.
Pulp
Paper
Fibers
Total
(5) Division margin
$2,400,000
$ 7,100,000
$ 9,500,000
$19,000,000
(6) Corporate overhead allocated on segment
margins = (1)
$9,000,000
1,136,842
3,363,158
4,500,000
9,000,000
(7) Operating margin with division-margin-based
allocation = (5) – (6)
$1,263,158
$ 3,736,842
$ 5,000,000
$10,000,000
(8) Revenues
$8,500,000
$17,500,000
$24,000,000
$50,000,000
Operating margin as a percentage of revenues
14.9%
21.3%
20.8%
20.0%
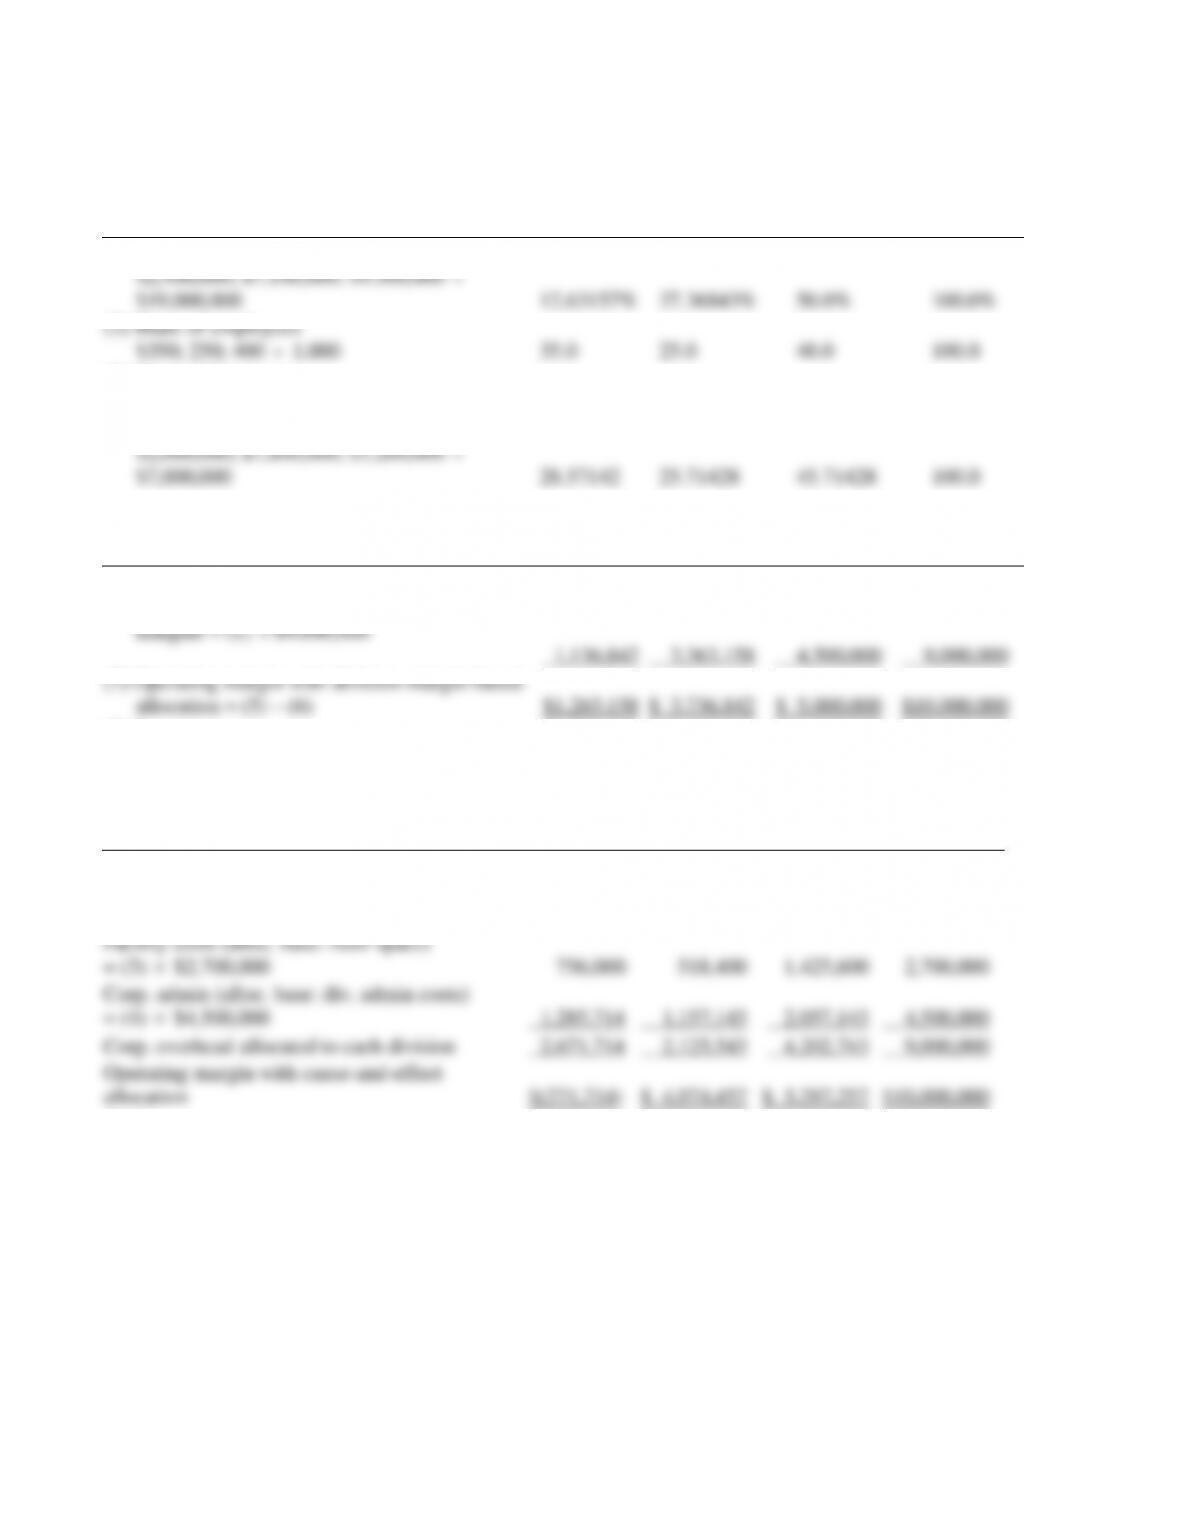
2.
Pulp
Paper
Fibers
Total
(5) Division margin
$2,400,000
$ 7,100,000
$ 9,500,000
$19,000,000
HRM costs (alloc. base: no. of employees)
= (2)
$1,800,000
630 ,000
450,000
720,000
1,800,000
Facility costs (alloc. base: floor space)
= (3)
$2,700,000
756,000
518,400
1,425,600
2,700,000
Corp. admin (alloc. base: div. admin costs)
= (4)
$4,500,000
1,285,714
1,157,143
2,057,143
4,500,000
Corp. overhead allocated to each division
2,671,714
2,125,543
4,202,743
9,000,000
Operating margin with cause-and-effect
allocation
$(271,714)
$ 4,974,457
$ 5,297,257
$10,000,000
(8) Revenues
$8,500,000
$17,500,000
$24,000,000
$50,000,000
Operating margin as a percentage of revenues
-3.2%
28.4%
22.1%
20.0 %
14-9
3. When corporate overhead is allocated to the divisions on the basis of division margins
(requirement 1), each division is profitable (has positive operating margin) and the Paper
division is the most profitable (has the highest operating margin percentage) by a slim margin,
while the Pulp division is the least profitable. When Bardem’s suggested bases are used to
4. The new approach is preferable because it is based on cause-and-effect relationships
between costs and their respective cost drivers in the long run.
Human resource management costs are allocated using the number of employees in each
division because the costs for recruitment, training, etc., are mostly related to the number of
14-10
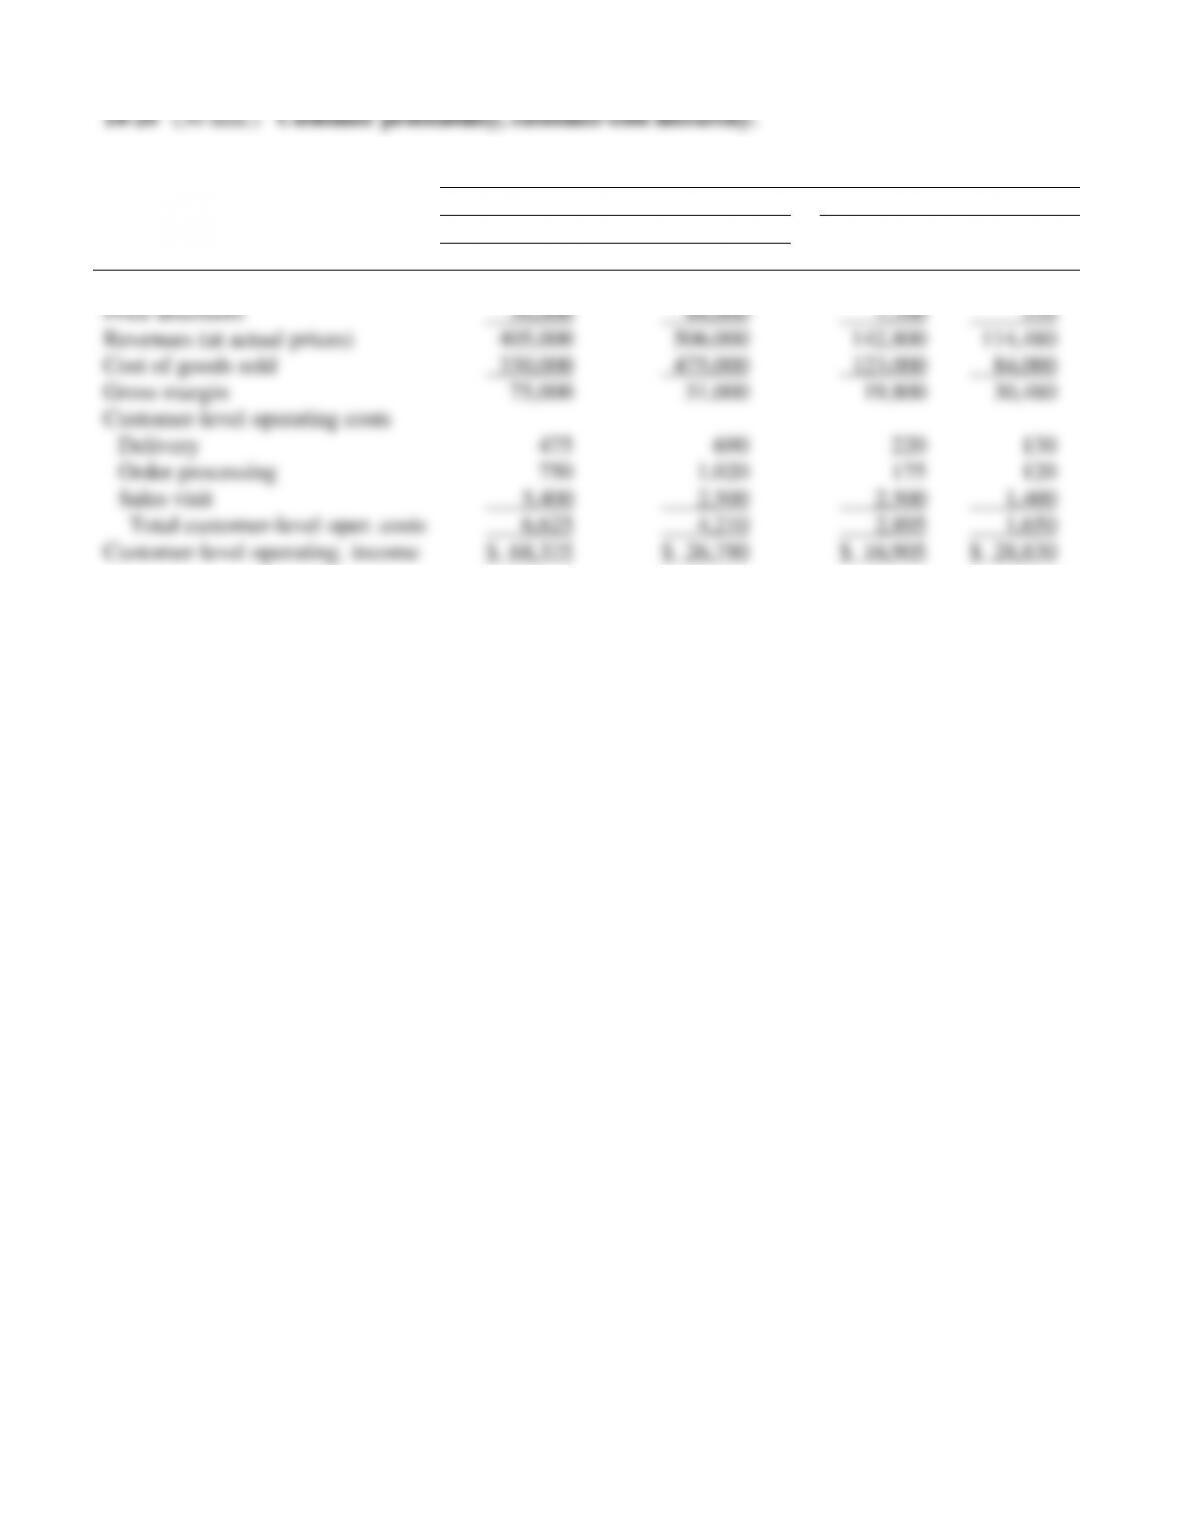
1.
All amounts in thousands of U.S. dollars
Wholesale
Retail
North America
South America
Big Sam
World
Wholesaler
Wholesaler
Stereo
Market
Revenues at list prices
$435,000
$550,000
$150,000
$115,000
Price discounts
30,000
44,000
7,200
520
Revenues (at actual prices)
405,000
506,000
142,800
114,480
Cost of goods sold
330,000
475,000
123,000
84,000
Gross margin
75,000
31,000
19,800
30,480
Customer-level operating costs
Delivery
475
690
220
130
Order processing
750
1,020
175
120
Sales visit
5,400
2,500
2,500
1,400
Total customer-level oper. costs
6,625
4,210
2,895
1,650
Customer-level operating. income
$ 68,375
$ 26,790
$ 16,905
$ 28,830