19-37
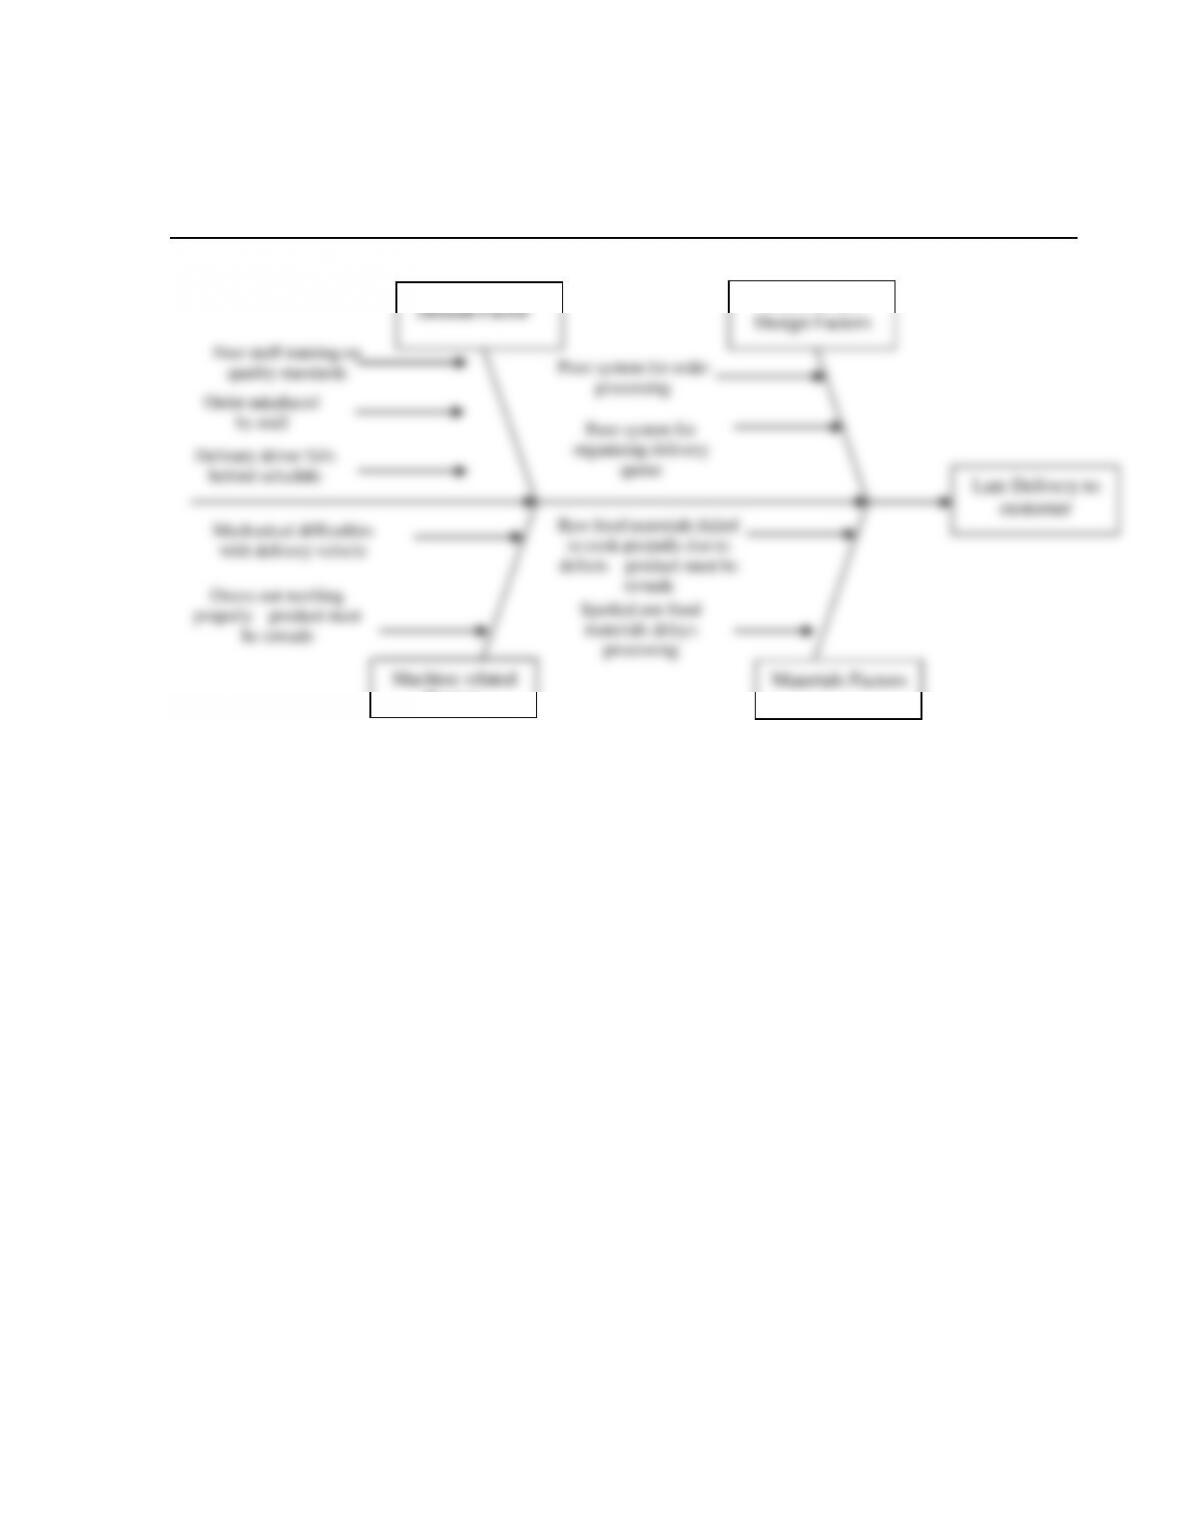
3. Solution Exhibit 19-37B presents a cause-and-effect or fishbone diagram for the problem of
“late deliveries.”
SOLUTION EXHIBIT 19-37B
Cause-and-Effect Diagram for incidents of “late delivery” to customer at Pauli’s Pizza:
Methods and
Machine related
Factors
Materials Factors
Human Factor
19-38
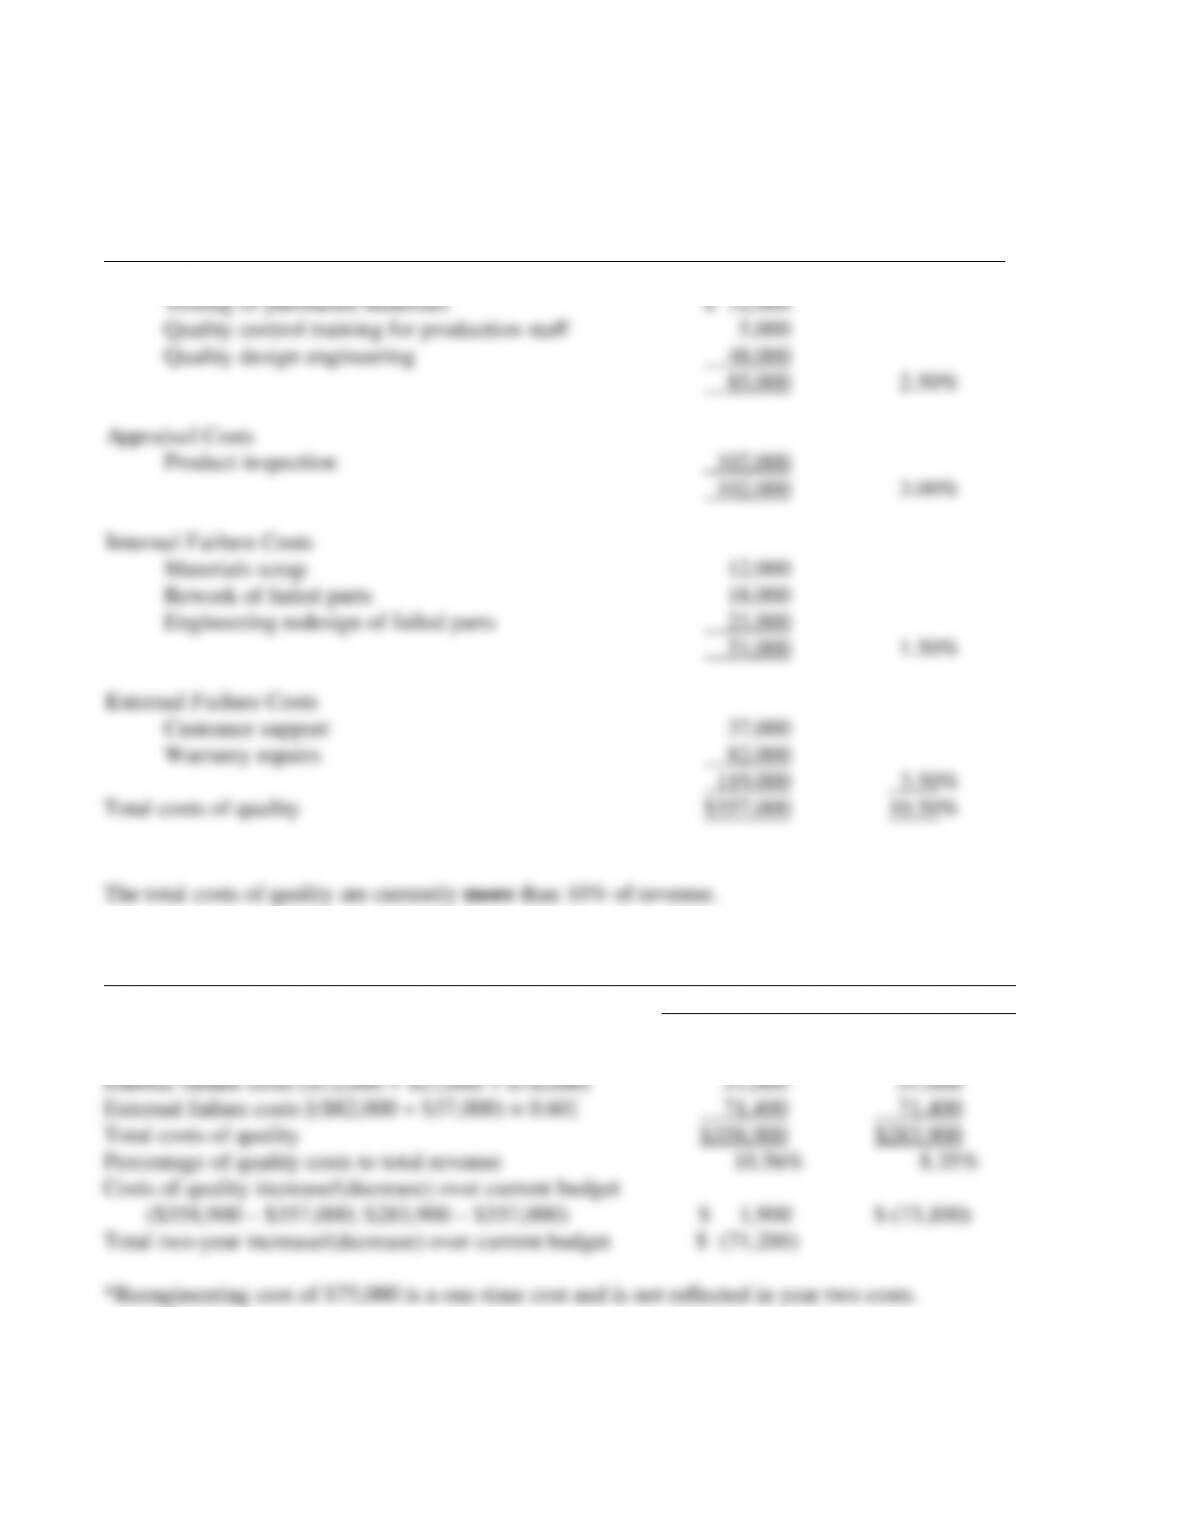
19-38 (30–35 min.) Ethics and quality.
Total Revenue $3,400,000
Costs of Quality
Cost
Percentage of
Total Revenue
Prevention Costs
Testing of purchased materials
$ 32,000
Quality control training for production staff
5,000
Quality design engineering
48,000
85,000
2.50%
Appraisal Costs
Product inspection
102,000
102,000
3.00%
Internal Failure Costs
Materials scrap
12,000
Rework of failed parts
18,000
Engineering redesign of failed parts
21,000
51,000
1.50%
External Failure Costs
Customer support
37,000
Warranty repairs
82,000
119,000
3.50%
Total costs of quality
$357,000
10.50%
The total costs of quality are currently more than 10% of revenue.
2.
Option 1: Purchase of New Manufacturing Equipment
Year One
Year Two*
Prevention costs ($32,000 + $5,000 + $48,000 + $75,000)
$160,000
$ 85,000
Appraisal costs ($102,000 × 0.75)
76,500
76,500
Internal failure costs ($12,000 + $21,000 + $18,000)
51,000
51,000
External failure costs [($82,000 + $37,000) × 0.60]
71,400
71,400
Total costs of quality
$358,900
$283,900
Percentage of quality costs to total revenue
10.56%
8.35%
Costs of quality increase/(decrease) over current budget
($358,900 – $357,000; $283,900 – $357,000)
$ 1,900
$ (73,100)
Total two-year increase/(decrease) over current budget
$ (71,200)
*Reengineering cost of $75,000 is a one-time cost and is not reflected in year two costs.
19-39
Option 2: Increase Quality Control Training by $15,000 per Year
Year One
Year Two*
Prevention costs ($32,000 + $20,000 + $48,000)
$100,000
$100,000
Appraisal costs ($102,000 × 0.9)
91,800
91,800
Internal failure costs ($12,000 + $21,000 + $18,000)
51,000
51,000
External failure costs [($82,000 + $37,000) × 0.80]
95,200
95,200
Total costs of quality
$338,000
$338,000
Percentage of quality costs to total revenue
9.94%
9.94%
Costs of quality increase/(decrease) over current budget
($338,000 – $357,000)
$ (19,000)
$ (19,000)
Total two-year increase/(decrease) over current budget
$ (38,000)
*Reengineering cost is a one-time cost and is not reflected in year two costs.
3. Nancy faces a difficult situation. On the one hand, she could argue that she is following
corporate guidelines in choosing what to report and so only reports options that satisfy it. On the
other hand, the guideline does not appear to be so strict that Nancy or Chris would not be able to
seek an exception, particularly because quality costs are only slightly greater than 10% of
revenues in the first year because of the one-time reengineering costs. Taking this second view,
19-40
1. Consider the incremental revenues and incremental costs to Wellesley Corporation of
purchasing additional grey cloth from outside suppliers.
Incremental revenues, $1,250 × (5,000 rolls × 0.90) $5,625,000
9,500) rolls per month, purchasing grey cloth from outside entails zero opportunity costs. Yes,
the Printing Department should buy the grey cloth from the outside supplier.
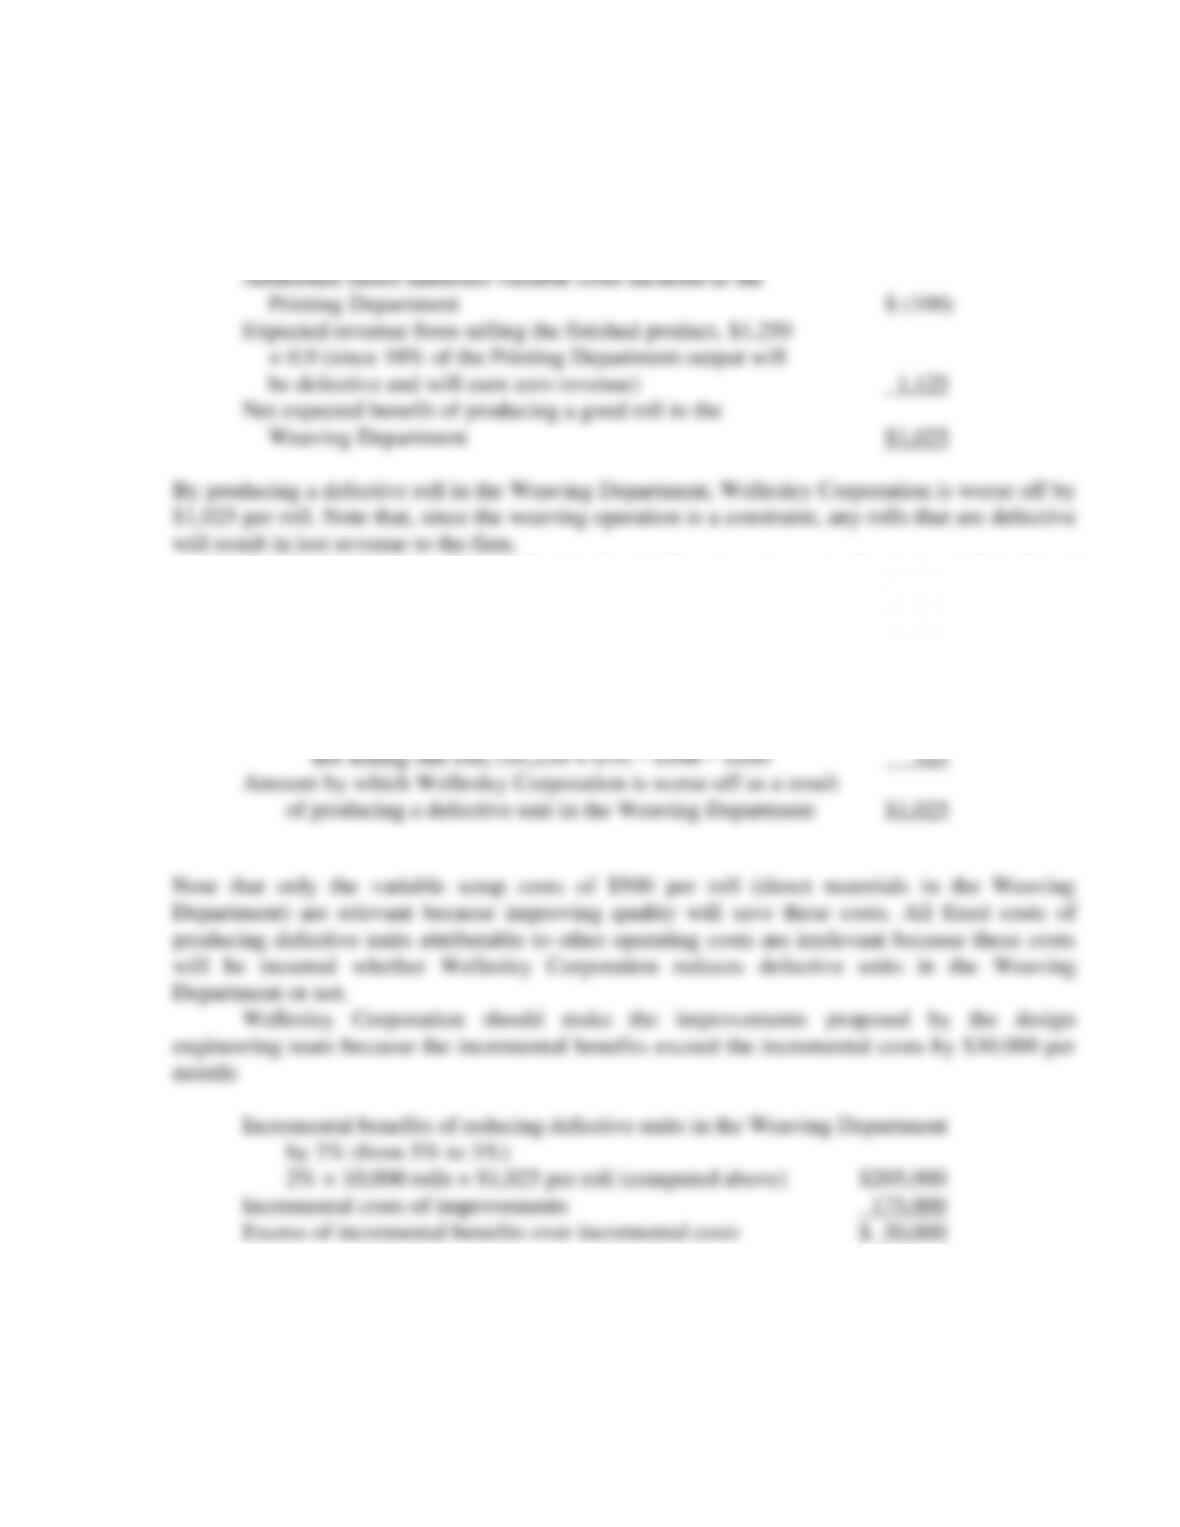
2. By producing a defective roll in the Weaving Department, Wellesley Corporation is
worse off by the entire amount of revenue forgone of $1,250 per roll. Note that, since the
weaving operation is a constraint, any rolls received by the Printing Department that are
defective and disposed of at zero net disposal value result in lost revenue to the firm.
An alternative approach to analyzing the problem is to focus on the costs of defective
19-41
3. To determine how much Wellesley Corporation is worse off by producing a defective roll
in the Weaving Department, consider the payoff to Wellesley from not having a defective roll
produced in the Weaving Department. The good roll produced in the Weaving Department will
be sent for further processing in the Printing Department. The relevant costs and benefits of
printing and selling this roll follow:
An alternative approach to analyzing the problem is to focus on the costs and benefits of
reducing defective units.
The relevant costs of defective units in the Weaving Department are:
a. Direct materials variable costs in the Weaving Department $ 500
b. Expected unit contribution margin forgone from