13-11
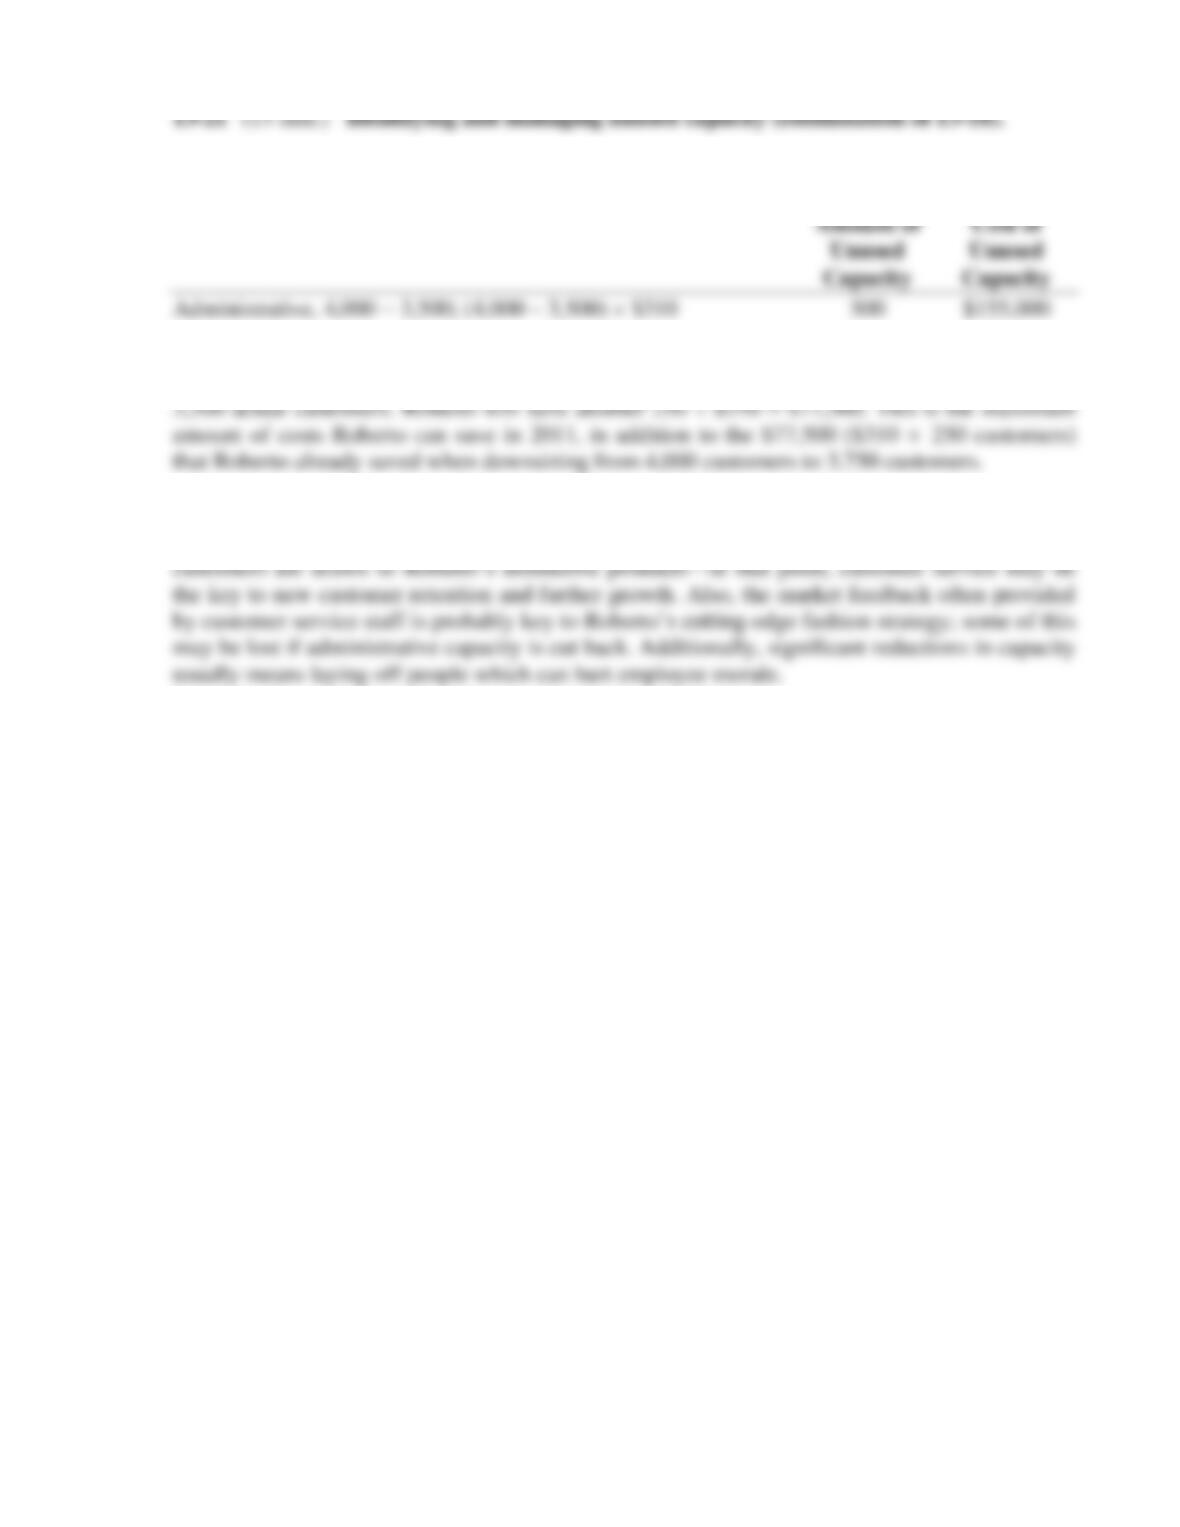
1. The amount and cost of unused capacity at the beginning of year 2011 based on year
2011 production follows:
2. Roberto can reduce administrative capacity by another 250 customers (3,750 – 250 =
3. Before Roberto downsizes administrative capacity, it should consider whether sales
increases in the future would lead to a greater demand for and utilization of capacity as new
13-12
1. Stanmore Corporation follows a product differentiation strategy in 2011. Stanmore’s
price.
2. Balanced Scorecard measures for 2011 follow:
Financial Perspective
(1) Increase in operating income from charging higher margins, (2) price premium earned on
products.
(1) Market share in high-end special-purpose textile machines, (2) customer satisfaction, (3) new
customers.
(1) Manufacturing quality and reduced wastage of direct materials, (2) new product features
added, (3) order delivery time.
(1) Development time for designing new machines, (2) improvements in manufacturing
processes, (3) employee education and skill levels, (4) employee satisfaction.
13-13
13-23 (30 min.) Strategic analysis of operating income (continuation of 13-22).
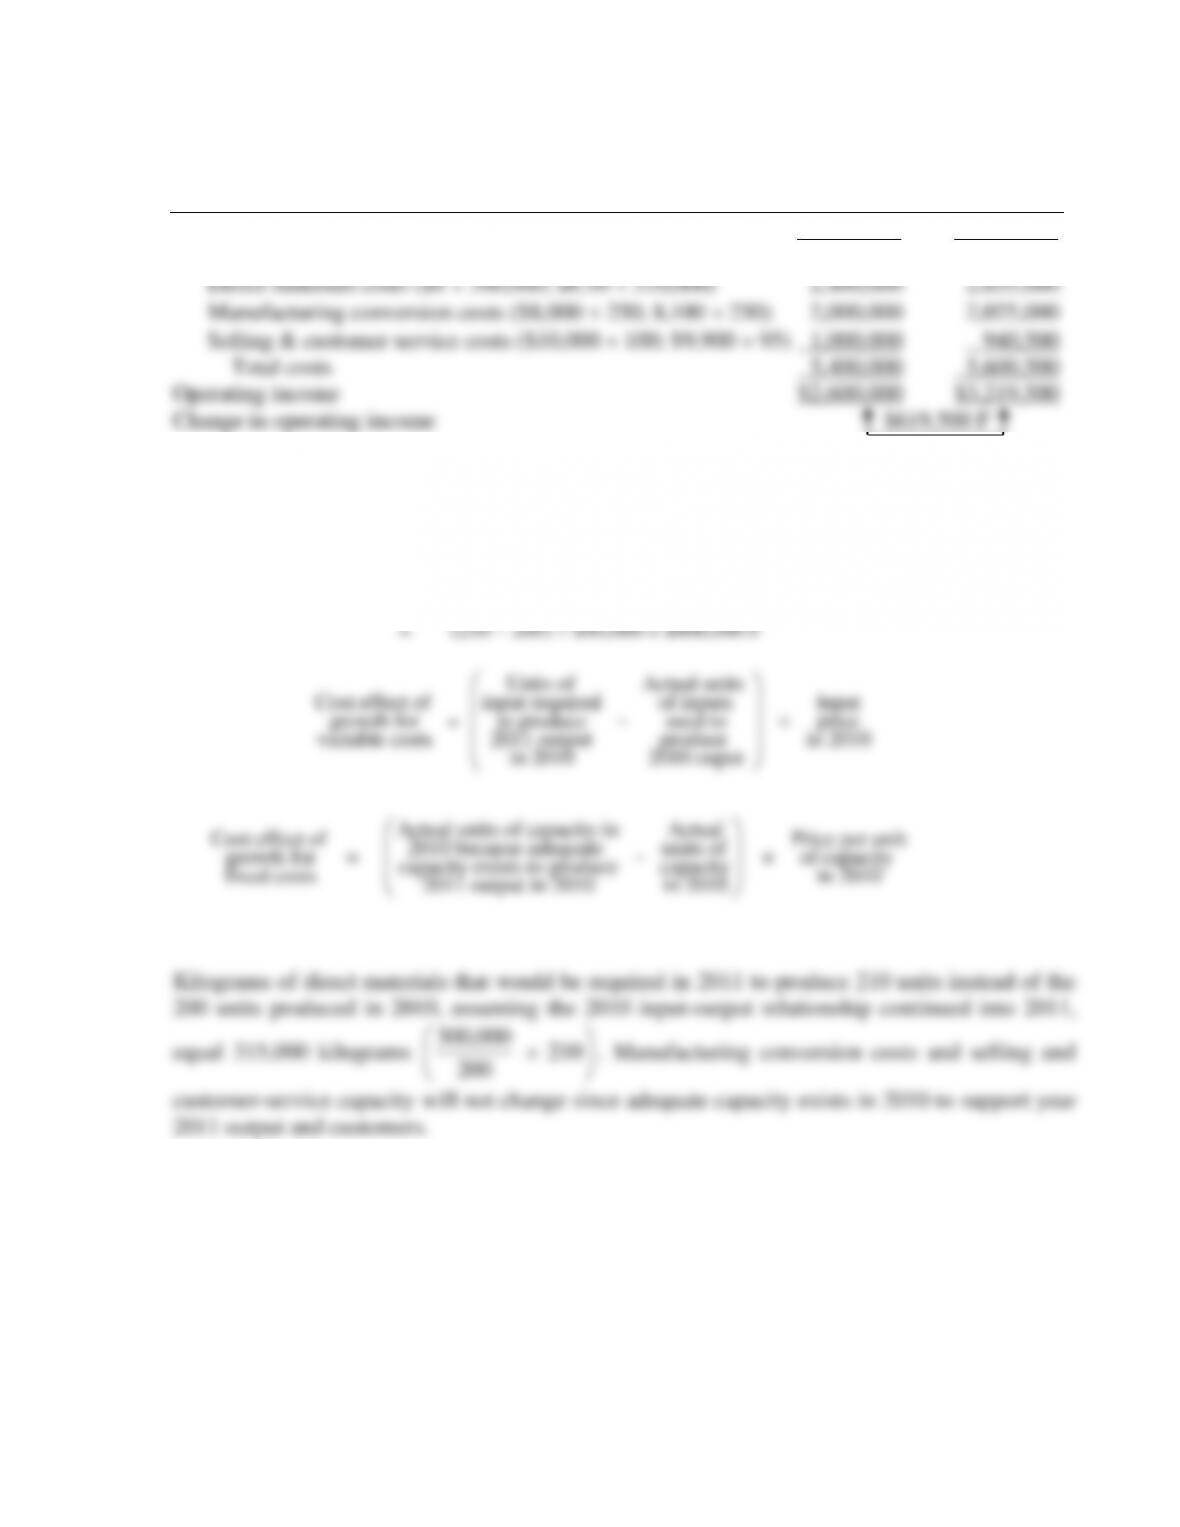
1. Operating income for each year is as follows:
2010 2011
Revenue ($40,000 200; $42,000 210) $8,000,000 $8,820,000
Costs
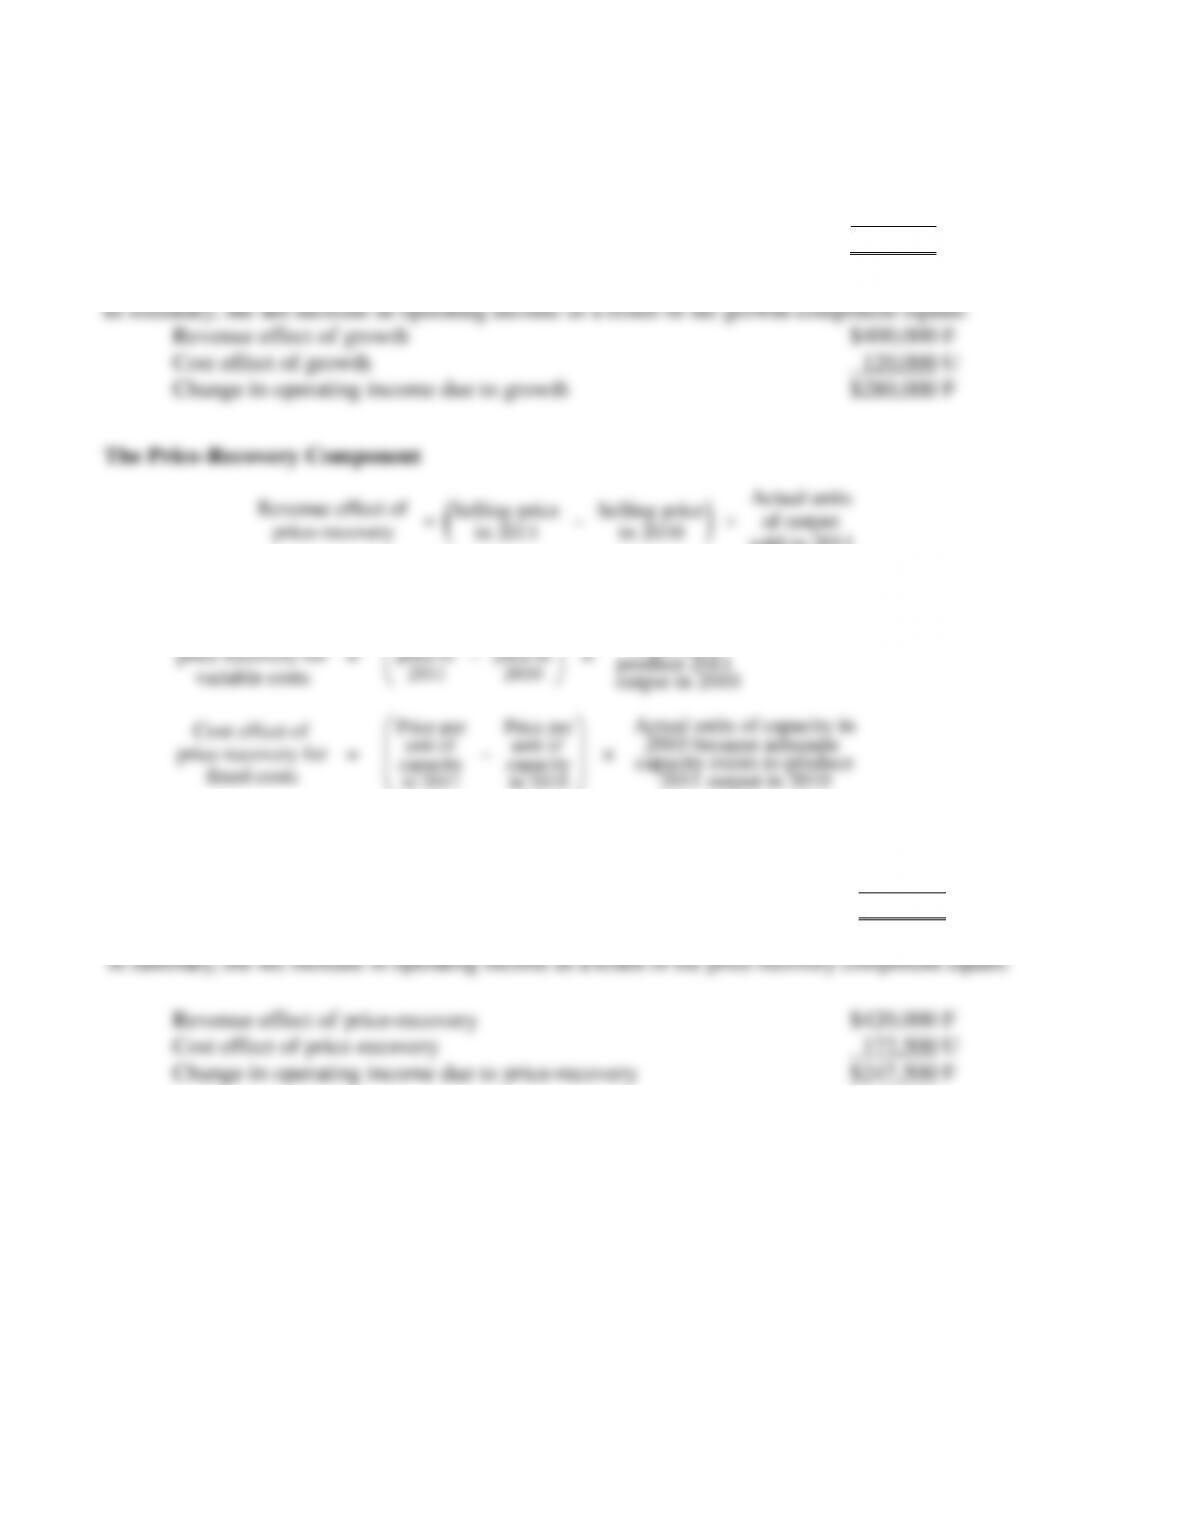
2. The Growth Component
Revenue effect
of growth
=
Actual units Actual units of Selling
of output sold output sold price
in 2011 in 2010 in 2010
−
13-14
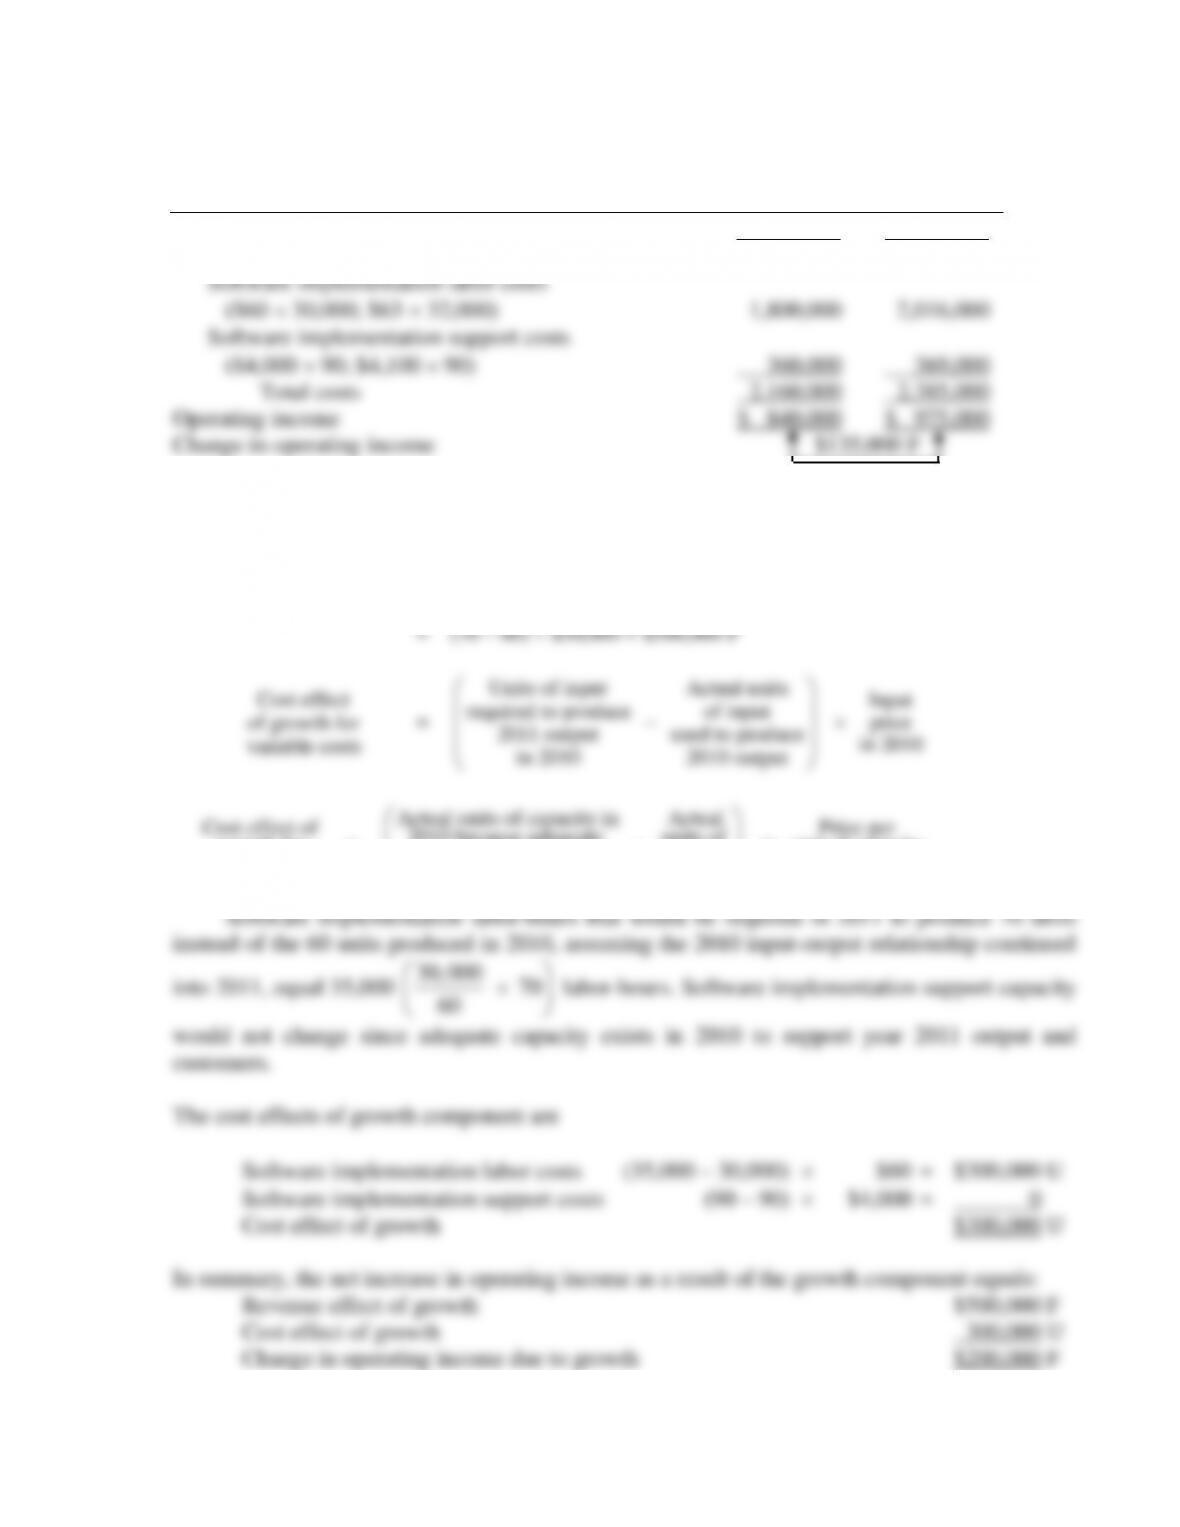
The cost effects of growth component are:
Direct materials costs (315,000 − 300,000) $8 = $120,000 U
Manufacturing conversion costs (250 − 250) $8,000 = 0
Selling & customer-service costs (100 − 100) $25,000 = 0
Cost effect of growth $120,000 U
price-recovery
()
in 2011 in 2010 sold in 2011
= ($42,000 − $40,000) 210 = $420,000 F
Cost effect of
variable costs
Input Input
2011 2010
Units of input
required to
produce 2011
output in 2010
Cost effect of
fixed costs
Price per Price per
unit of unit of
capacity capacity
in 2011 in 2010
Actual units of capacity in
2010 because adequate
capacity exists to produce
2011 output in 2010
Direct materials costs ($8.50 − $8) 315,000 = $157,500 U
Manufacturing conversion costs ($8,100 − $8,000) 250 = 25,000 U
Selling & customer-service costs ($9,900 − $10,000) 100 = 10,000 F
Cost effect of price-recovery $172,500 U
In summary, the net increase in operating income as a result of the price-recovery component equals:
Revenue effect of price-recovery $420,000 F
Cost effect of price-recovery 172,500 U
Change in operating income due to price-recovery $247,500 F
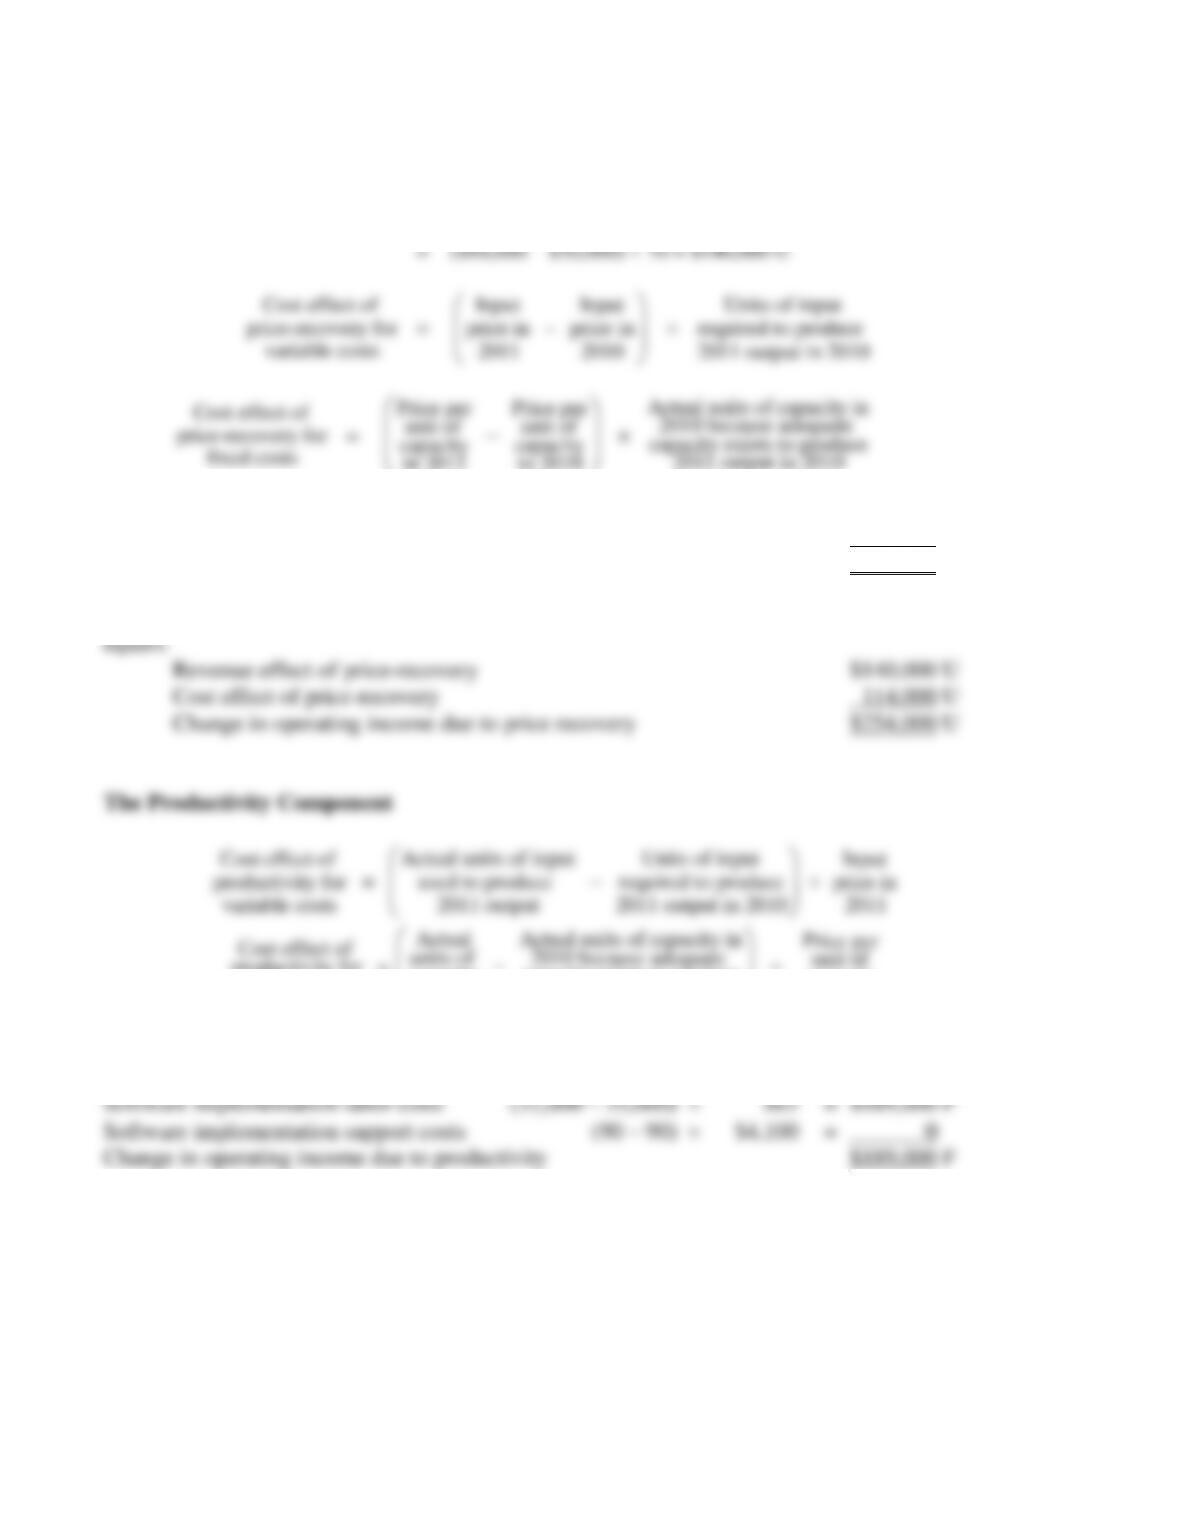
The Productivity Component
Cost effect of
productivity for
variable costs
=
Actual units of Units of input
input used required to
to produce produce 2011
2011 output ouput in 2010
−
Input
price
in 2011
Cost effect of
productivity for
fixed costs
=
Actual Actual units of capacity in
units of 2010 because adequate
capacity capacity exists to produce
in 2011 2011 output in 2010
−
Price per
unit of
capacity
in 2011
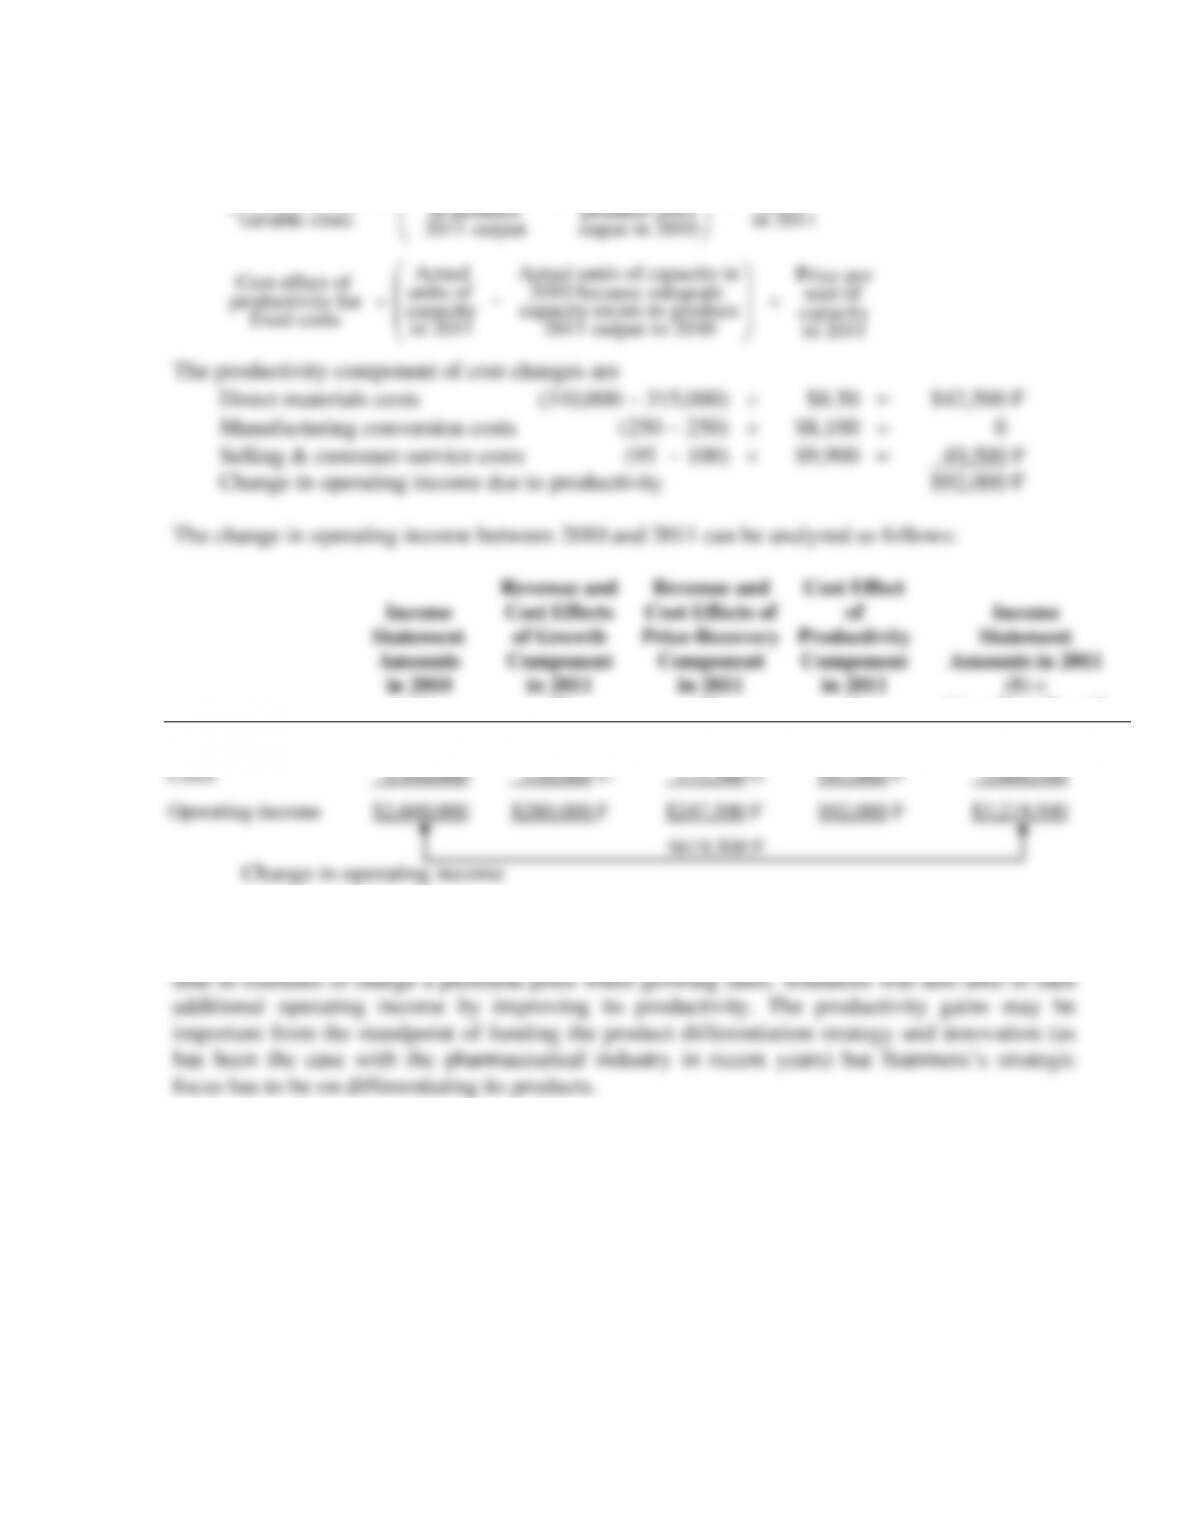
The productivity component of cost changes are
Direct materials costs (310,000 − 315,000) $8.50 = $42,500 F
Manufacturing conversion costs (250 − 250) $8,100 = 0
Selling & customer-service costs (95 − 100) $9,900 = 49,500 F
Change in operating income due to productivity $92,000 F
The change in operating income between 2010 and 2011 can be analyzed as follows:
Income
Statement
Amounts
in 2010
(1)
Revenue and
Cost Effects
of Growth
Component
in 2011
(2)
Revenue and
Cost Effects of
Price-Recovery
Component
in 2011
(3)
Cost Effect
of
Productivity
Component
in 2011
(4)
Income
Statement
Amounts in 2011
(5) =
(1) + (2) + (3) + (4)
Revenues
$8,000,000
$400,000 F
$420,000 F
−−
$8,820,000
Costs
5,400,000
120,000 U
172,500 U
$92,000 F
5,600,500
Operating income
$2,600,000
$280,000 F
$247,500 F
$92,000 F
$3,219,500
3. The analysis of operating income indicates that a significant amount of the increase in
operating income resulted from Stanmore’s product differentiation strategy. The company was
13-16
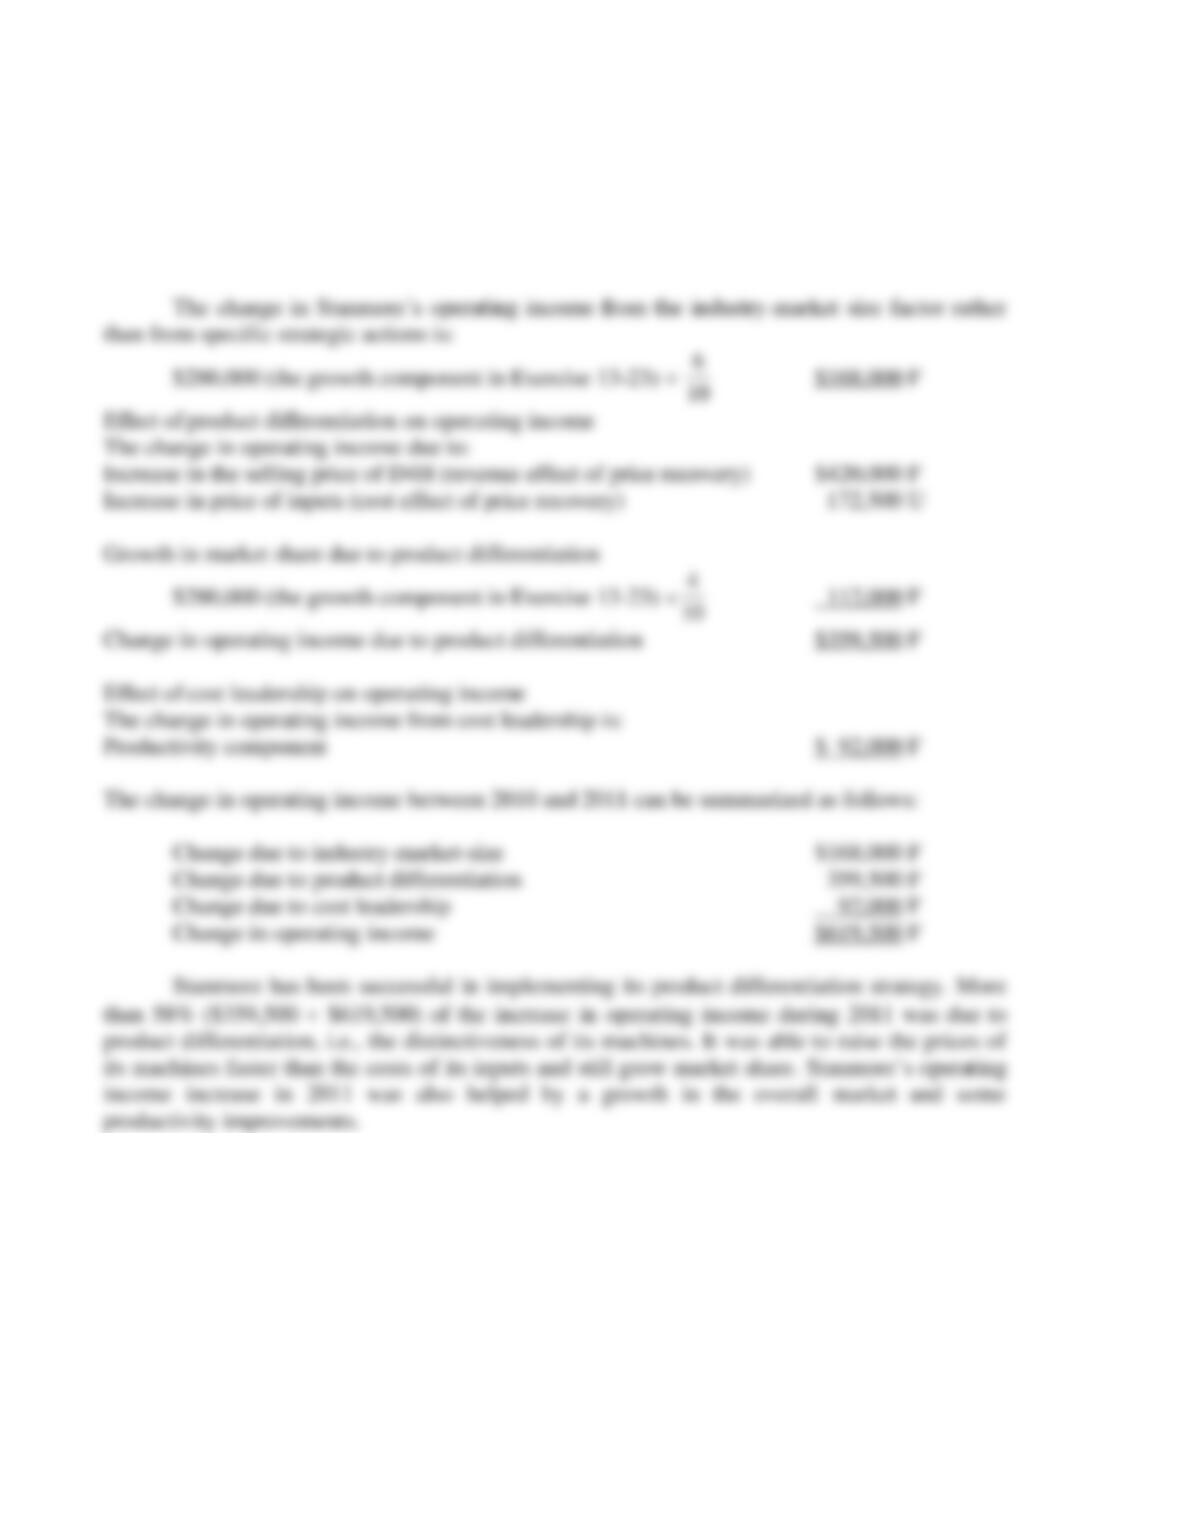
13-24 (20 min.)Analysis of growth, price-recovery, and productivity components
(continuation of 13-23).
Effect of the industry-market-size factor on operating income
Of the 10-unit increase in sales from 200 to 210 units, 3% or 6 (3% 200) units is due to
growth in market size, and 4 (10 − 6) units is due to an increase in market share.
13-17
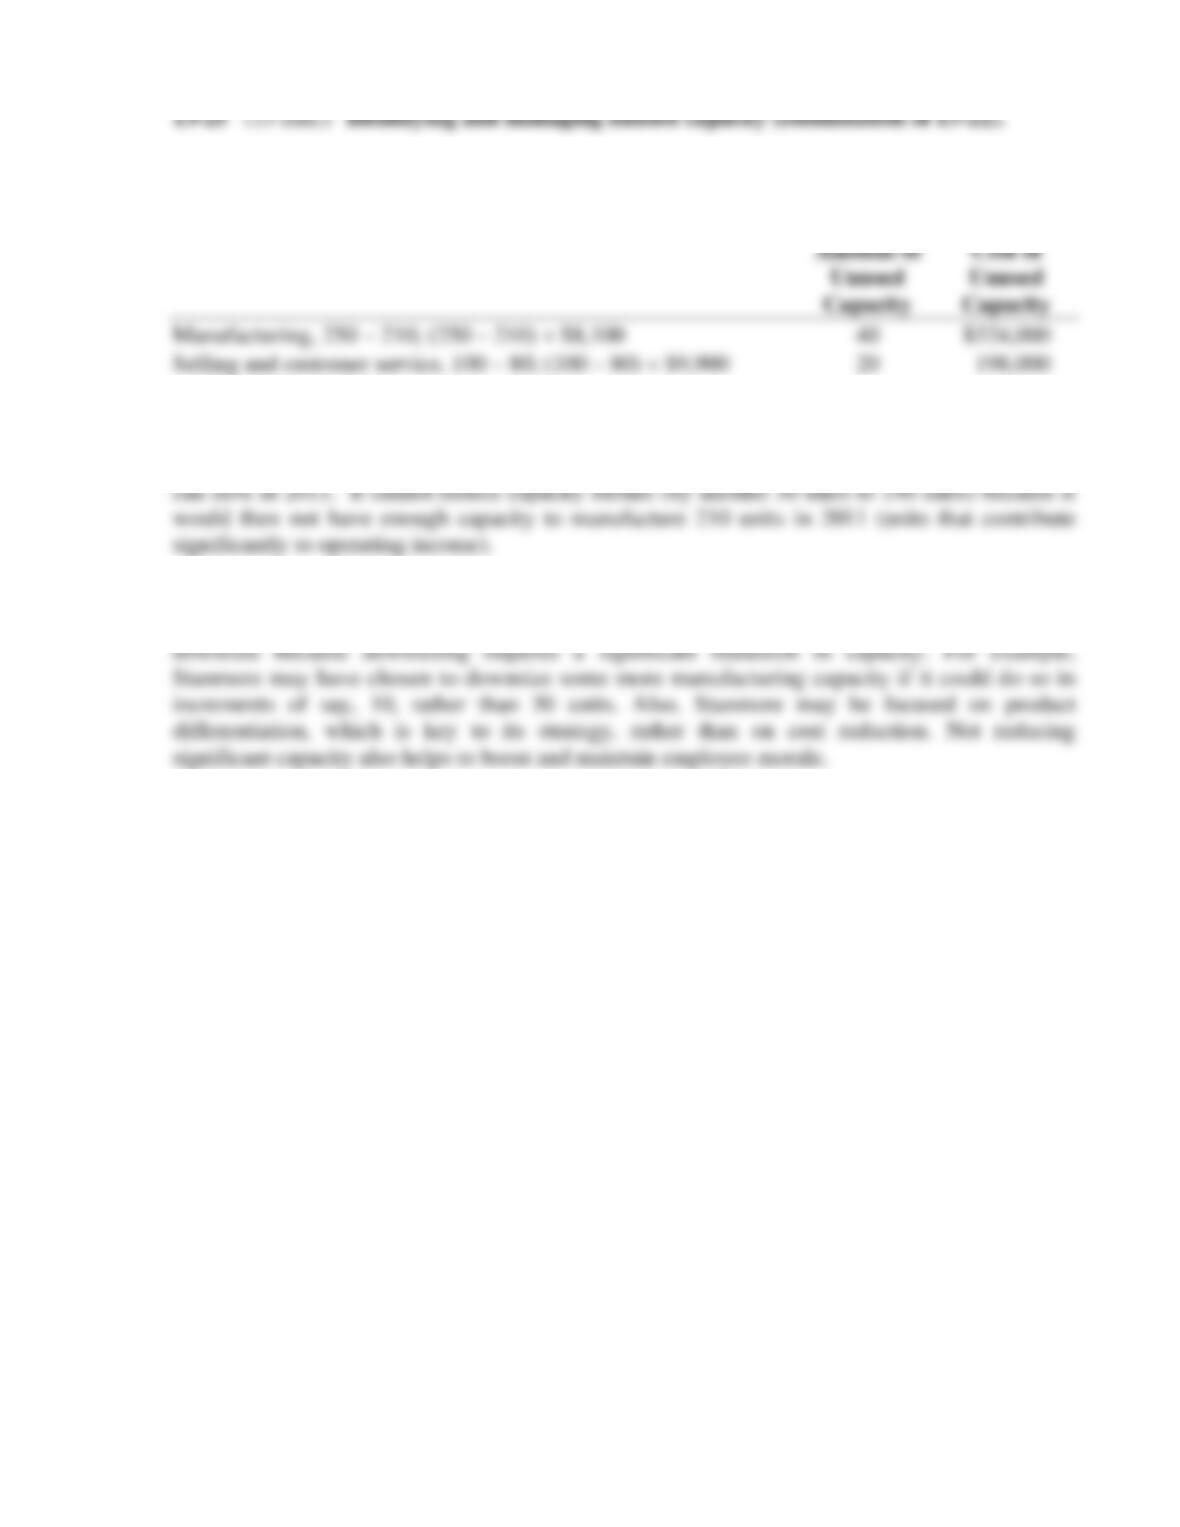
1. The amount and cost of unused capacity at the beginning of year 2011 based on year
2011 production follows:
2. Stanmore can reduce manufacturing capacity from 250 units to 220 (250 − 30) units.
Stanmore will save 30 $8,100 = $243,000. This is the maximum amount of costs Stanmore
3. Stanmore may choose not to downsize because it projects sales increases that would lead
to a greater demand for and utilization of capacity. Stanmore may have also decided not to
13-18
1. Westlake Corporation’s strategy in 2011 is cost leadership. Westlake’s consulting
2. Balanced Scorecard measures for 2011 follow:
Financial Perspective
(3) cost reductions in key areas, for example, software implementation and overhead costs.
(1) Market share, (2) new customers, (3) customer responsiveness, (4) customer satisfaction.
Westlake’s strategy should result in improvements in these customer measures that help
(1) Time to complete customer jobs, (2) time lost due to errors, (3) quality of job (Is system
running smoothly after job is completed?)
(1) Time required to analyze and design implementation steps, (2) time taken to perform key
steps implementing the software, (3) skill levels of employees, (4) hours of employee training,
(5) employee satisfaction and motivation.
13-27 (30 min.) Strategic analysis of operating income (continuation of 13-26).
1. Operating income for each year is as follows:
2010 2011
Revenues ($50,000 60; $48,000 70) $3,000,000 $3,360,000
Costs
2. The Growth Component
Revenue effect
of growth
=
Actual units of Actual units of
output sold output sold
in 2011 in 2010
−
Selling
price
in 2010
The Price-Recovery Component
Revenue effect of
price-recovery
=
()
Actual units
Selling price Selling price
of output
in 2011 in 2010 sold in 2011
−