14-11
2.
Customer Distribution Channels
(all amounts in $000s)
Wholesale Customers
Retail Customers
Total
Total
North America
South America
Total
Big Sam
World
(all customers)
Wholesale
Wholesaler
Wholesaler
Retail
Stereo
Market
(1) = (2) + (5)
(2) = (3) + (4)
(3)
(4)
(5) = (6) + (7)
(6)
(7)
Revenues (at actual prices)
$1,168,280
$911,000
$405,000
$506,000
$257,280
$142,800
$114,480
Customer-level costs
1,027,380
815,835
336,625 a
479,210 a
211,545
125,895 a
85,650 a
Customer-level operating income
140,900
95,165
$ 68,375
$ 26,790
45,735
$ 16,905
$ 28,830
Distribution-channel costs
39,000
34,000
5,000
Distribution-channel-level oper. income
101,900
$ 61,165
$ 40,735
Corporate-sustaining costs
61,000
Operating income
$ 40,900
3. If corporate costs are allocated to the channels, the retail channel will show an operating profit of
$27,735,000 ($40,735,000 – $13,000,000), and the wholesale channel will show an operating profit of
$13,165,000 ($61,165,000 – $48,000,000). The overall operating profit, of course, is still $40,900,000,
14-12
1.
Avery
Okie
Wizard
Grainger
Duran
Revenues
$260,000
$200,000
$322,000
$122,000
$212,000
Technician and equipment cost
182,000
175,000
225,000
107,000
178,000
Gross margin
78,000
25,000
97,000
15,000
34,000
Service call handling
($75
150; 240; 40; 120; 180)
11,250
18,000
3,000
9,000
13,500
Web-based parts ordering
($80
120; 210; 60; 150; 150)
9,600
16,800
4,800
12,000
12,000
Billing/Collection
($50
30; 90; 90; 60; 120)
1,500
4,500
4,500
3,000
6,000
Database maintenance
($10
150; 240; 40; 120; 180)
1,500
2,400
400
1,200
1,800
Customer-level operating income
$ 54,150
$ (16,700)
$ 84,300
$(10,200)
$ 700
2. Customers Ranked on Customer-Level Operating Income
Cumulative
Customer-Level
Operating Income
Customer-Level
Customer-Level
Cumulative
as a % of Total
Operating
Customer
Operating Income
Customer-Level
Customer-Level
Customer
Income
Revenue
as a % of Revenue
Operating Income
Operating Income
Code
(1)
(2)
(3) = (1)
(2)
(4)
(5) = (4)
$112,250
Wizard
$ 84,300
$ 322,000
26.18%
$ 84,300
75%
Avery
54,150
260,000
20.83%
138,450
123%
Duran
700
212,000
0.33%
139,150
124%
Grainger
(10,200)
122,000
-8.36%
128,950
115%
Okie
(16,700)
200,000
-8.35%
112,250
100%
$112,250
$1,116,000
14-13
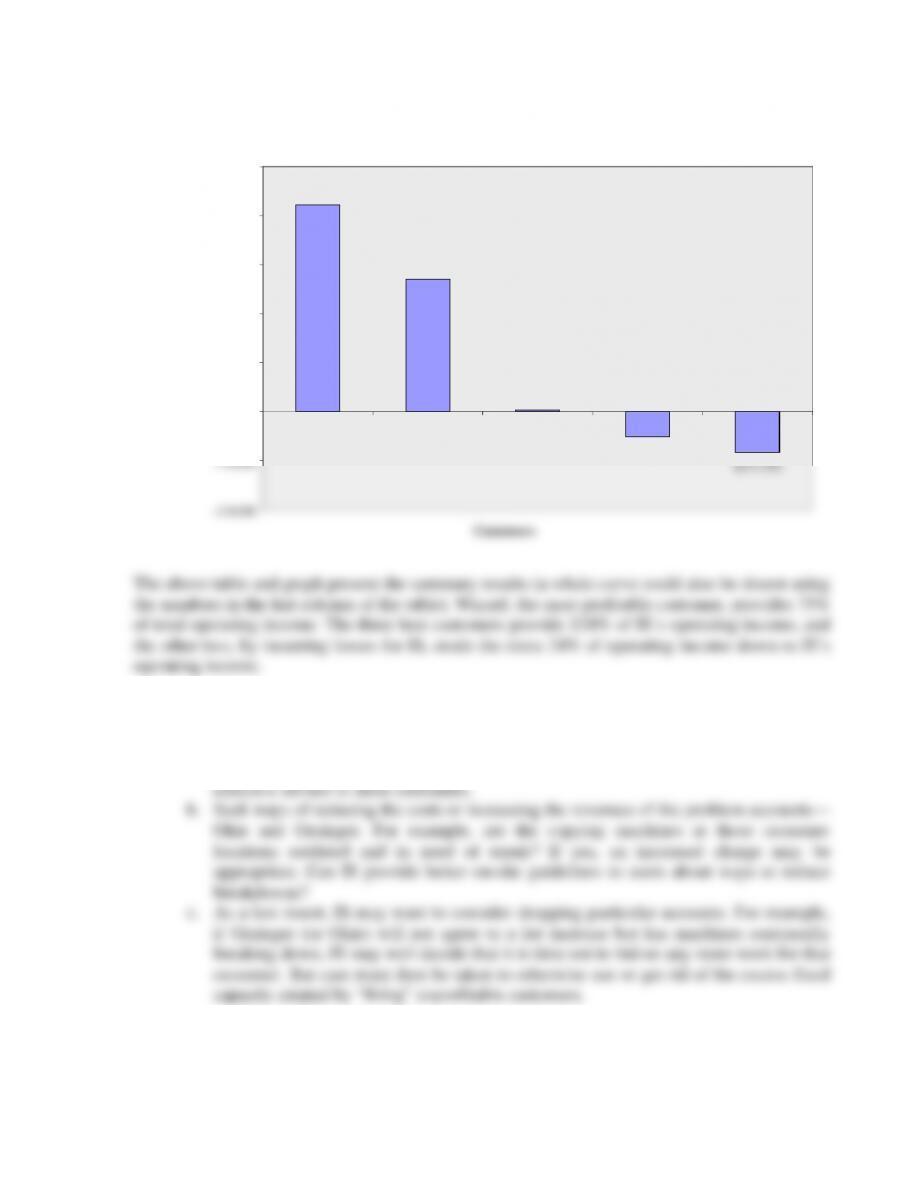
3. The options that Instant Service should consider include:
a. Increase the attention paid to Wizard and Avery. These are “key customers,” and
every effort has to be made to ensure they retain IS. IS may well want to suggest a
minor price reduction to signal how important it is in their view to provide a cost–
Customer-Level Operating Income
$84,300
$54,150
$700
$(10,200)
$0
$20,000
$40,000
$60,000
$80,000
$100,000
Customer-Level Operating Income
Grainger
Avery
Okie
Duran
Wizard
14-14
1. The activity-based costing for each customer is:
Charleston
Pharmacy
Chapel Hill
Pharmacy
2. Line-item ordering,
$3 × (13 × 9; 10 × 18) 351 540
4. Carton deliveries,
$1 × (7 × 22; 10 × 20) 154 200
5. Shelf-stocking,
$16 × (7 × 0; 10 × 0.5) 0 80
Operating costs $1,375 $1,720
The operating income of each customer is:
Charleston
Pharmacy
Chapel Hill
Pharmacy
Revenues,
$2,400 × 7; $1,800 × 10 $16,800 $18,000
Cost of goods sold,
$2,100 × 7; $1,650 × 10 14,700 16,500
Gross margin 2,100 1,500
Operating costs 1,375 1,720
Operating income $ 725 $ (220)
Chapel Hill Pharmacy has a lower gross margin percentage than Charleston (8.33% vs. 12.50%)
and consumes more resources to obtain this lower margin. Serving Chapel Hill necessitates more
deliveries and delivery of more items in each order, albeit lower-priced ones that don’t contribute
much to Figure Four’s income. Overall, Charleston is a profitable customer while Chapel Hill is
not.
2. Ways Figure Four could use this information include:
a. Pay increased attention to the top 20% of the customers. This could entail asking them for
ways to improve service. Alternatively, you may want to highlight to your own personnel
the importance of these customers; e.g., it could entail stressing to delivery people the
14-15
There are several options here:
• Simple verbal persuasion by showing customers cost drivers at Figure Four.
• Explicitly pricing out activities like cartons delivered and shelf-stocking so that
customers pay for the costs they cause.
14-23 (30–40 min.) Variance analysis, multiple products.
1. Sales-volume
variance =
unitsin quantity sales Actual
–
unitsin quantity sales Budgeted
per ticketmargin oncontributi Budgeted
2.
unitper margin on contributi average Budgeted
=
000,10
$5) (6,000 $20) 000,4( +
=
10,000
$30,000 000,80$+
=
000,10
000,110$
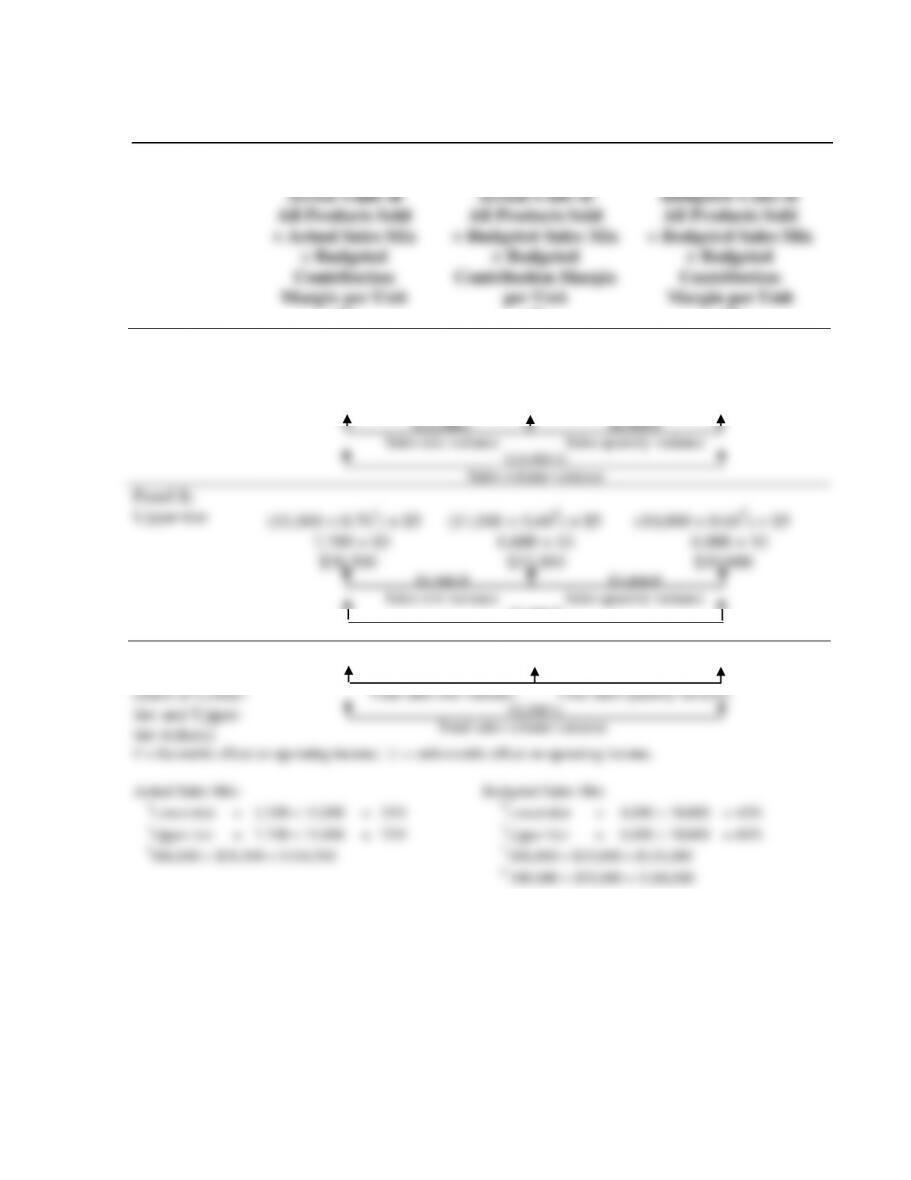
SOLUTION EXHIBIT 14-23
Columnar Presentation of Sales-Volume, Sales-Quantity and Sales-Mix Variances for Detroit
Penguins
Flexible Budget:
Actual Units of
All Products Sold
× Actual Sales Mix
× Budgeted
Contribution
Margin per Unit
(1)
Actual Units of
All Products Sold
× Budgeted Sales Mix
× Budgeted
Contribution Margin
per Unit
(2)
Static Budget:
Budgeted Units of
All Products Sold
× Budgeted Sales Mix
× Budgeted
Contribution
Margin per Unit
(3)
Panel A:
Lower-tier
(11,000 × 0.30a) × $20
3,300 × $20
(11,000 × 0.40b) × $20
4,400 × $20
(10,000 × 0.40b) × $20
4,000 × $20
$66,000 $88,000 $80,000
$22,000U $8,000 F
Sales-mix variance Sales-quantity variance
$14,000 U
Sales-volume variance
Panel B:
Upper-tier
(11,000 × 0.70c) × $5
7,700 × $5
(11,000 × 0.60d) × $5
6,600 × $5
(10,000 × 0.60d) × $5
6,000 × $5
$38,500 $33,000 $30,000
$5,500 F $3,000 F
Sales-mix variance Sales-quantity variance
$8,500 F
Sales-volume variance
Panel C:
All Tickets
(Sum of Lower-
tier and Upper–
tier tickets)
$104,500e $121,000f $110,000g
$16,500 U $11,000 F
Total sales-mix variance Total sales-quantity variance
$5,500 U
Total sales-volume variance
F = favorable effect on operating income; U = unfavorable effect on operating income.
Actual Sales Mix:
aLower-tier = 3,300 ÷ 11,000 = 30%
cUpper-tier = 7,700 ÷ 11,000 = 70%
e$66,000 + $38,500 = $104,500
Budgeted Sales Mix:
bLower-tier = 4,000 ÷ 10,000 = 40%
dUpper-tier = 6,000 ÷ 10,000 = 60%
f $88,000 + $33,000 = $121,000
g $80,000 + $30,000 = $110,000
14-18
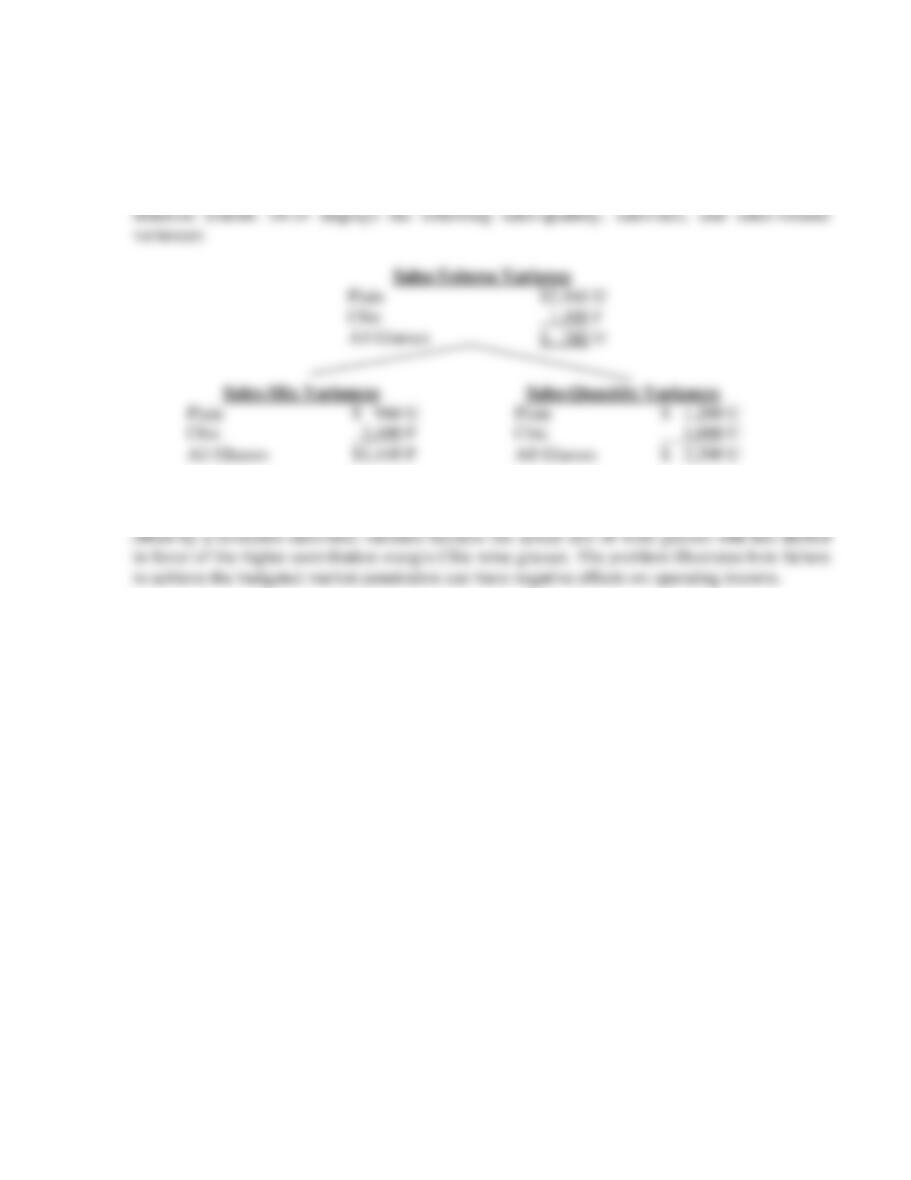
1. and 2. Solution Exhibit 14-24 presents the sales-volume, sales-quantity, and sales-mix
variances for the Plain and Chic wine glasses and in total for Jinwa Corporation in June 2011.
The steps to fill in the numbers in Solution Exhibit 14-24 follow:
Step 1
Consider the static budget column (Column 3):
Static budget total contribution margin $11,000
14-19
Step 3
Next, consider Column 1 of Solution Exhibit 14–24. We know actual units sold of all glasses
(1,600 units), the actual sales-mix percentage (given in the problem information as Plain, 60%;
Chic, 40%), and the budgeted unit contribution margin of each product (Plain, $4; Chic, $10).
We can therefore determine all the numbers in Column 1.
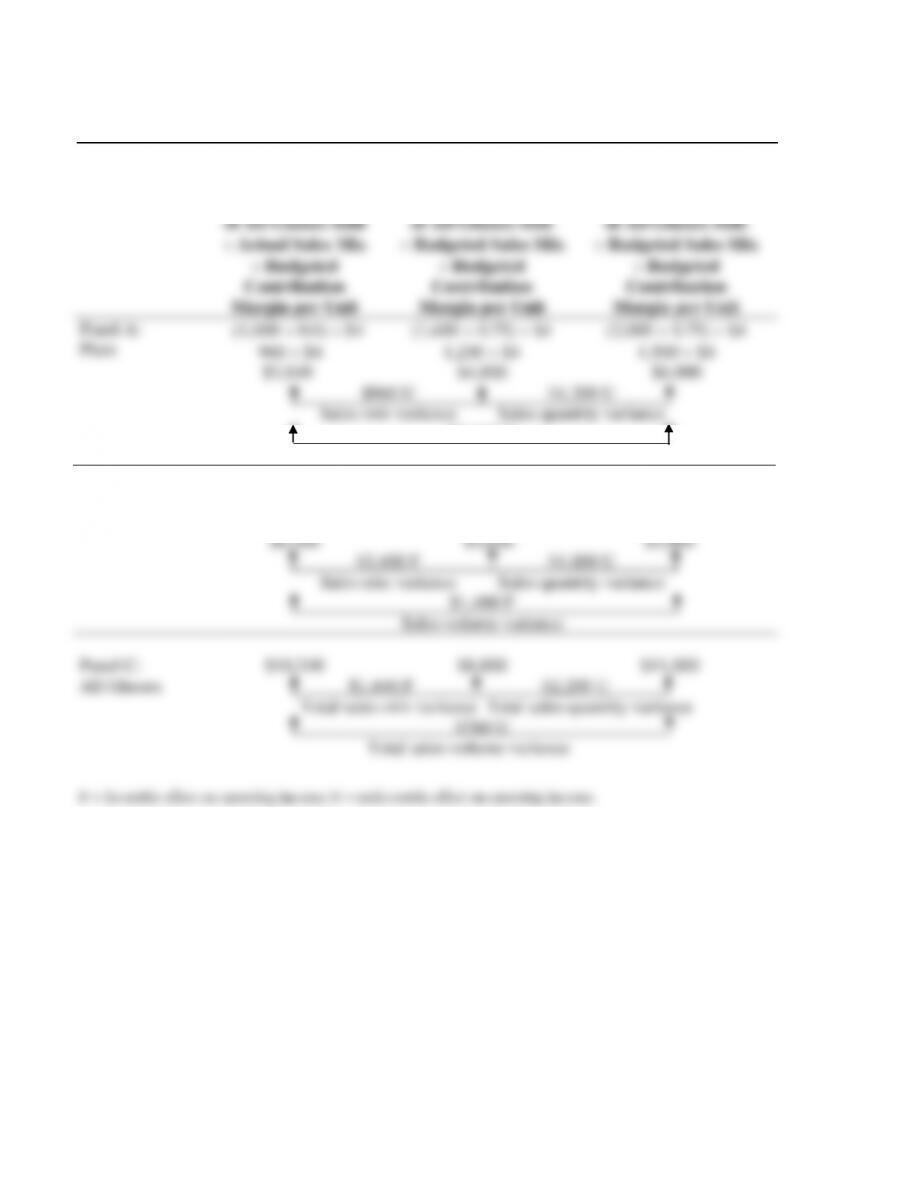
3. Jinwa Corporation shows an unfavorable sales-quantity variance because it sold fewer
wine glasses in total than was budgeted. This unfavorable sales-quantity variance is partially
SOLUTION EXHIBIT 14-24
Columnar Presentation of Sales-Volume, Sales-Quantity and Sales-Mix Variances
for Jinwa Corporation
Flexible Budget:
Actual Units
of All Glasses Sold
Actual Sales Mix
Budgeted
Contribution
Margin per Unit
Actual Units
of All Glasses Sold
Budgeted Sales Mix
Budgeted
Contribution
Margin per Unit
Static Budget:
Budgeted Units
of All Glasses Sold
Budgeted Sales Mix
Budgeted
Contribution
Margin per Unit
Panel A:
Plain
(1,600 0.6) $4
960 $4
(1,600 0.75) $4
1,200 $4
(2,000 0.75) $4
1,500 $4
$3,840 $4,800 $6,000
$960 U $1,200 U
Sales-mix variance Sales-quantity variance
$2,160 U
Sales-volume variance
Panel B:
Chic
(1,600 0.4) $10
640 $10
(1,600 0.25) $10
400 $10
(2,000 0.25) $10
500 $10
$6,400 $4,000 $5,000
$2,400 F $1,000 U
Sales-mix variance Sales-quantity variance
$1,400 F
Sales-volume variance
Panel C:
All Glasses
$10,240 $8,800 $11,000
$1,440 F $2,200 U
Total sales-mix variance Total sales-quantity variance
$760 U
Total sales-volume variance
F = favorable effect on operating income; U = unfavorable effect on operating income.