18-21
SOLUTION EXHIBIT 18-31
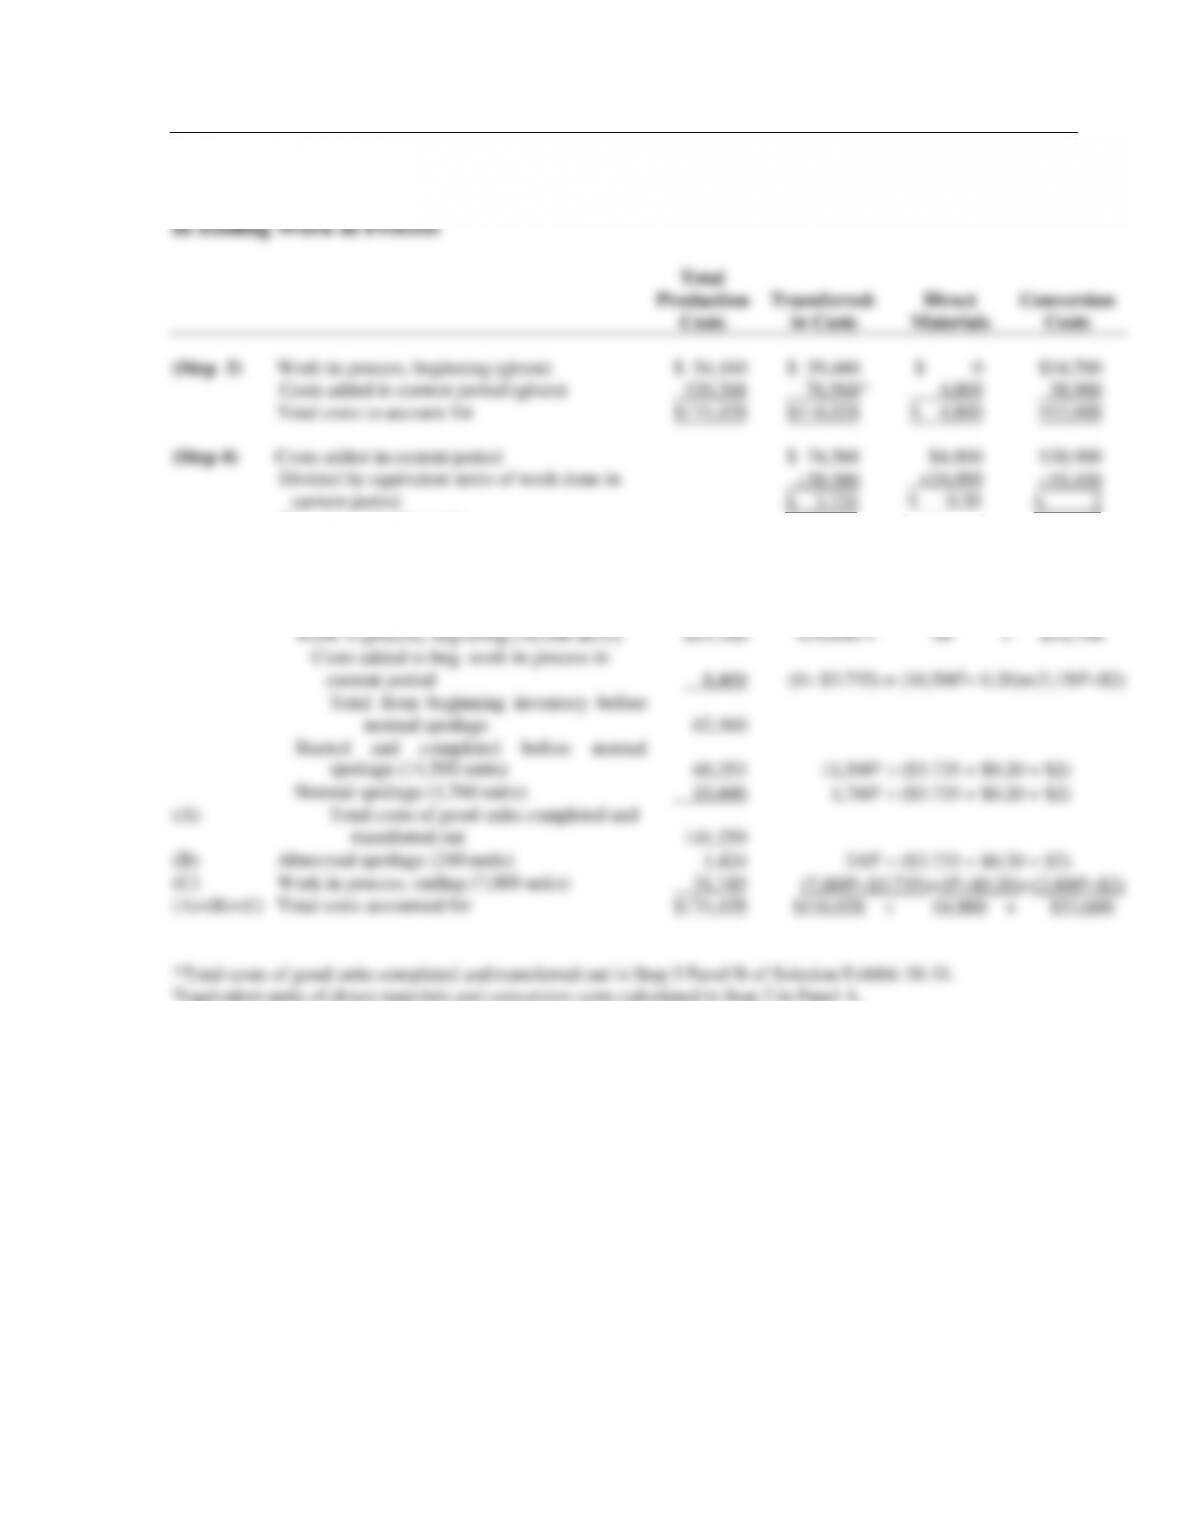
PANEL B: Steps 3, 4, and 5— Summarize Total Costs to Account For, Compute Cost per
Equivalent Unit, and Assign Total Costs to Units Completed, to Spoiled Units, and to Units
in Ending Work in Process
Total
Production
Costs
Direct
Materials
Conversion
Costs
(Step 3) Work in process, beginning (given)
Costs added in current period (given)
Total costs to account for
(Step 4) Costs added in current period
Divided by equivalent units of work done in current period
Cost per equivalent unit
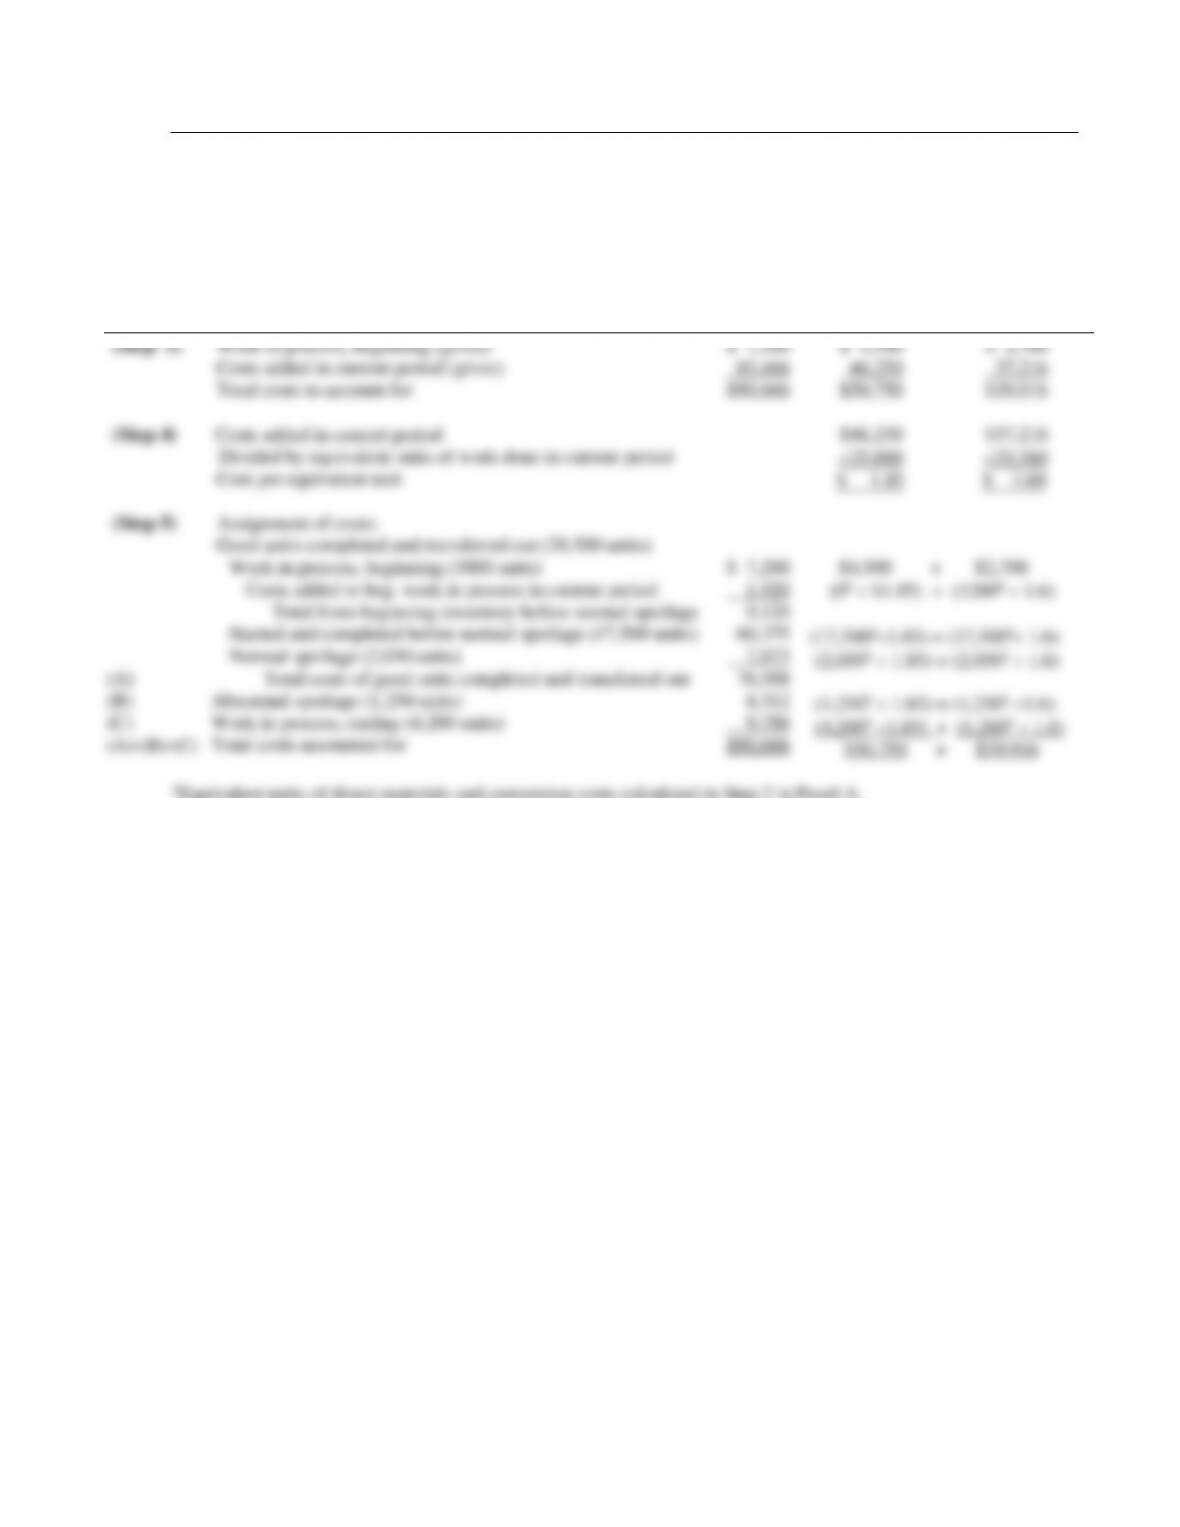
(Step 5) Assignment of costs:
Good units completed and transferred out (20,500 units)
$ 7,200
83,466
$90,666
$ 4,500
46,250
$50,750
$46,250
25,000
$ 1.85
$ 2,700
37,216
$39,916
$37,216
23,260
$ 1.60
Work in process, beginning (3000 units)
Costs added to beg. work in process in current period
Total from beginning inventory before normal spoilage
Started and completed before normal spoilage (17,500 units)
Normal spoilage (2,050 units)
(A) Total costs of good units completed and transferred out
(B) Abnormal spoilage (1,250 units)
(C) Work in process, ending (4,200 units)
(A)+(B)+(C) Total costs accounted for
$ 7,200
1,920
9,120
60,375
7,073
76,568
4,312
9,786
$90,666
$4,500 + $2,700
(0§ $1.85) + (1200§ 1.6)
(17,500§1.85) + (17,500§ 1.6)
(2,050§ 1.85) + (2,050§ 1.6)
(1,250§ 1.85) + (1,250§ 1.6)
(4,200§ 1.85) + (1,260§ 1.6)
$50,750 + $39,916
§Equivalent units of direct materials and conversion costs calculated in Step 2 in Panel A.
18-22
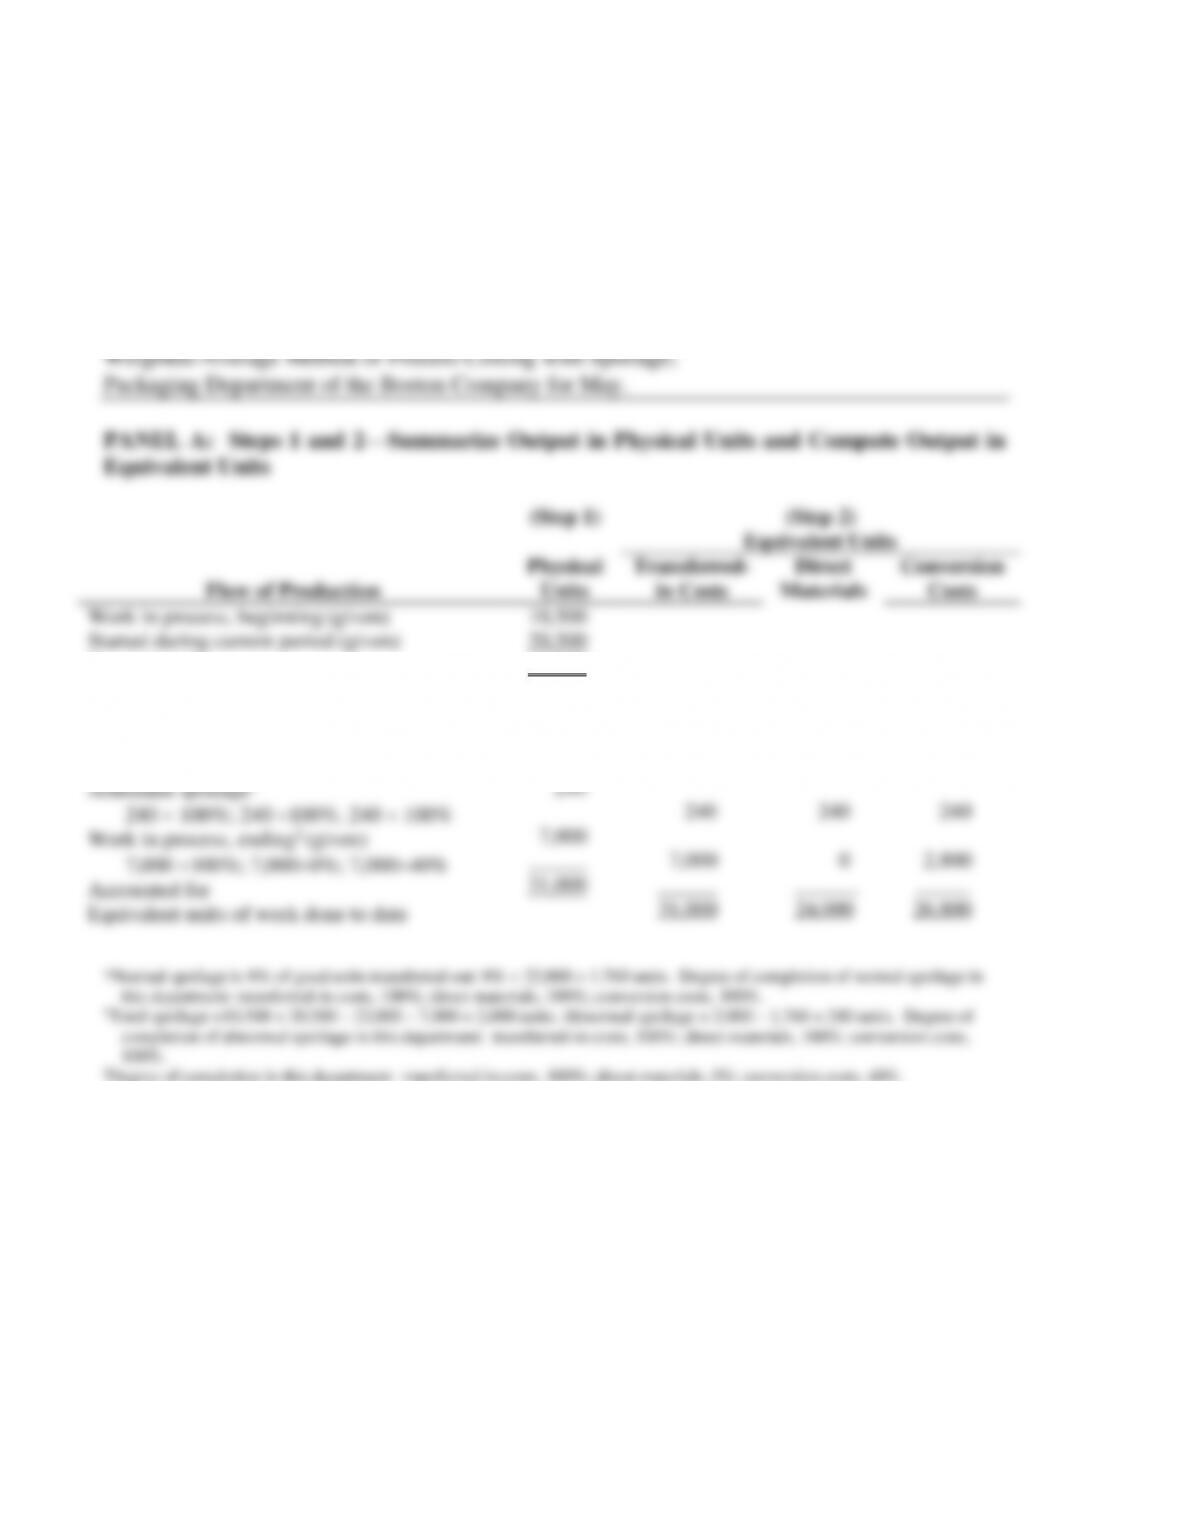
18-32 (35 min.) Weighted-average method, Packaging Department (continuation of 18–
30).
For the Packaging Department, Solution Exhibit 18-32 summarizes total costs to account for,
calculates the equivalent units of work done to date for each cost category, and assigns costs to
units completed (including normal spoilage), to abnormal spoilage, and to units in ending work
in process using the weighted-average method.
SOLUTION EXHIBIT 18-32
18-23
SOLUTION EXHIBIT 18-32
PANEL B: Steps 3, 4, and 5— Summarize Total Costs to Account For, Compute Cost per
Equivalent Unit, and Assign Total Costs to Units Completed, to Spoiled Units, and to Units
18-24
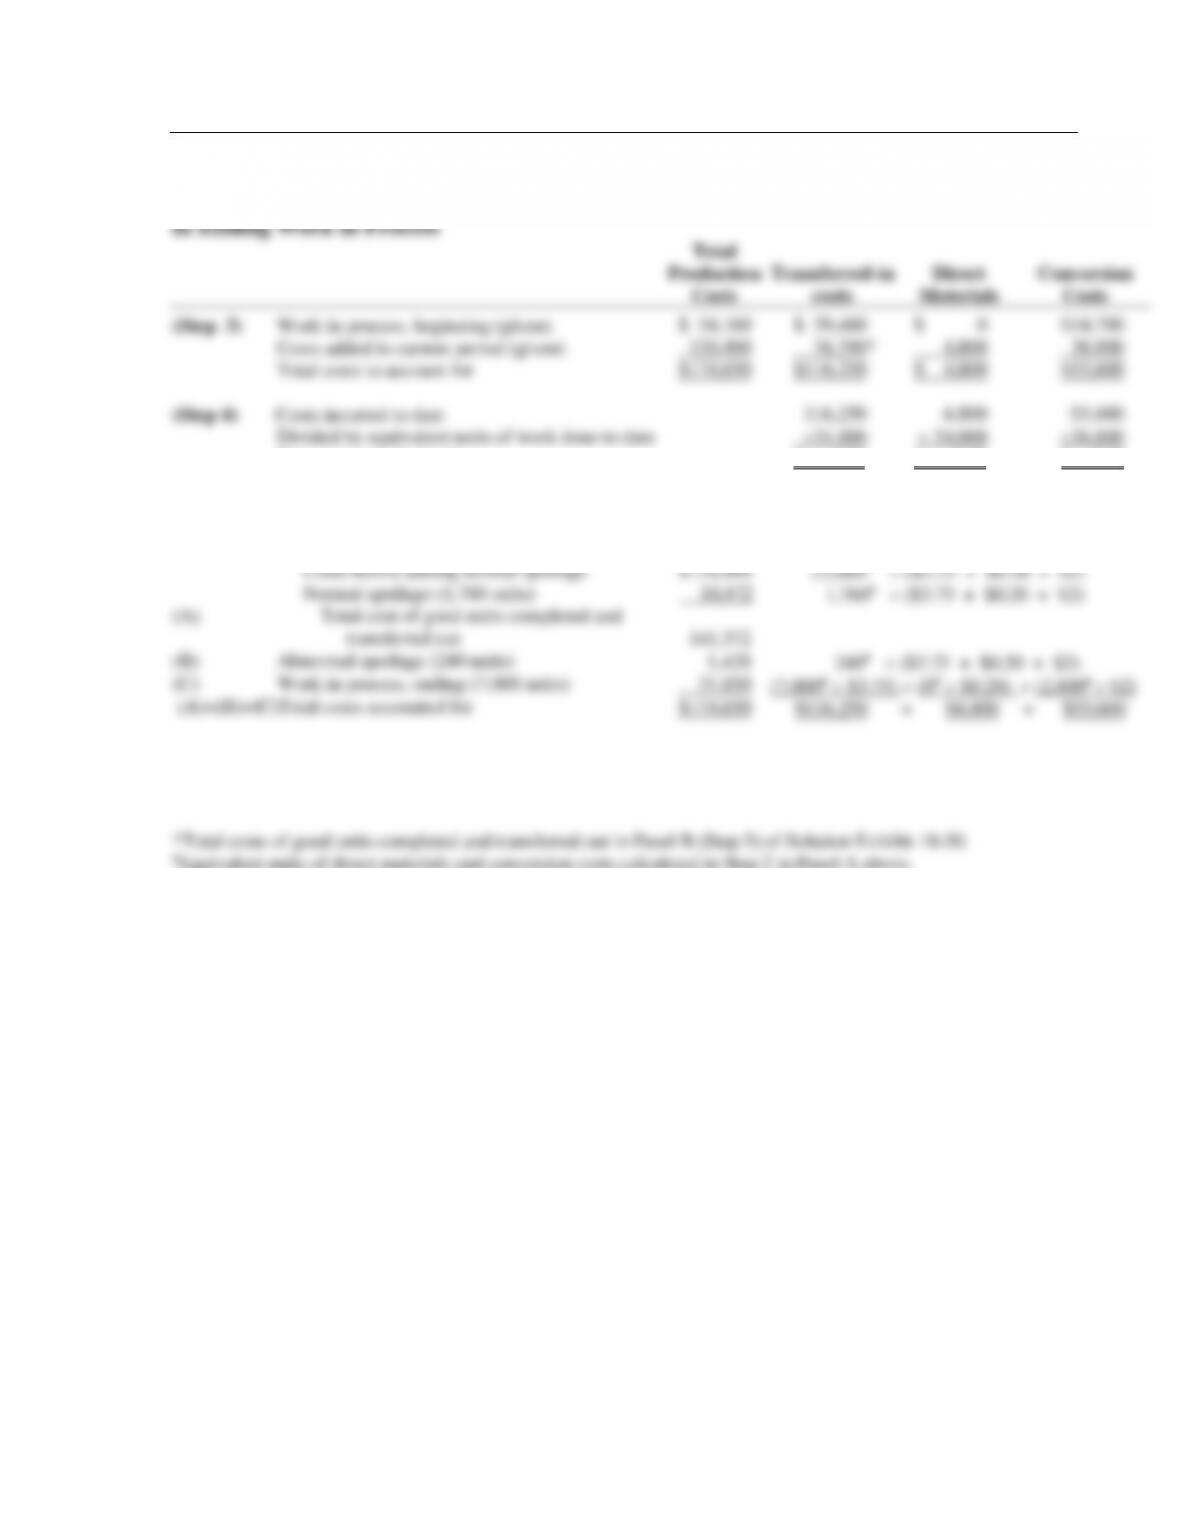
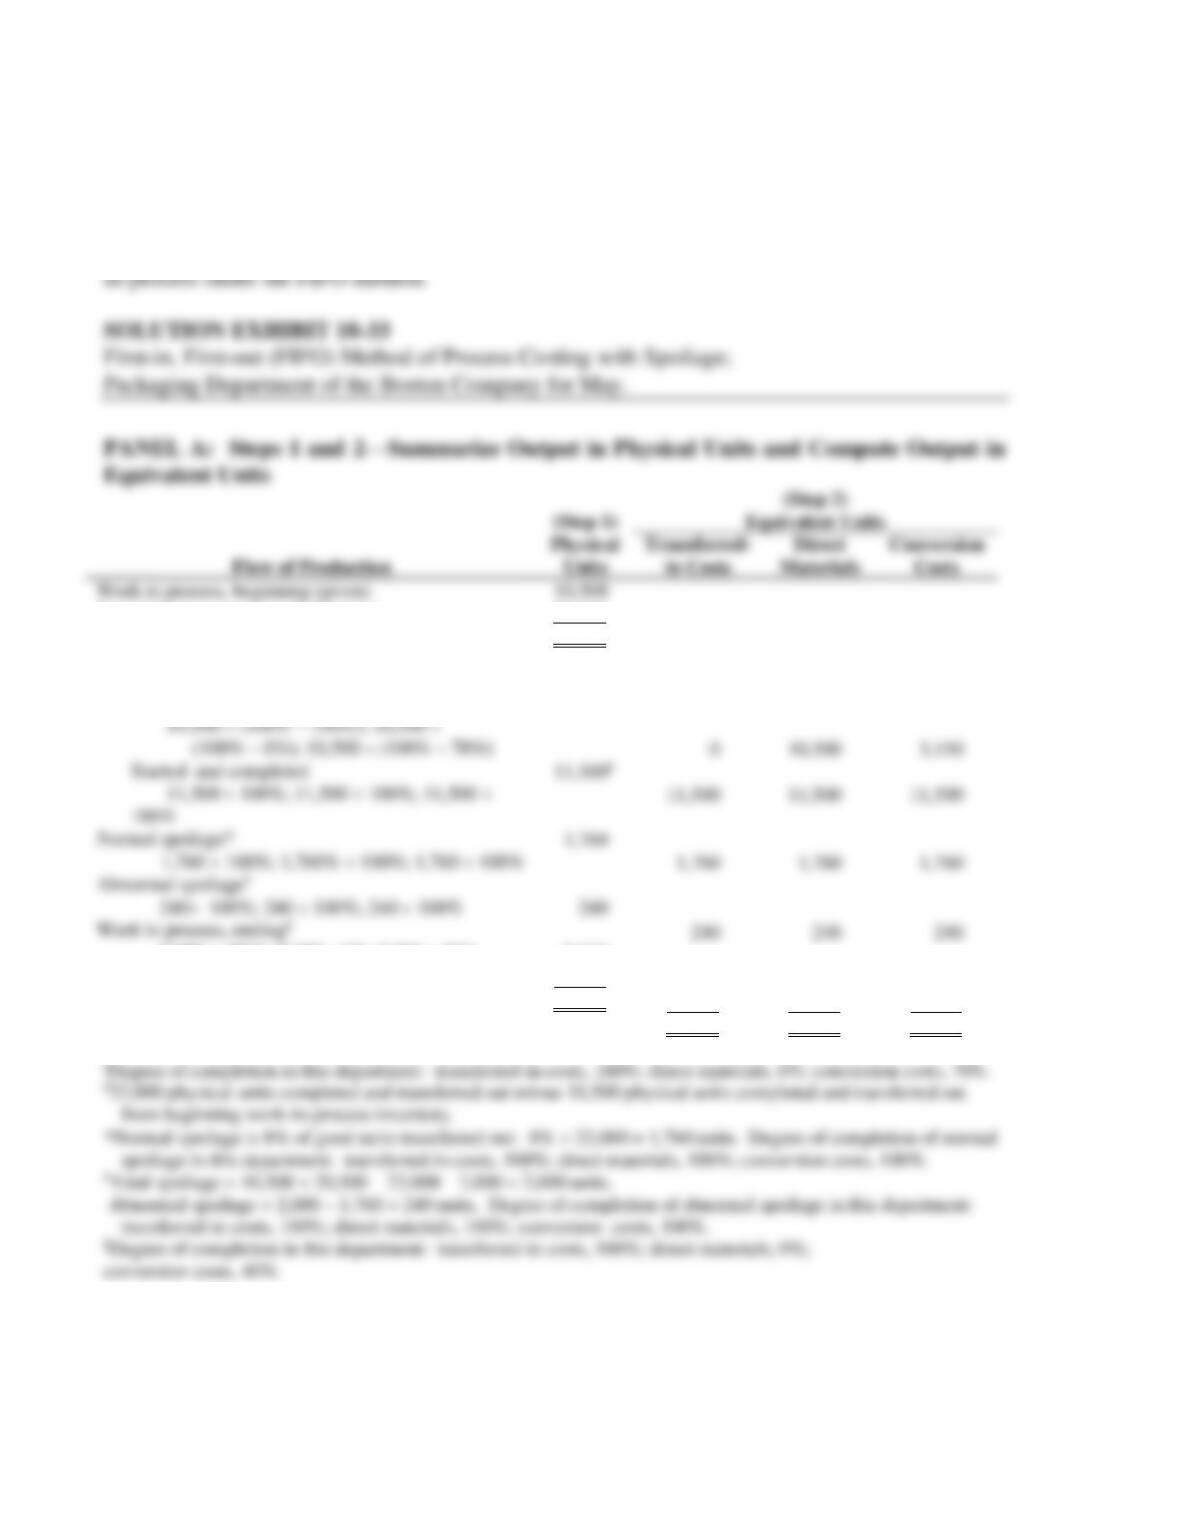
18-33 (25 min.) FIFO method, Packaging Department (continuation of 18-31).
Solution Exhibit 18-33 summarizes the total Packaging Department costs for May, shows the
equivalent units of work done in the Packaging Department in the current period for transferred–
in costs, direct materials, and conversion costs, and assigns total costs to units completed and
transferred out (including normal spoilage), to abnormal spoilage, and to units in ending work–
18-25
SOLUTION EXHIBIT 18-33
PANEL B: Steps 3, 4, and 5— Summarize Total Costs to Account For, Compute Cost per
Equivalent Unit, and Assign Total Costs to Units Completed, to Spoiled Units, and to Units
18-26
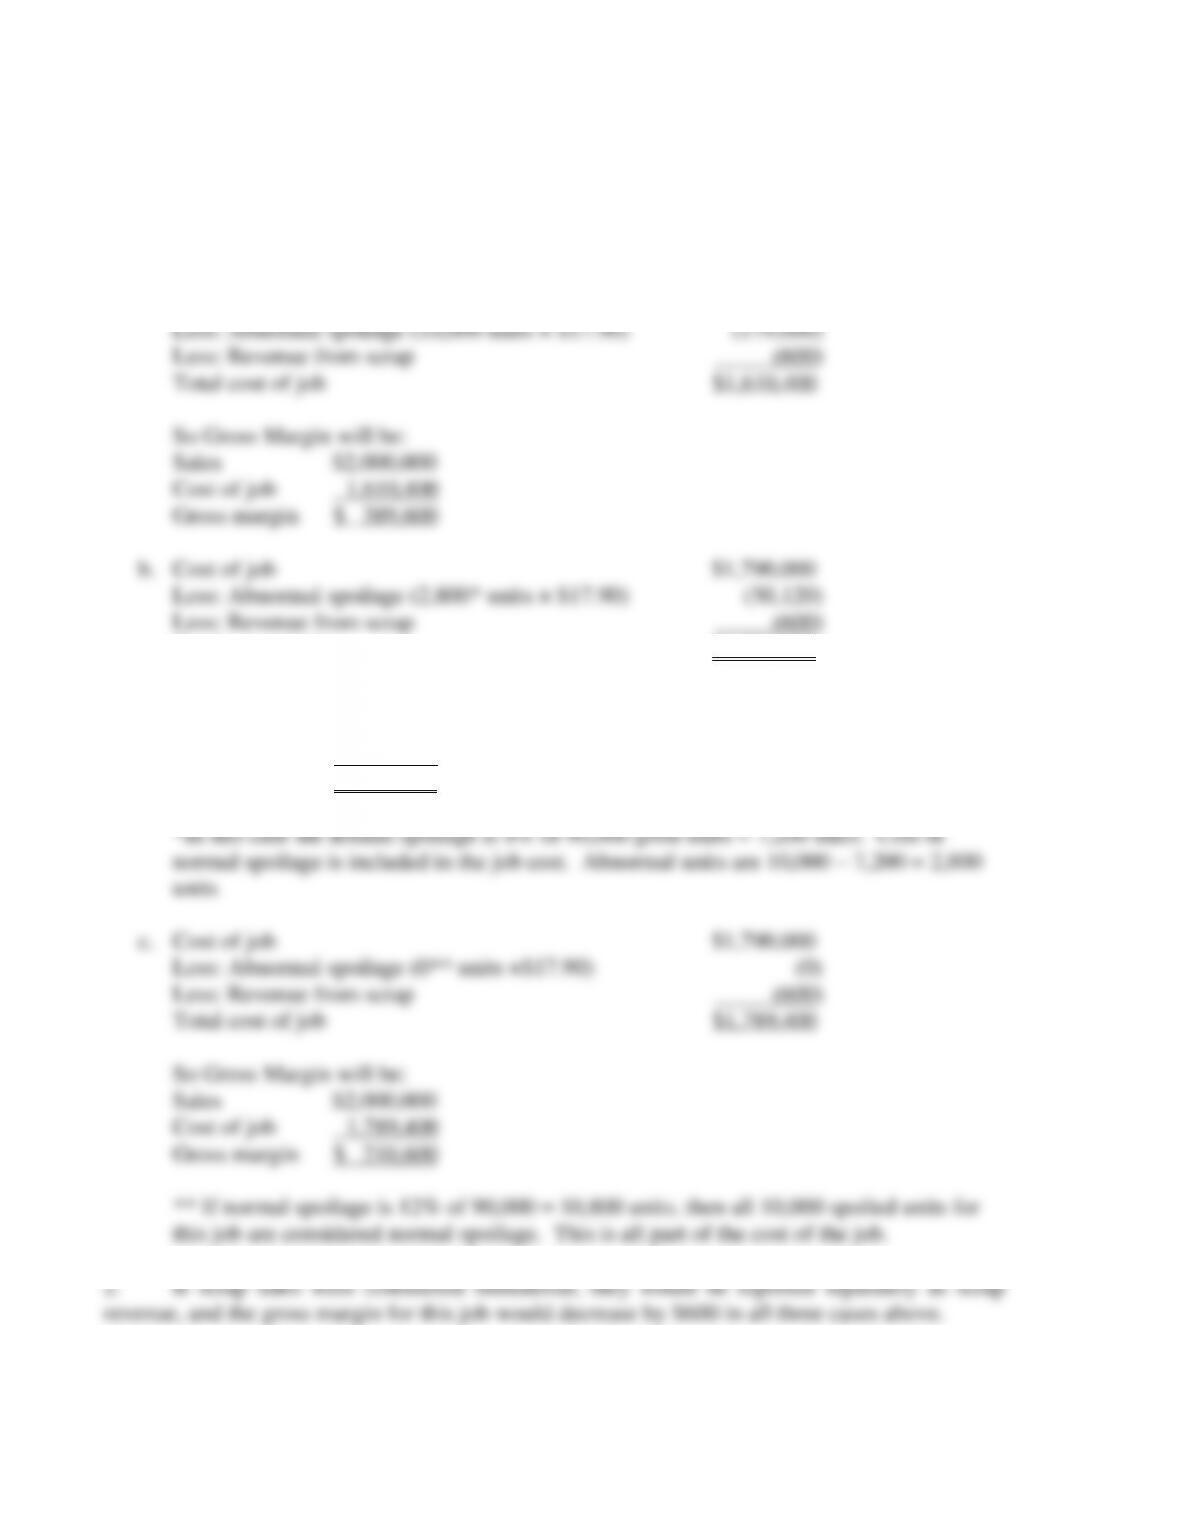
18-34 (20−25 min.) Job-costing spoilage and scrap.
If the scrap sale is material, then it will reduce the costs of the job by 200 lb × $3 = $600
Total costs of the job are $240,000 +$620,000 + $620,000 150% = $1,790,000
Unit cost of the job is $1,790,000/100,000 units = $17.90
a. Cost of job $1,790,000
Total cost of job $1,739,280
So Gross Margin will be:
Sales $2,000,000
Cost of job 1,739,280
Gross margin $ 260,720
18-27
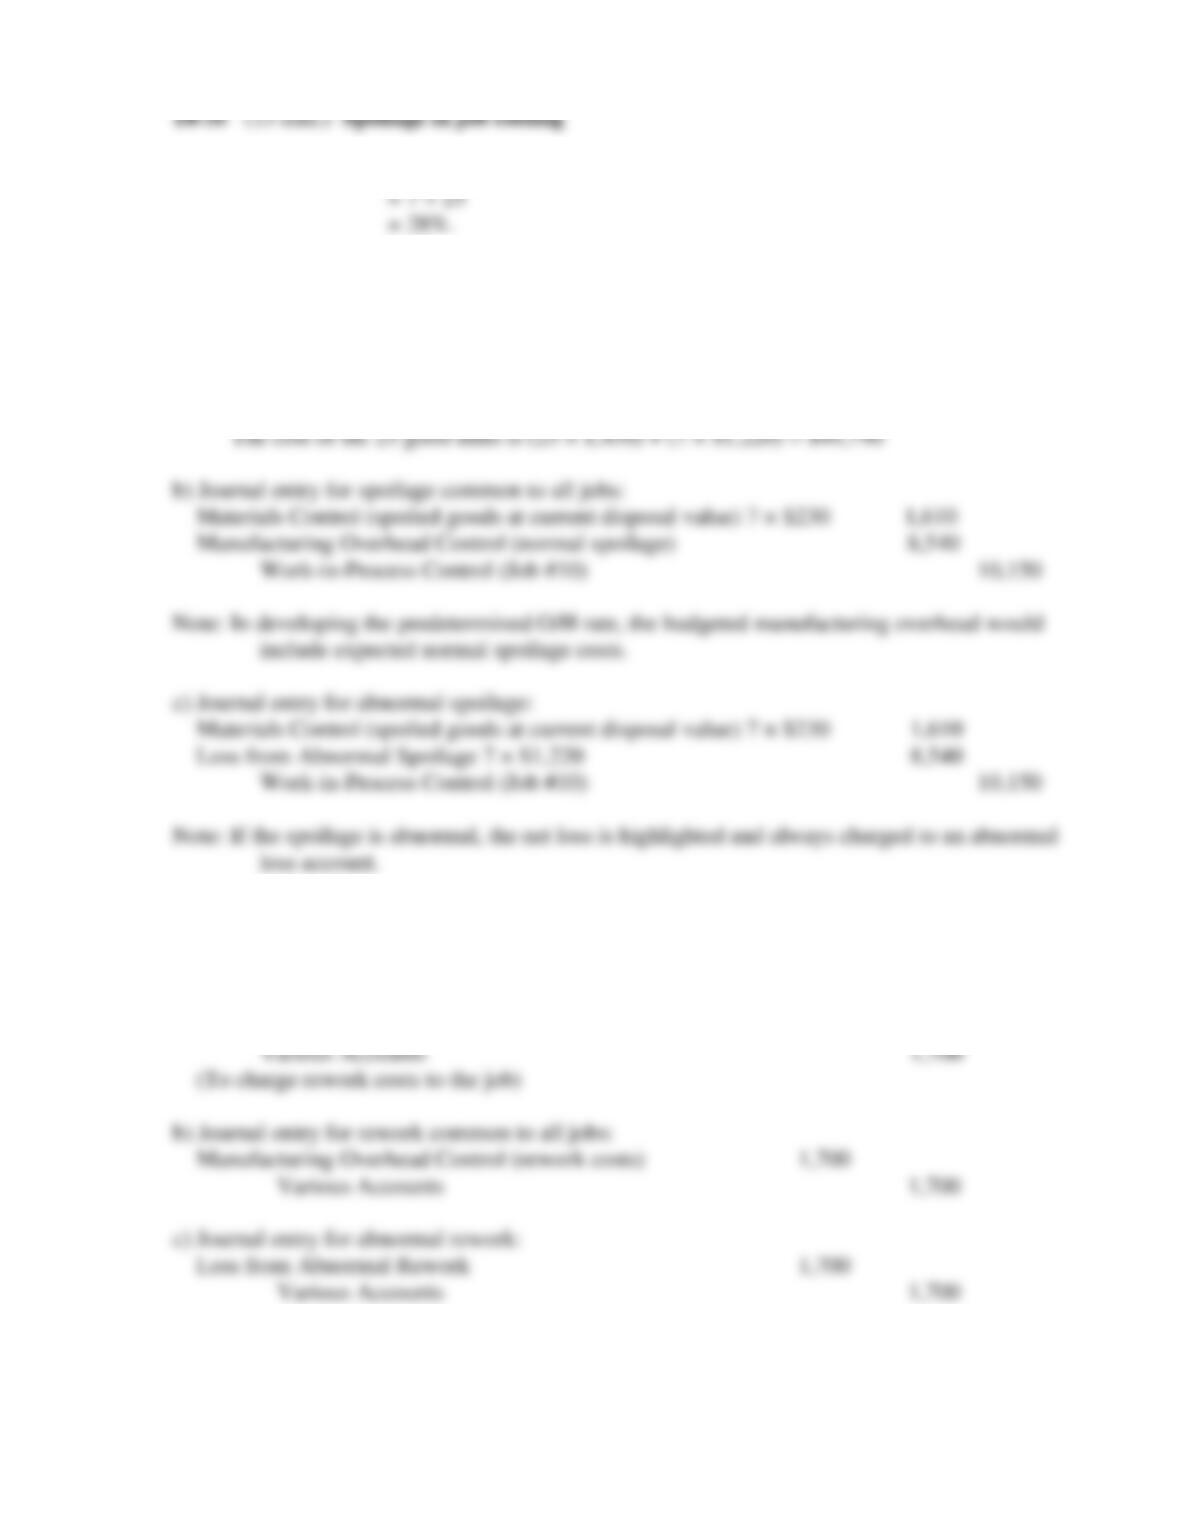
1. Normal spoilage rate= Units of normal spoilage ÷ Total good units completed
2.
a) Journal entry for spoilage related to a specific job:
Materials Control (spoiled goods at current disposal value) 7 × $230 1,610
Work-in–Process Control (Job #10) 1,610
Note: The costs incurred on the bad units (7 × $1,450) are already part of the balance in WIP.
18-36 (10 min.) Rework in job costing, journal entry (continuation of 18-35)
a) Journal entry for rework related to a specific job:
Work-in-Process Control (Job #10) 1,700
18-28
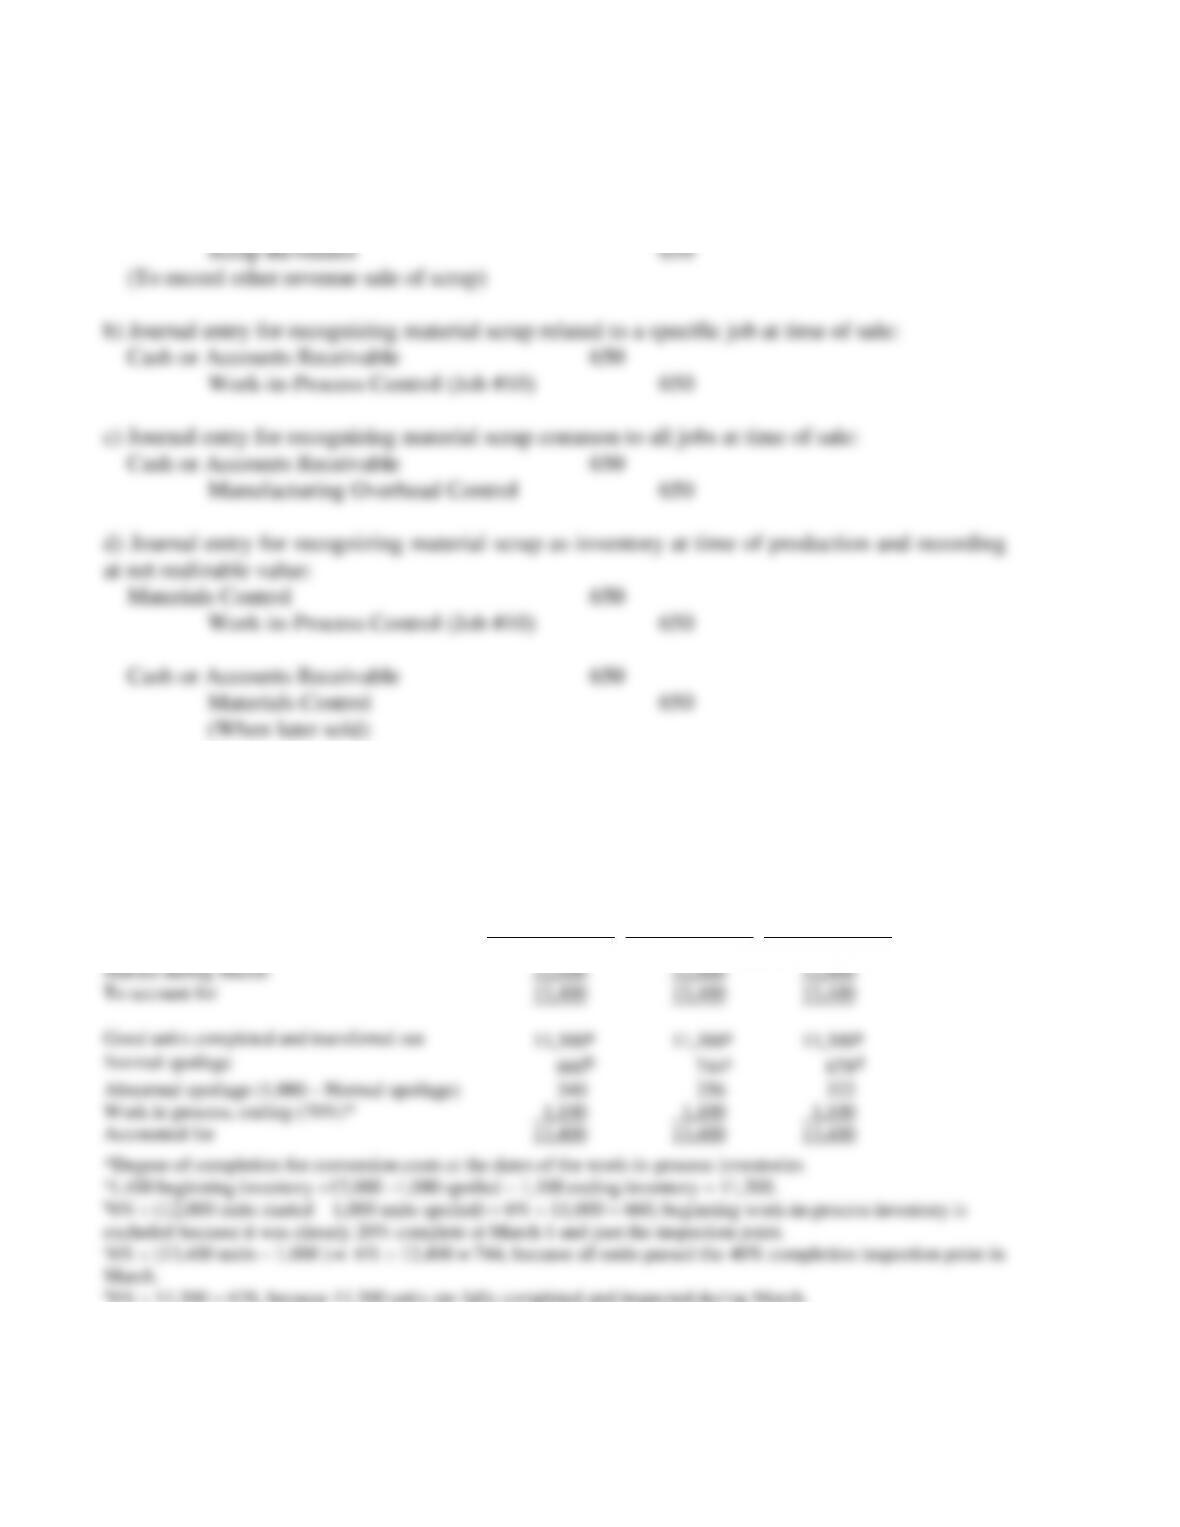
18-37 (10 min.) Scrap at time of sale or at time of production, journal entries
(continuation of 18-35)
a) Journal entry for recognizing immaterial scrap at time of sale:
Cash or Accounts Receivable 650
18-38 (20−25 min.) Physical units, inspection at various stages of completion (chapter
appendix).
Inspection
Inspection
Inspection
at 15%
at 40%
at 100%
Work in process, beginning (20%)*
Started during March
To account for
1,400
12,000
13,400
1,400
12,000
13,400
1,400
12,000
13,400
Good units completed and transferred out
Normal spoilage
11,300a
660b
11,300a
744c
11,300a
678d
Abnormal spoilage (1,000 – Normal spoilage)
Work in process, ending (70%)*
Accounted for
340
1,100
13,400
256
1,100
13,400
322
1,100
13,400
*Degree of completion for conversion costs at the dates of the work-in-process inventories
a1,400 beginning inventory +12,000 –1,000 spoiled – 1,100 ending inventory = 11,300.
b6% (12,000 units started – 1,000 units spoiled) = 6% 11,000 = 660; beginning work-in-process inventory is
excluded because it was already 20% complete at March 1 and past the inspection point.
c6% (13,400 units – 1,000 ) = 6% 12,400 = 744, because all units passed the 40% completion inspection point in
March.
d6% 11,300 = 678, because 11,300 units are fully completed and inspected during March.