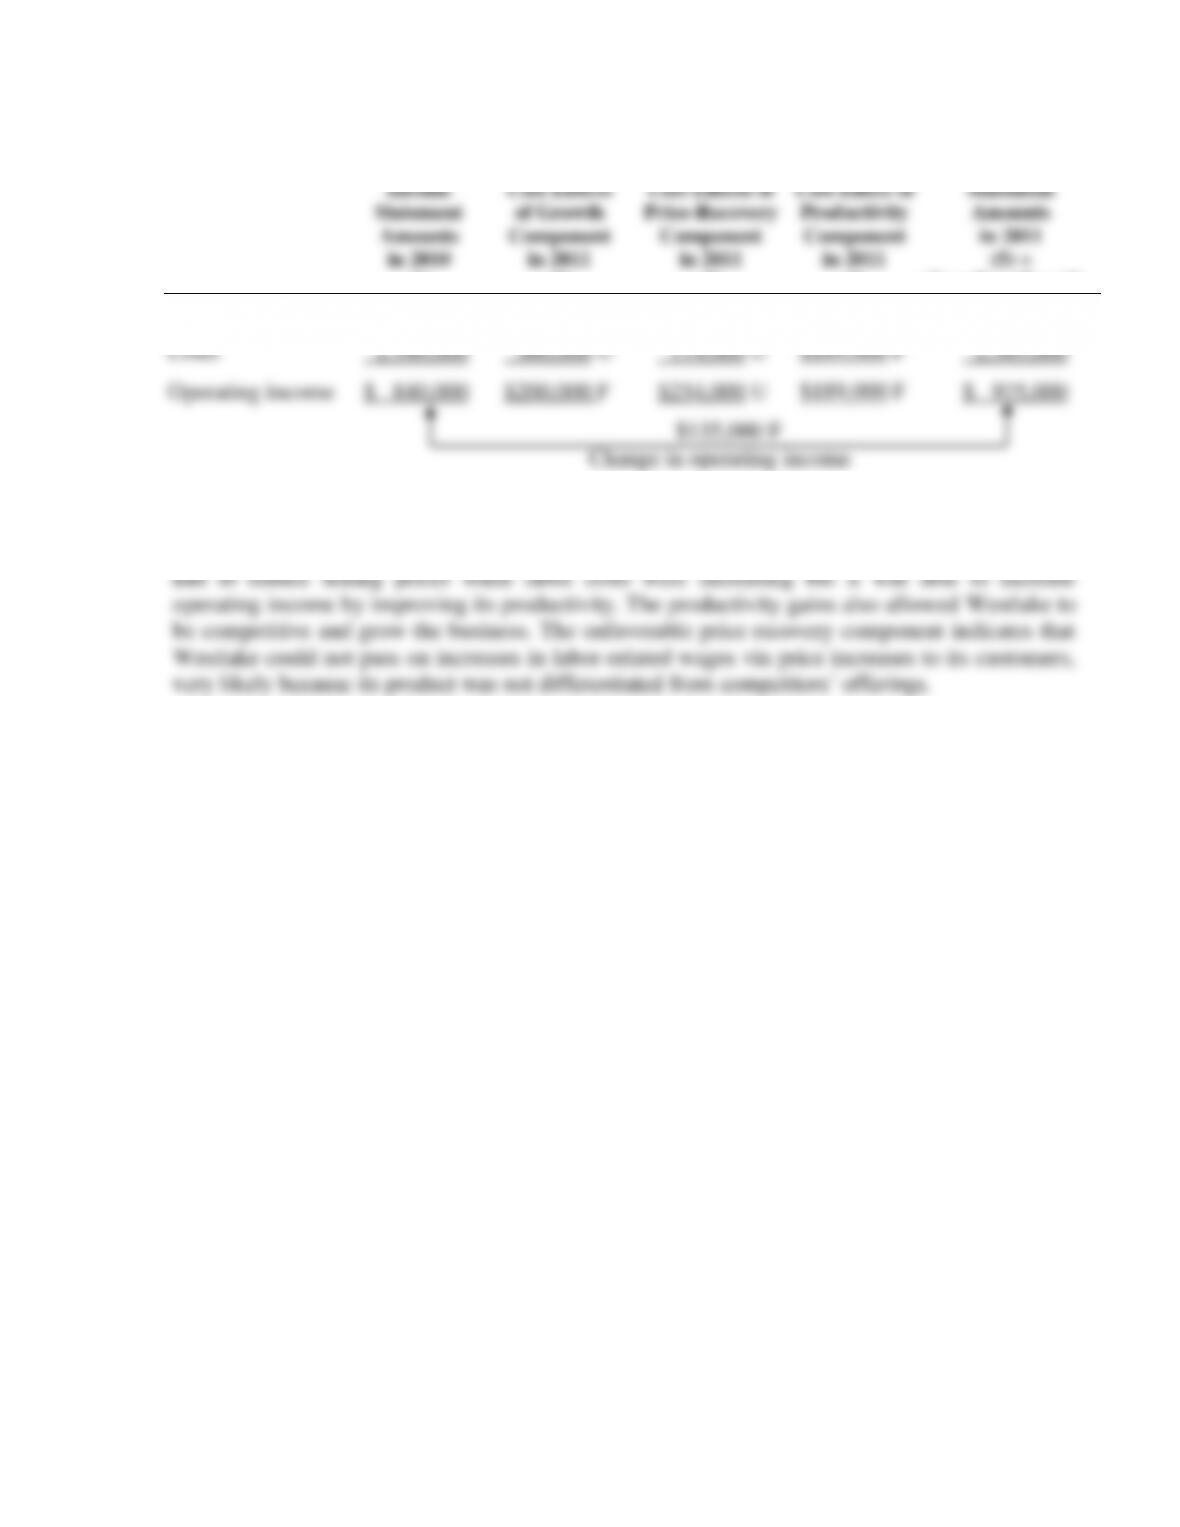
The change in operating income between 2010 and 2011 can be analyzed as follows:
Income
Statement
Amounts
in 2010
(1)
Revenue and
Cost Effects
of Growth
Component
in 2011
(2)
Revenue and
Cost Effects of
Price-Recovery
Component
in 2011
(3)
Cost Effect of
Productivity
Component
in 2011
(4)
Income
Statement
Amounts
in 2011
(5) =
(1) + (2) + (3) + (4)
Revenues
$3,000,000
$500,000 F
$140,000 U
−−
$3,360,000
Costs
2,160,000
300,000 U
114,000 U
$189,000 F
2,385,000
Operating income
$ 840,000
$200,000 F
$254,000 U
$189,000 F
$ 975,000
$135,000 F
Change in operating income
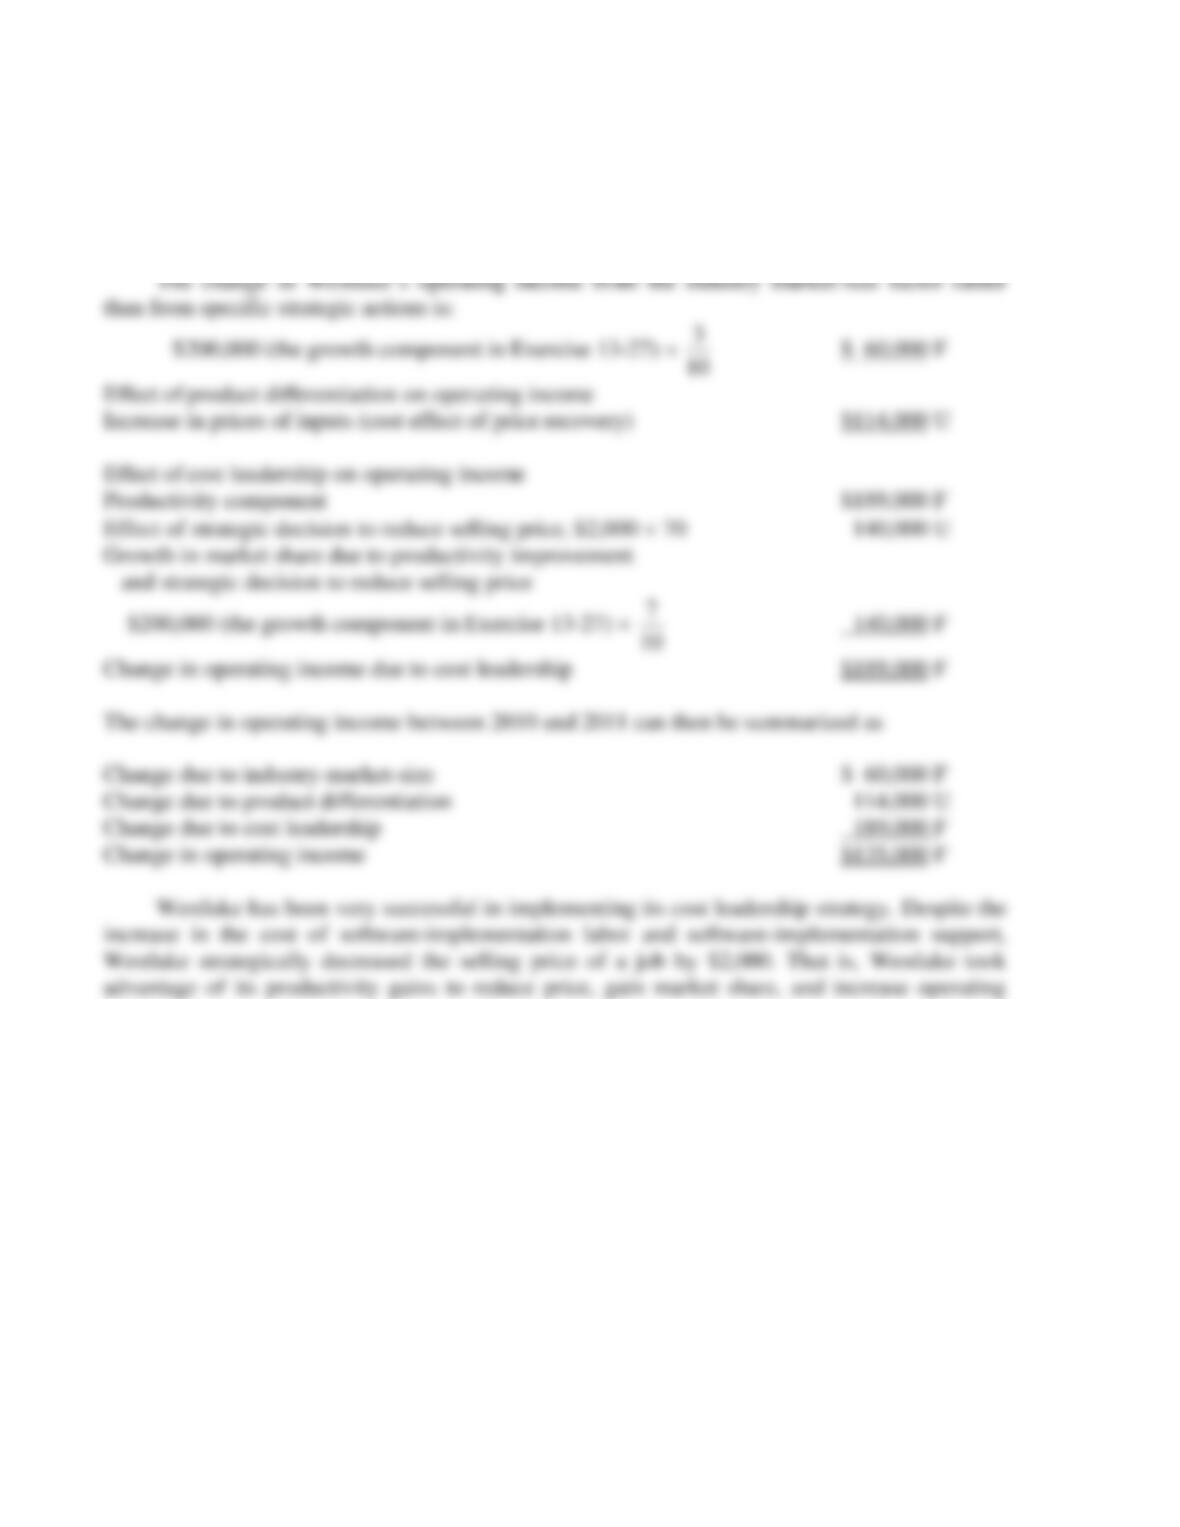
3. The analysis of operating income indicates that a significant amount of the increase in
operating income resulted from Westlake’s productivity improvements in 2011. The company
13-22
13-28 (25 min.) Analysis of growth, price-recovery, and productivity components
(continuation of 13-27).
Effect of industry-market-size factor on operating income
Of the 10-unit increase in sales from 60 to 70 units, 5% or 3 units (5% 60) are due to growth in
market size, and 7 (10 − 3) units are due to an increase in market share.
income.
13-23
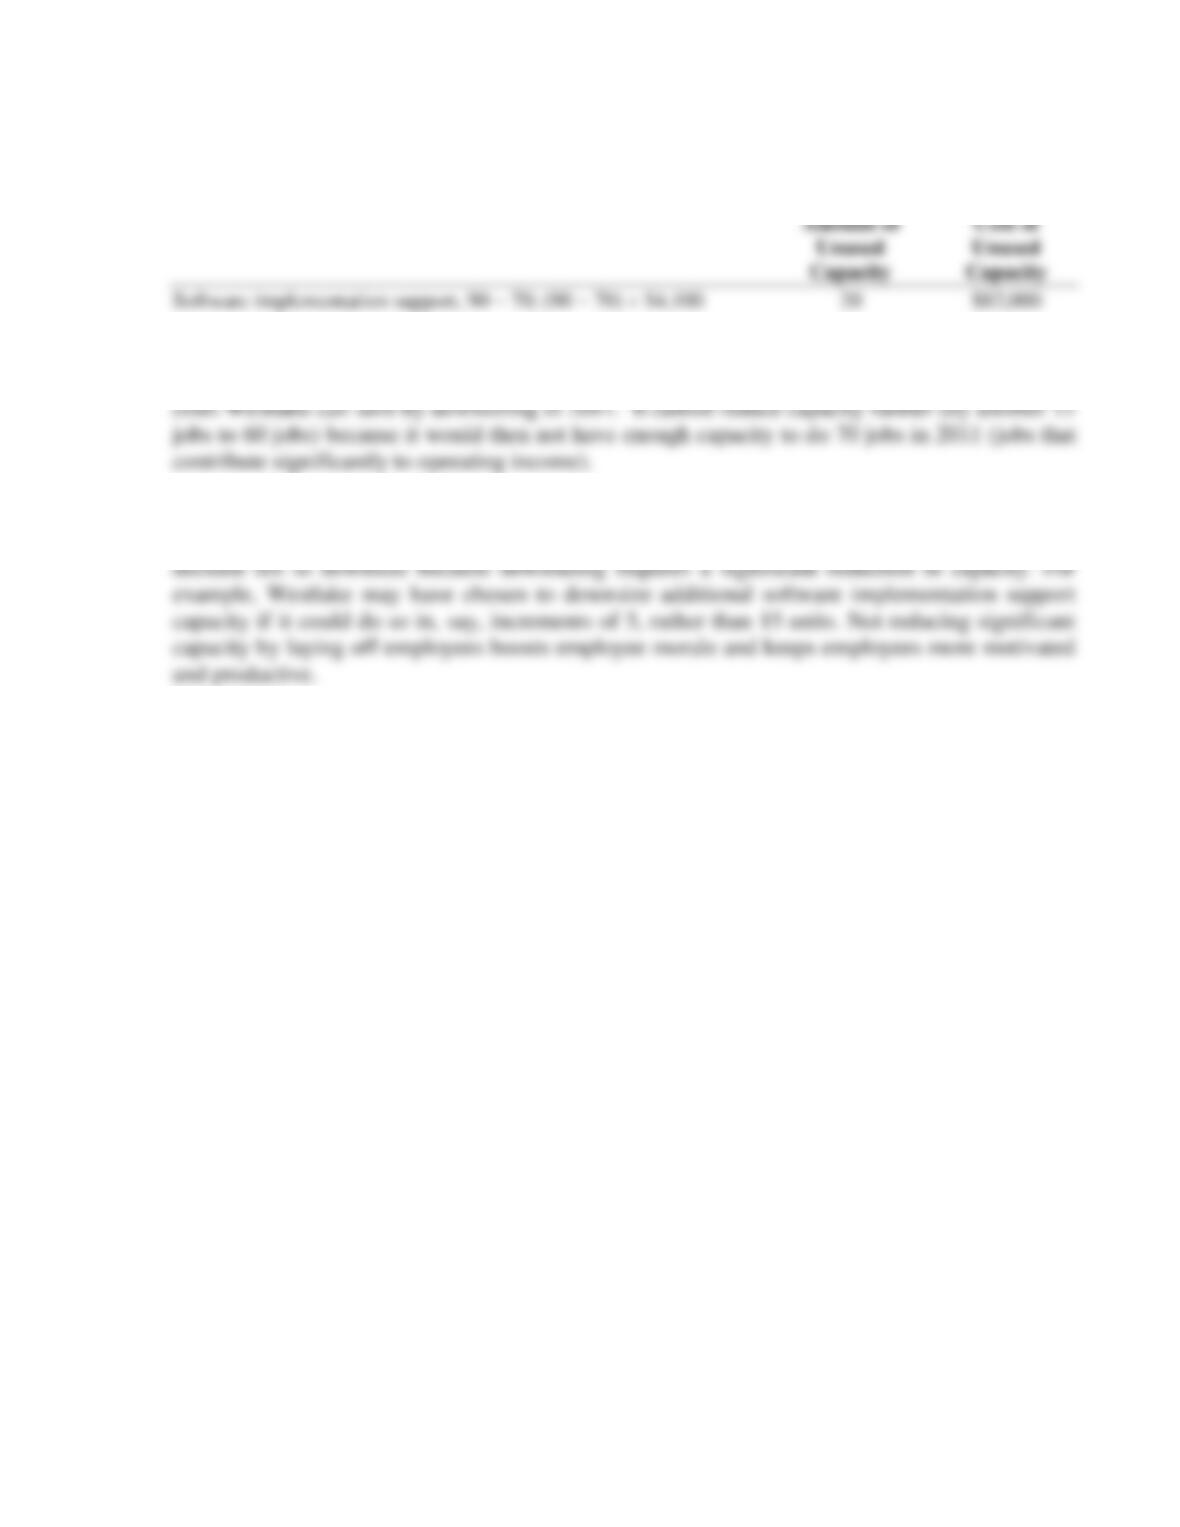
13-29 (20 min.) Identifying and managing unused capacity (continuation of 13-26).
1. The amount and cost of unused capacity at the beginning of year 2011 based on work
done in year 2011 follows:
2. Westlake can reduce software implementation support capacity from 90 jobs to
75 (90 − 15) jobs. Westlake will save 15 $4,100 = $61,500. This is the maximum amount of
3. Westlake may have chosen not to downsize because it projects sales increases in the near
term that would lead to greater demand for and utilization of capacity. Westlake may have also
13-24
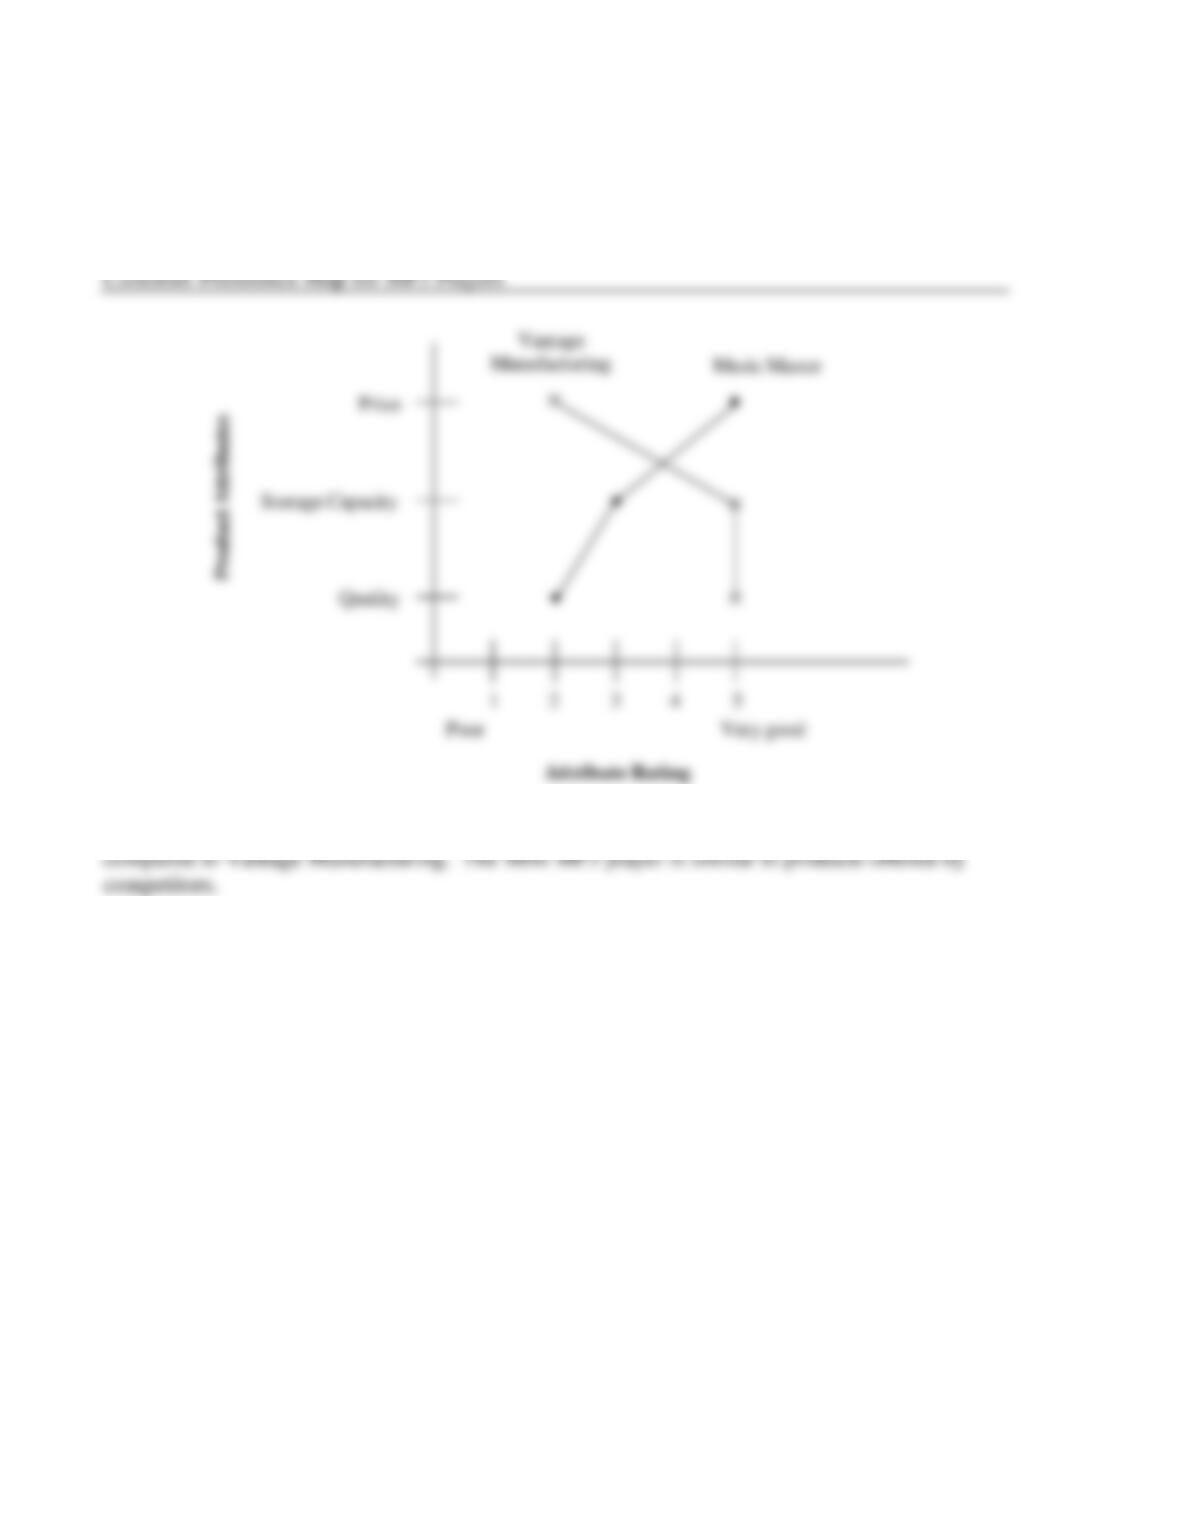
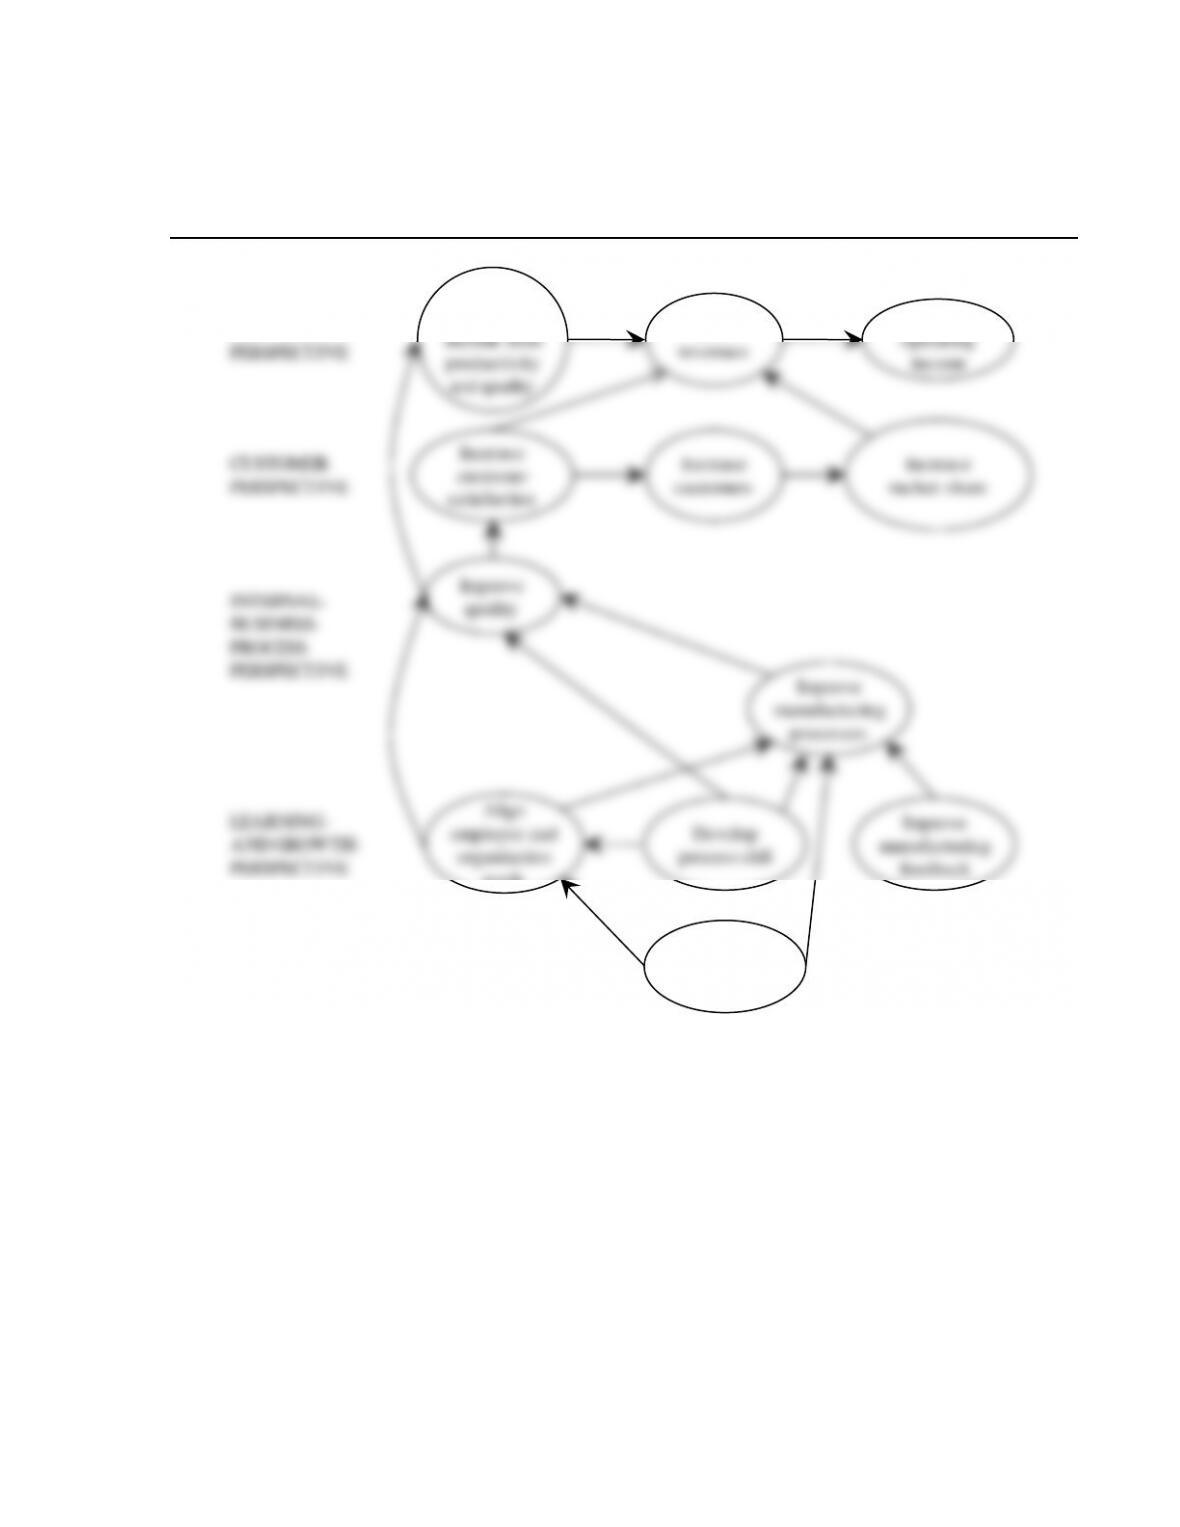
13-30 (30 min.) Balanced scorecard and strategy.
1. Solution Exhibit 13-30A shows the customer preference map for MP3 players for Music
Master Company and Vantage Manufacturing on price, storage capacity, and quality.
SOLUTION EXHIBIT 13-30A
13-25
3. Solution Exhibit 13-30B presents Music Master’s strategy map explaining cause-and-effect
relationships in its balanced scorecard.
SOLUTION EXHIBIT 13-30B
Strategy Map for Music Master Company
FINANCIAL
PERSPECTIVE
CUSTOMER
PERSPECTIVE
INTERNAL–
BUSINESS-
PROCESS
PERSPECTIVE
LEARNING-
AND GROWTH-
Increase
operating
income from
productivity
and quality
Grow
revenues
Improve
manufacturing
processes
Develop
Increase
market share
Grow
operating
income
Increase
customer
satisfaction
Increase
customers
Improve
quality
Align
employee and
Improve
4. In the internal-business-process perspective, Music Master needs to set targets for decreasing
the percentage of defective products sold and then identify measures that would be leading
indicators of achieving this goal. For example, in the learning and growth perspective, Music
Master may want to measure the percentage of employees trained in quality management and the
percentage of manufacturing processes with real-time feedback. The logic is that improvements
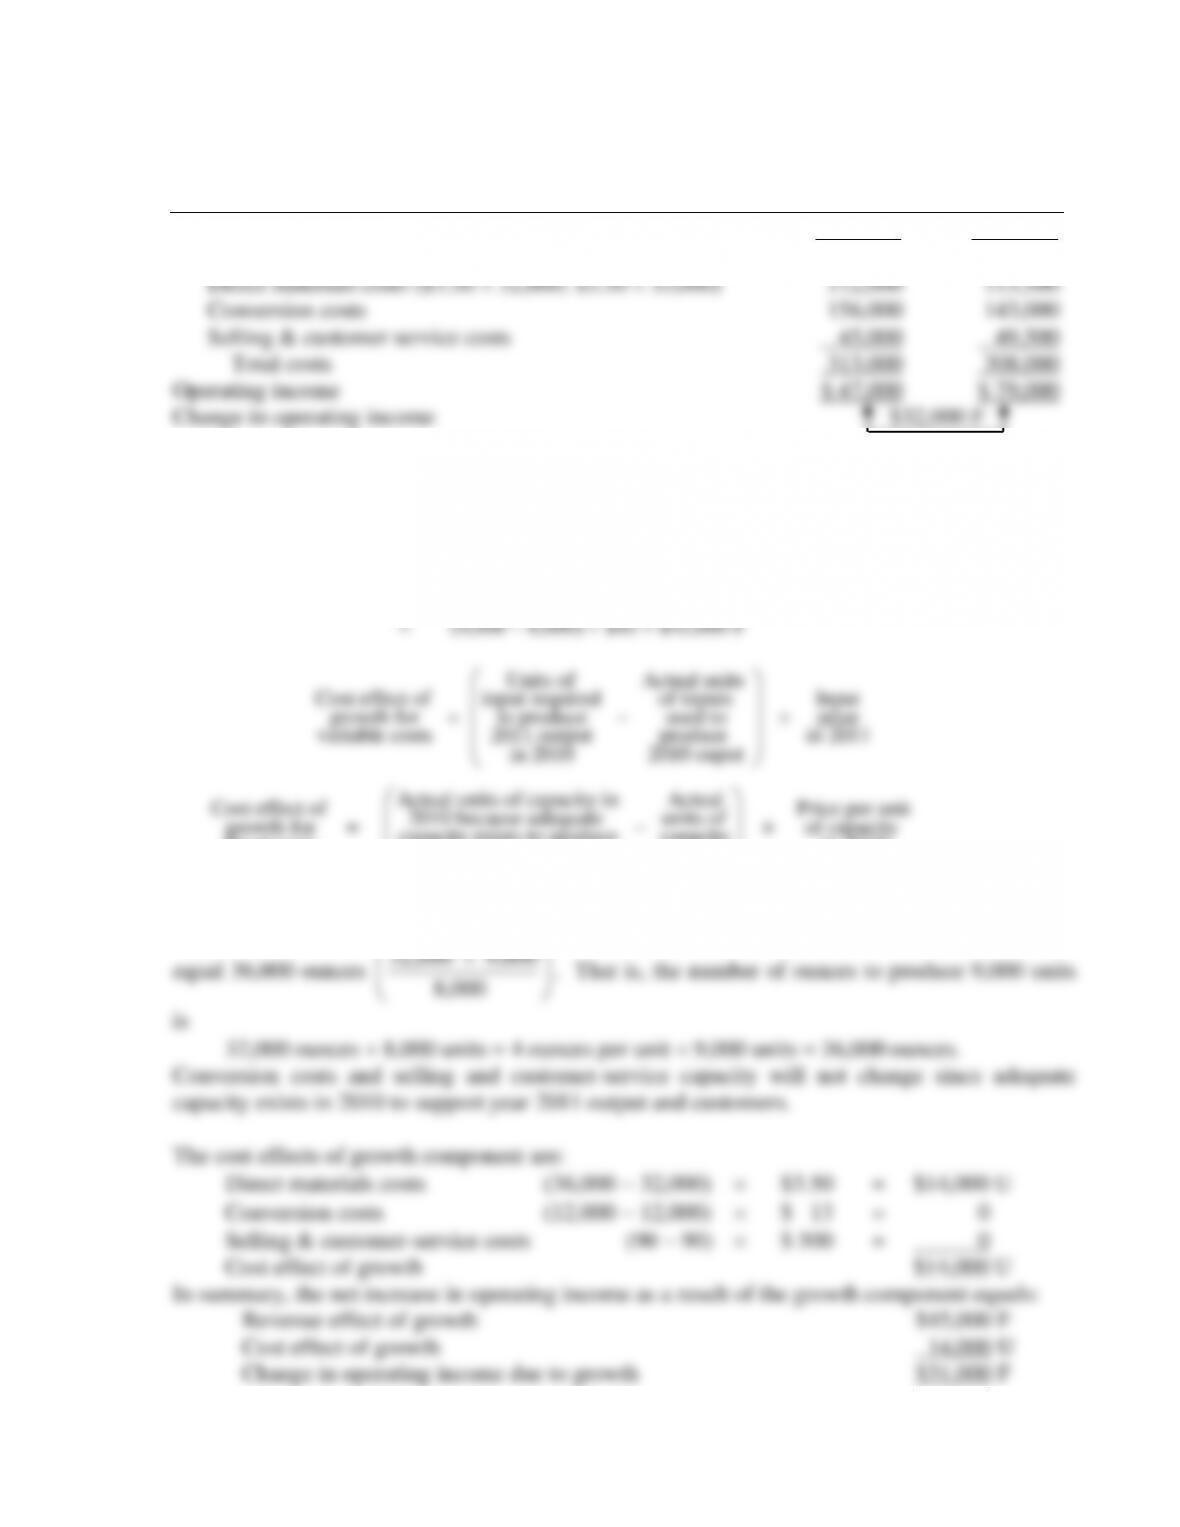
13-31 (25-30 min.) Strategic analysis of operating income (continuation of 13-30)
1. Operating income for each year is as follows:
2010 2011
Revenue ($45 8,000; $43 9,000) $360,000 $387,000
Costs
2. The Growth Component
Revenue effect
of growth
=
Actual units of Actual units of Selling
output sold output sold price
in 2011 in 2010 in 2010
−
13-28
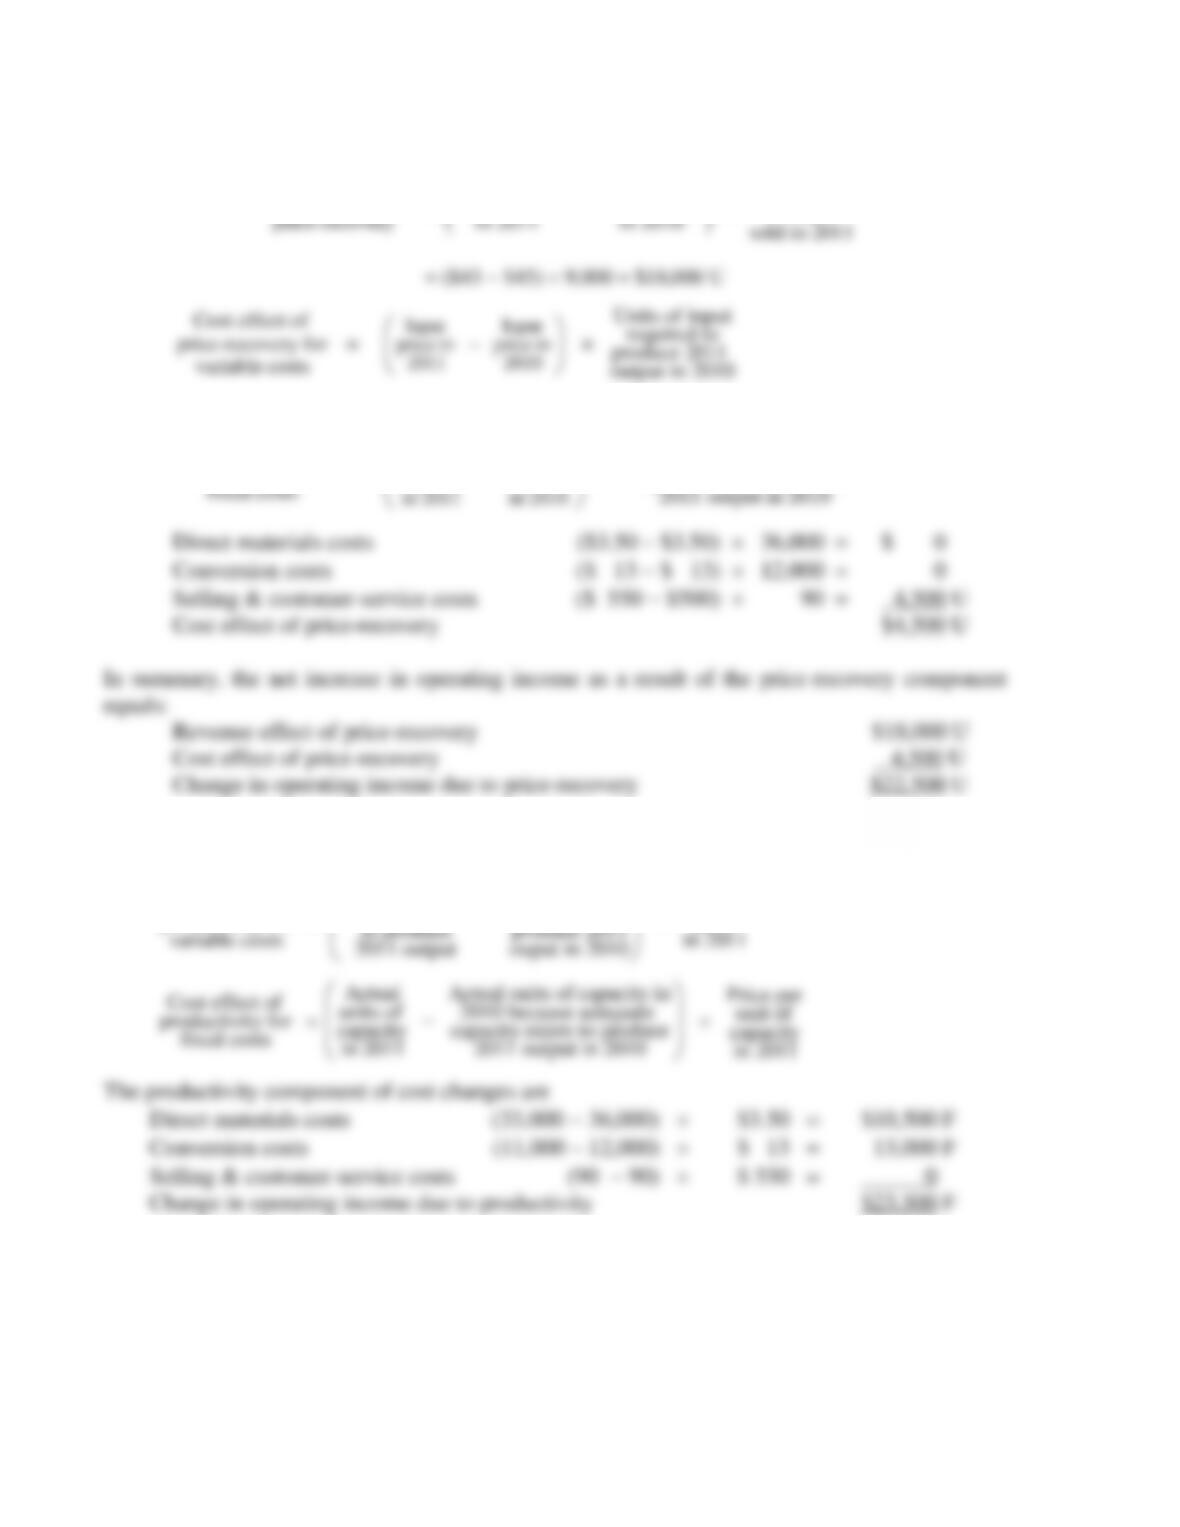
The Price-Recovery Component
Revenue effect of
price-recovery
()
Actual units
Selling price Selling price
= of output
in 2011 in 2010 sold in 2011
−
variable costs
2011 2010
produce 2011
output in 2010
Cost effect of
price-recovery for
fixed costs
=
Price per Price per
unit of unit of
capacity capacity
in 2011 in 2010
−
×
Actual units of capacity in
2010 because adequate
capacity exists to produce
2011 output in 2010
The Productivity Component
Cost effect of
productivity for
variable costs
=
Actual units of Units of input
input used required to
to produce produce 2011
2011 output ouput in 2010
−
Input
price
in 2011
Cost effect of
Actual Actual units of capacity in
units of 2010 because adequate
Price per
unit of
Cost effect of
price-recovery for
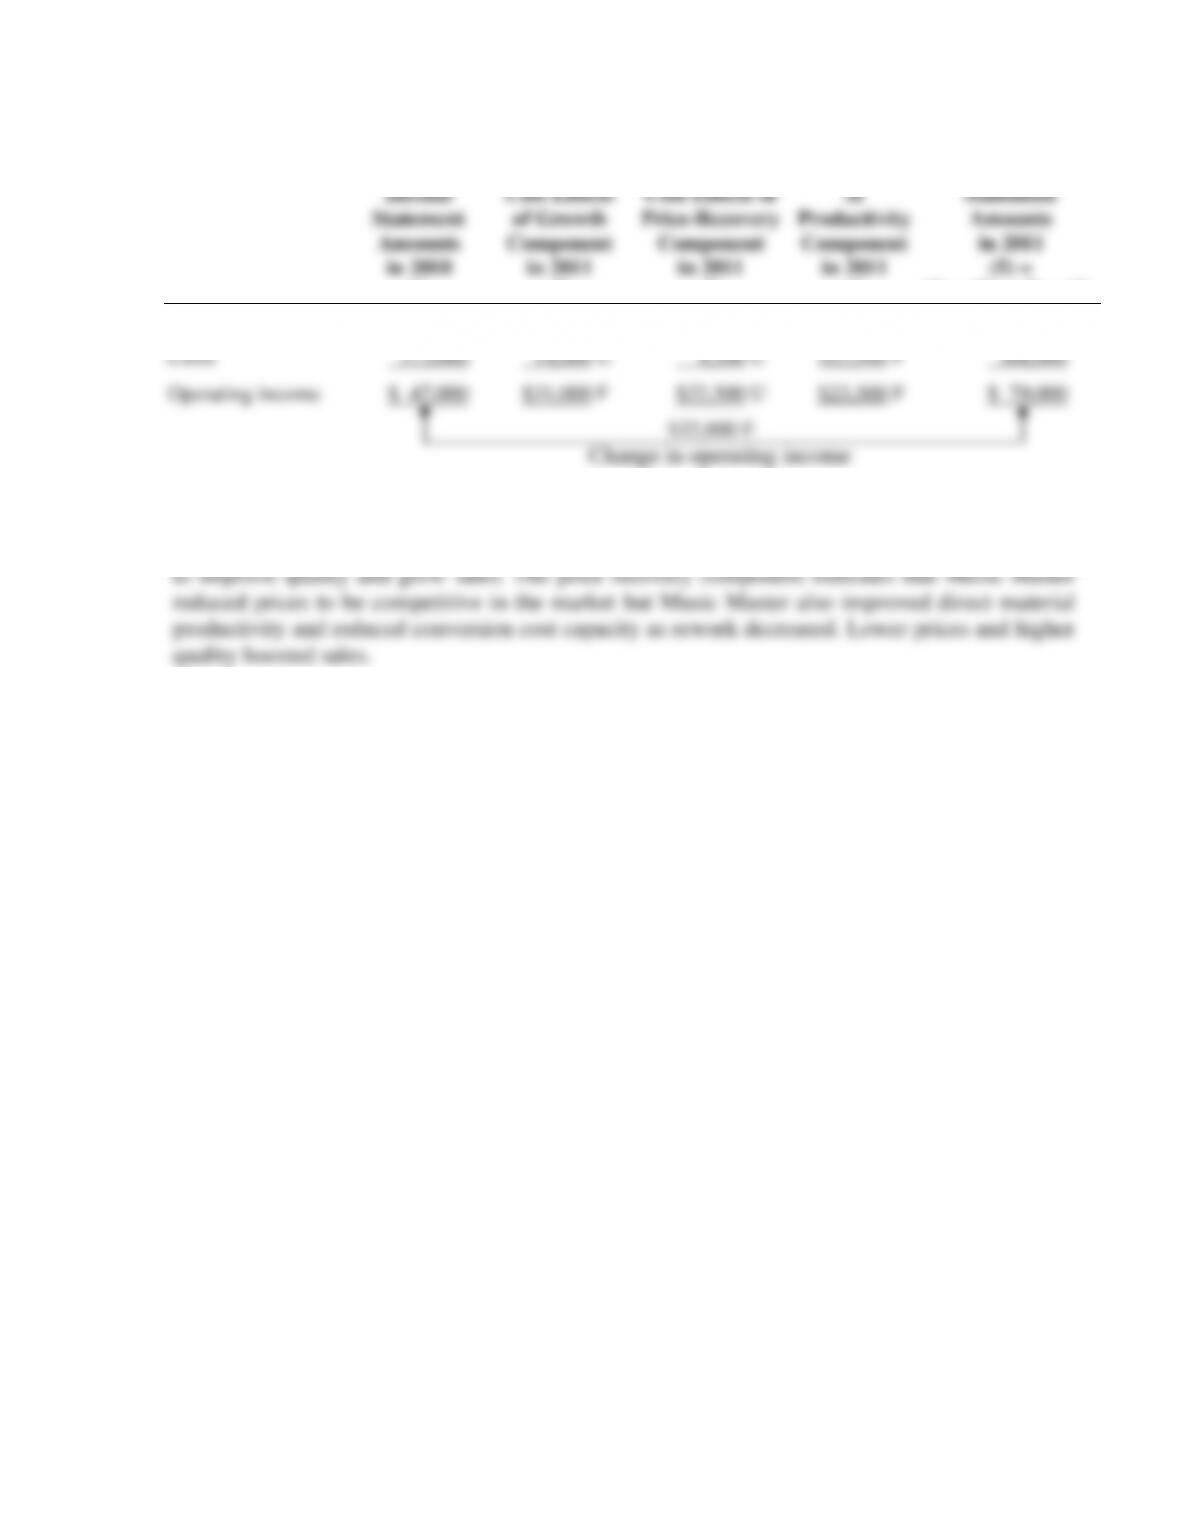
The change in operating income between 2010 and 2011 can be analyzed as follows:
Income
Statement
Amounts
in 2010
(1)
Revenue and
Cost Effects
of Growth
Component
in 2011
(2)
Revenue and
Cost Effects of
Price-Recovery
Component
in 2011
(3)
Cost Effect
of
Productivity
Component
in 2011
(4)
Income
Statement
Amounts
in 2011
(5) =
(1) + (2) + (3) + (4)
Revenues
$360,000
$45,000 F
$18,000 U
−−
$387,000
Costs
313,000
14,000 U
4,500 U
$23,500 F
308,000
Operating income
$ 47,000
$31,000 F
$22,500 U
$23,500 F
$ 79,000
$32,000 F
Change in operating income
3. The analysis of operating income indicates that a significant amount of the increase in
operating income resulted from Music Master’s cost leadership strategy. The company was able
.
13-30
13-32 (20 min.) Analysis of growth, price-recovery, and productivity components
(continuation of 13-31)
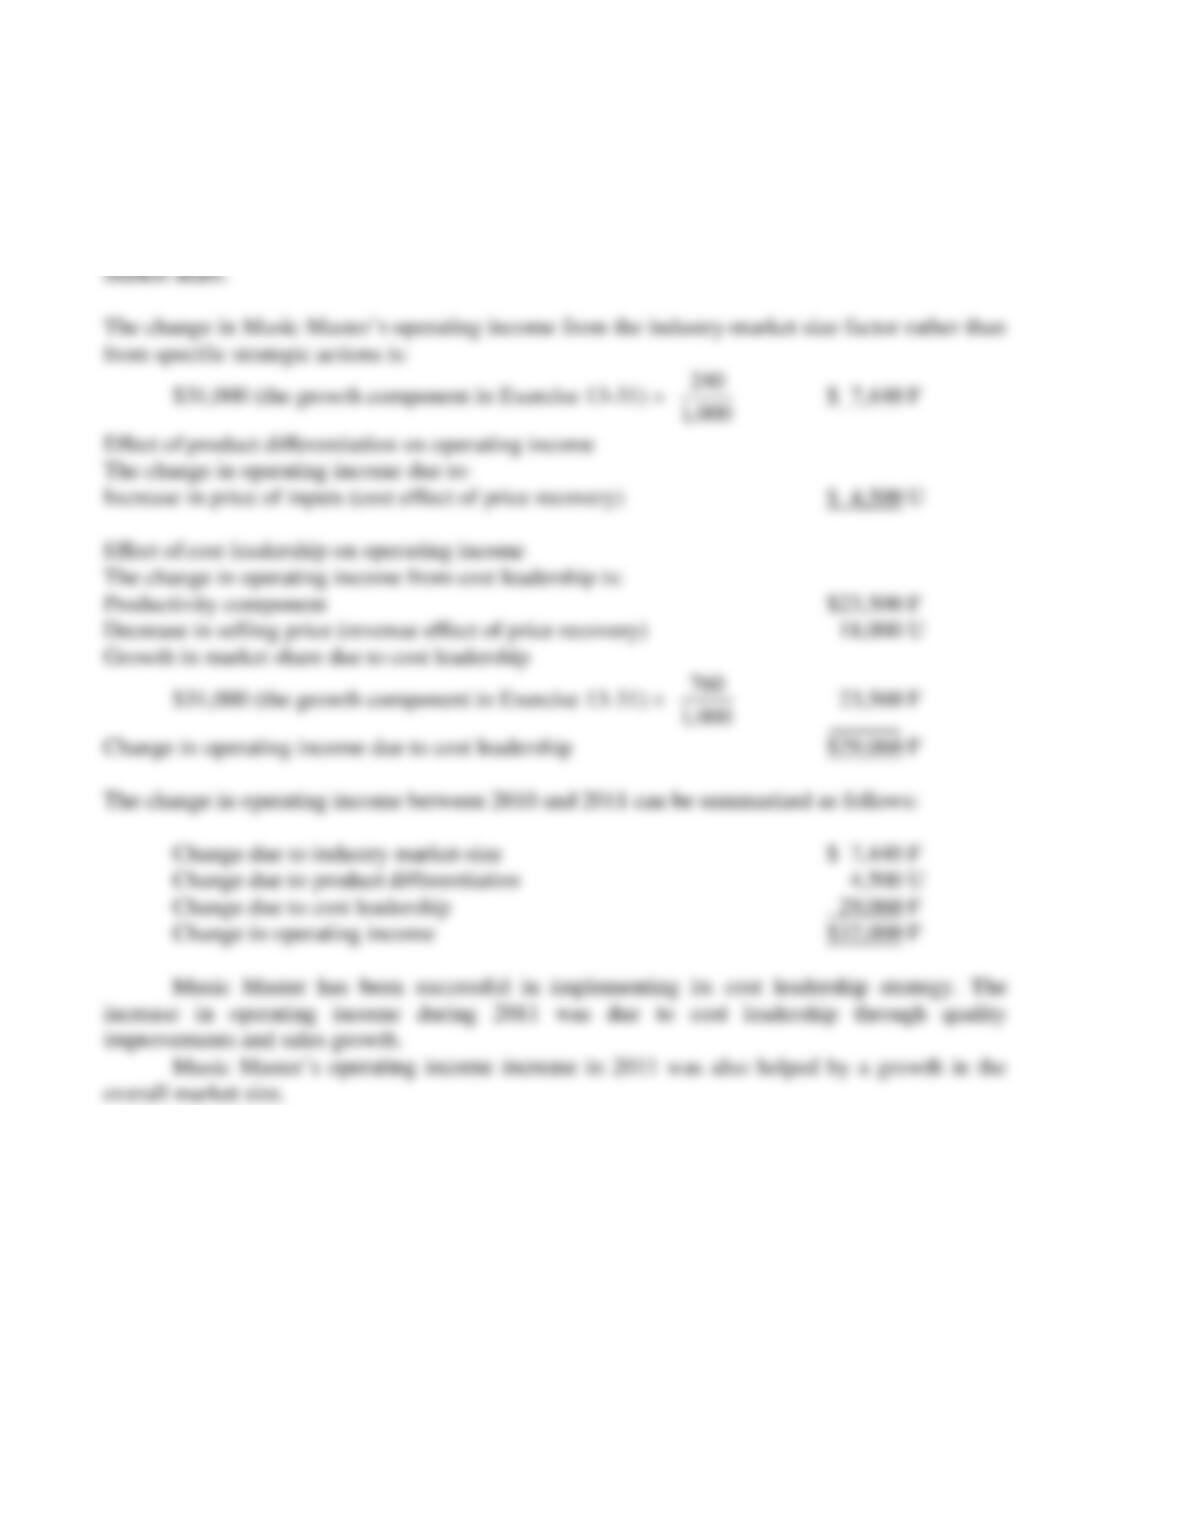
Effect of the industry-market-size factor on operating income
Of the 1,000-unit increase in sales from 8,000 to 9,000 units, 3% or 240 (3% 8,000)
units are due to growth in market size, and 760 (1,000 − 240) units are due to an increase in