13-33 (20 min.) Identifying and managing unused capacity (continuation of 13-31)
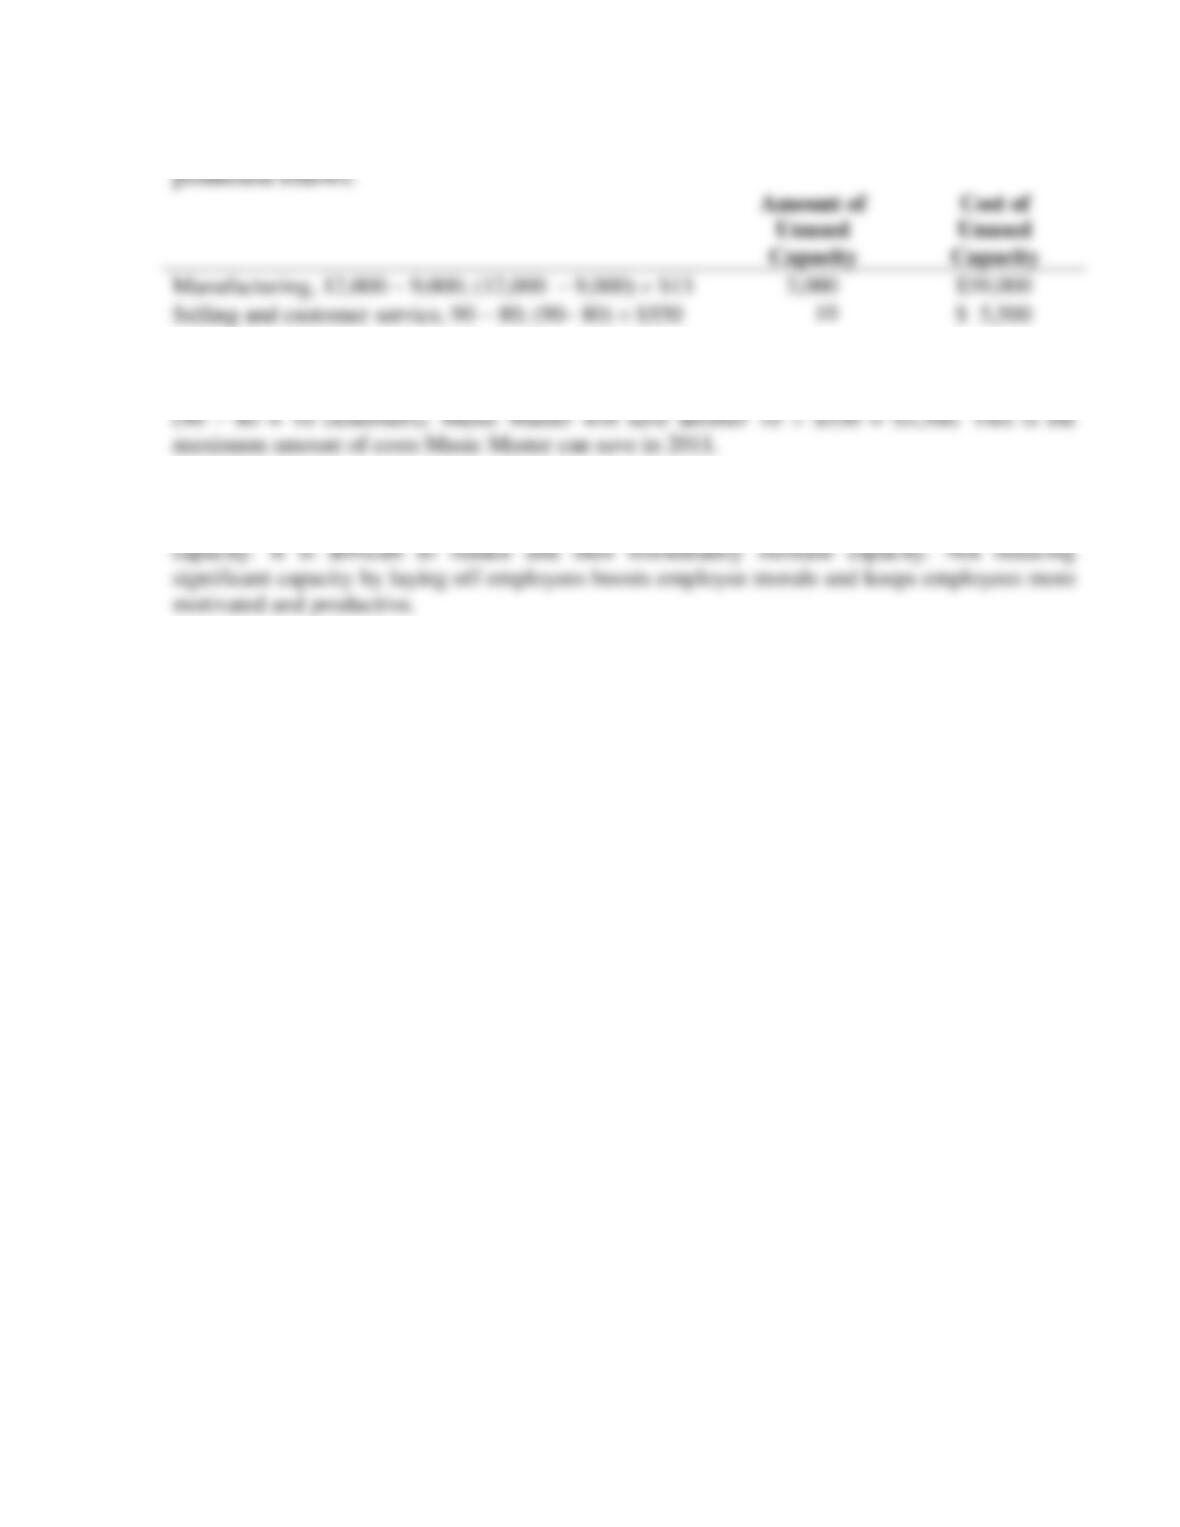
1. The amount and cost of unused capacity at the beginning of year 2011 based on year 2011
13-32
13-34 (20–30 min.) Balanced scorecard.
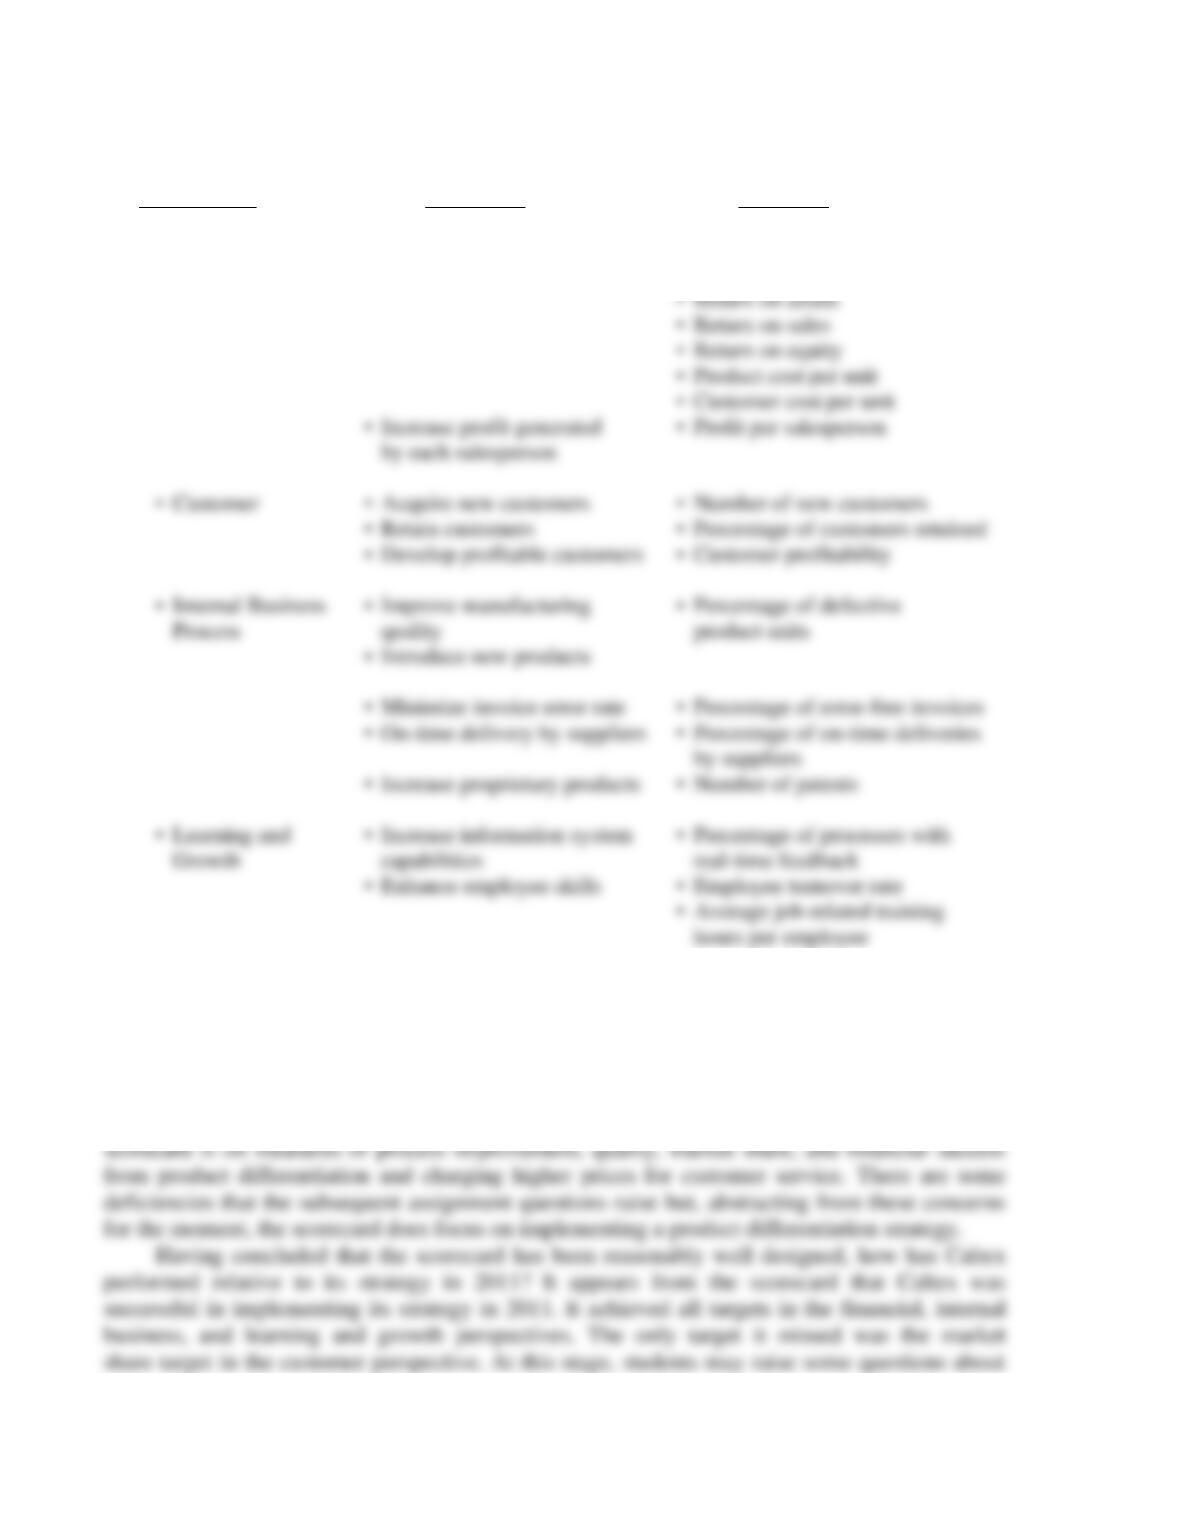
Strategic Performance
Perspectives Objectives Measures
▪ Financial ▪ Increase shareholder value ▪ Earnings per share
▪ Net income
13-35 (20 min.) Balanced scorecard.
1. Caltex’s strategy is to focus on “service–oriented customers” who are willing to pay a
higher price for services. Even though gasoline is largely a commodity product, Caltex wants to
differentiate itself through the service it provides at its retailing stations.
Does the scorecard represent Caltex’s strategy? By and large it does. The focus of the
13-33
whether this is a good scorecard measure. Requirement 3 gets at this issue in more detail. The
2. Yes, Caltex should include some measure of employee satisfaction and employee training
in the learning and growth perspective. Caltex’s differentiation strategy and ability to charge a
3. Caltex’s strategy is to focus on the 60% of gasoline consumers who are service-oriented,
not on the 40% price-shopper segment. To evaluate if it has been successful in implementing its
strategy, Caltex needs to measure its market share in its targeted market segment, “service–
4. Although there is a cause-and-effect link between internal business process measures and
customer measures on the current scorecard, Caltex should add more measures to tighten this
linkage. In particular, the current scorecard measures focus exclusively on refinery operations
5. Caltex is correct in not measuring changes in operating income from productivity
improvements on its scorecard under the financial perspective. Caltex’s strategy is to grow by
13-34
13-36 (30 min.) Balanced scorecard.
1. The market for color laser printers is competitive. Lee’s strategy is to produce and sell
high quality laser printers at a low cost. The key to achieving higher quality is reducing defects
in its manufacturing operations. The key to managing costs is dealing with the high fixed costs of
2011. Although it achieved targeted performance in the learning and growth and internal
2. Lee’s scorecard does not provide any explanation of why the target market share was not
met in 2011. Was it due to poor quality? Higher prices? Poor post-sales service? Inadequate
supply of products? Poor distribution? Aggressive competitors? The scorecard is not helpful for
3. Lee should include a measure of employee satisfaction to the learning and growth
perspective and a measure of new product development to the internal business process
perspective. The focus of its current scorecard measures is on processes and not on people and
innovation.
13-35
4. Improving quality and significantly downsizing to eliminate unused capacity is difficult.
Recall that the key to improving quality at Lee Corporation is training and empowering workers.
As quality improvements occur, capacity will be freed up, but because costs are fixed, quality
13-36
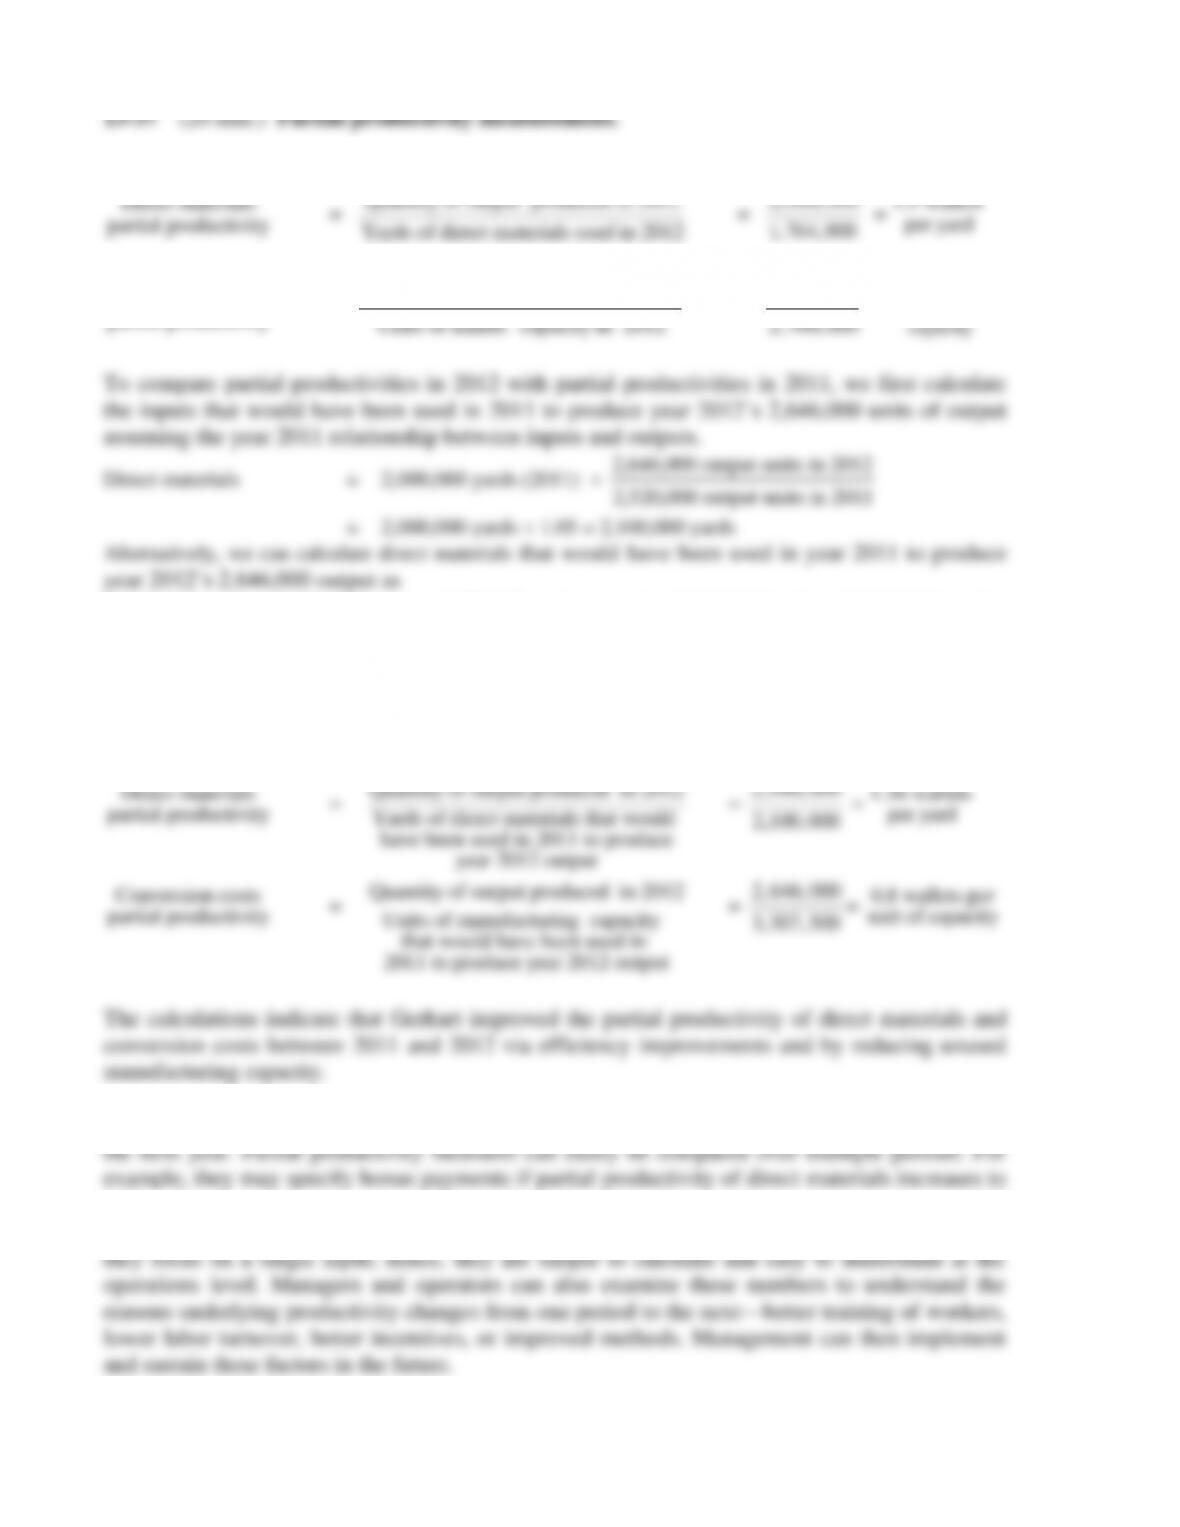
1. Gerhart Company’s partial productivity ratios in 2012 are as follows:
Direct materials
partial productivity
=
Quantity of output produced in 2012
Yards of direct materials used in 2012
=
2,646,000
1,764,000
=
1.5 wallets
per yard
Conversion costs
partial productivity
=
Quantity of output produced in 2012
Units of manuf. capacity in 2012
=
2,646,000
2,700,000
=
0.98 wallets
per unit of
capacity
2,000,000 yards 2,520,000 units = 0.79365 yards per unit 2,646,000 units = 2,100,000 yards.
Manufacturing capacity = 3,307,500 units of capacity, because manufacturing capacity is fixed,
and adequate capacity existed in 2011 to produce year 2012 output.
Partial productivity calculations for 2011 based on year 2012 output (to make the partial
productivities comparable across the two years):
Direct materials
partial productivity
=
Quantity of output produced in 2012
Yards of direct materials that would
have been used in 2011 to produce
year 2012 output
=
2,646,000
2,100,000
=
1.26 wallets
per yard
Conversion costs
partial productivity
=
Quantity of output produced in 2012
Units of manufacturing capacity
that would have been used in
2011 to produce year 2012 output
=
2,646,000
3,307,500
=
0.8 wallets per
unit of capacity
The calculations indicate that Gerhart improved the partial productivity of direct materials and
conversion costs between 2011 and 2012 via efficiency improvements and by reducing unused
manufacturing capacity.
2. Gerhart Company management can use the partial productivity measures to set targets for
1.95 units of output per yard and if partial productivity of conversion costs improves to 1.25
units of output per unit of capacity. A major advantage of partial productivity measures is that
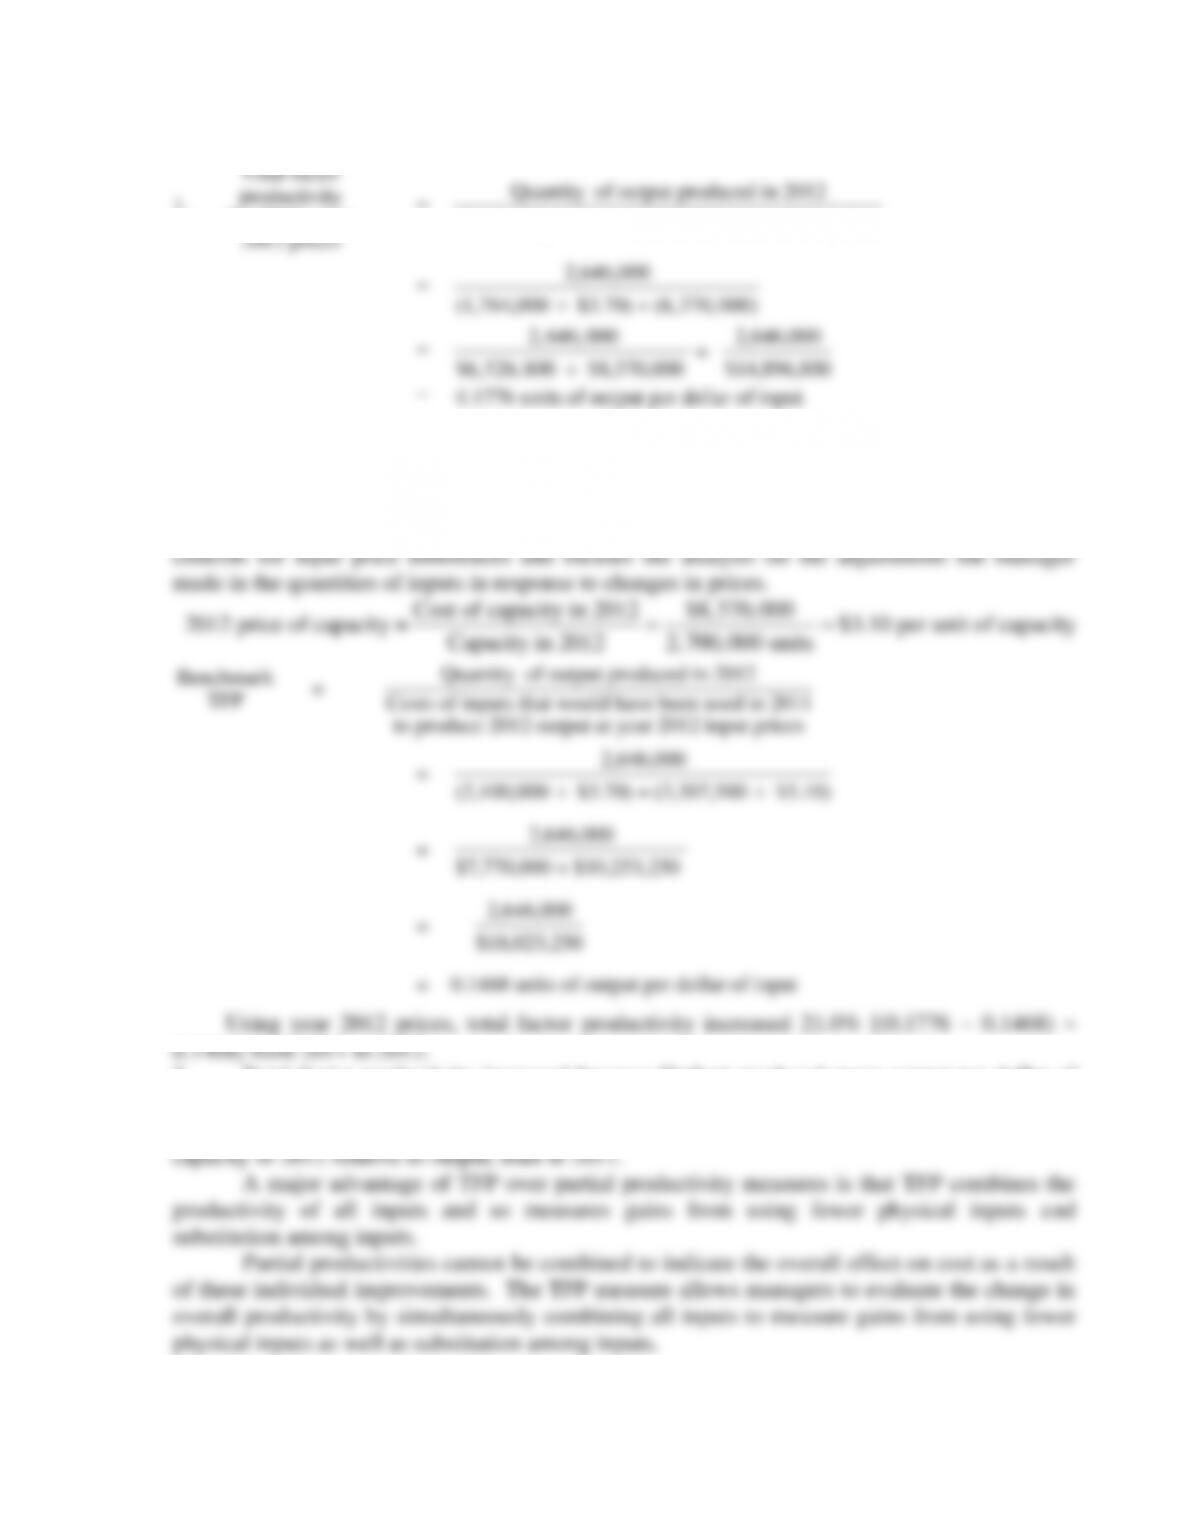
13-38 (25 min.) Total factor productivity (continuation of 13-37)
1.
Total factor
productivity
for 2012 using
2012 prices
=
Quantity of output produced in 2012
Costs of inputs used in 2012 based on 2012 prices
2,646,000
2. By itself, the 2012 TFP of 0.1776 units per dollar of input is not particularly helpful. We
need something to compare the 2012 TFP against. We use, as a benchmark, TFP calculated using
the inputs that Gerhart would have used in 2011 to produce 2,648,000 units of output calculated
in requirement 1 at 2012 prices. Using the current year’s (2012) prices in both calculations
3. Total factor productivity increased because Gerhart produced more output per dollar of
input in 2012 relative to 2011, measured in both years using 2012 prices. The change in partial
productivity of direct materials and conversion costs tells us that Gerhart used less materials and
1. Halsey is following a product differentiation strategy. Halsey offers a wide selection of
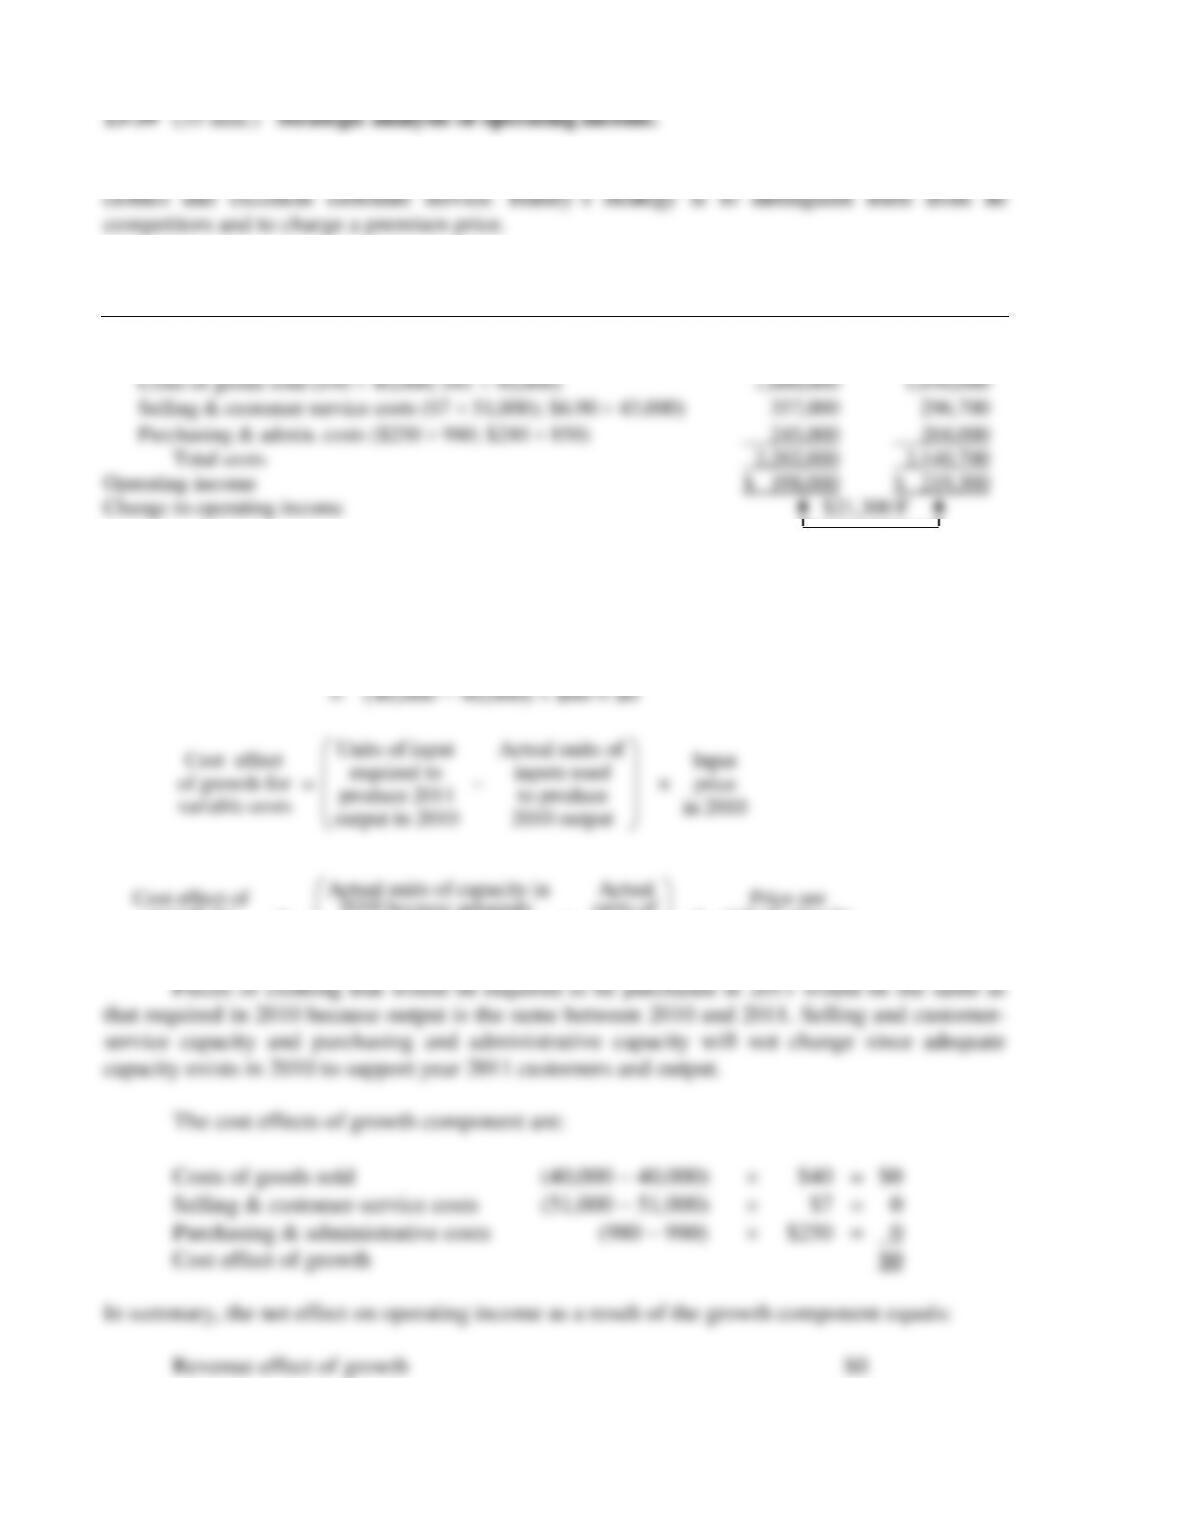
2. Operating income for each year is as follows:
2010 2011
Revenues ($60 40,000; $59 40,000) $2,400,000 $2,360,000
Costs
3. The Growth Component
Revenue effect
of growth
=
Actual units of Actual units of Selling
output sold output sold price
in 2011 in 2010 in 2010
−
Cost effect of growth 0
Change in operating income due to growth $0
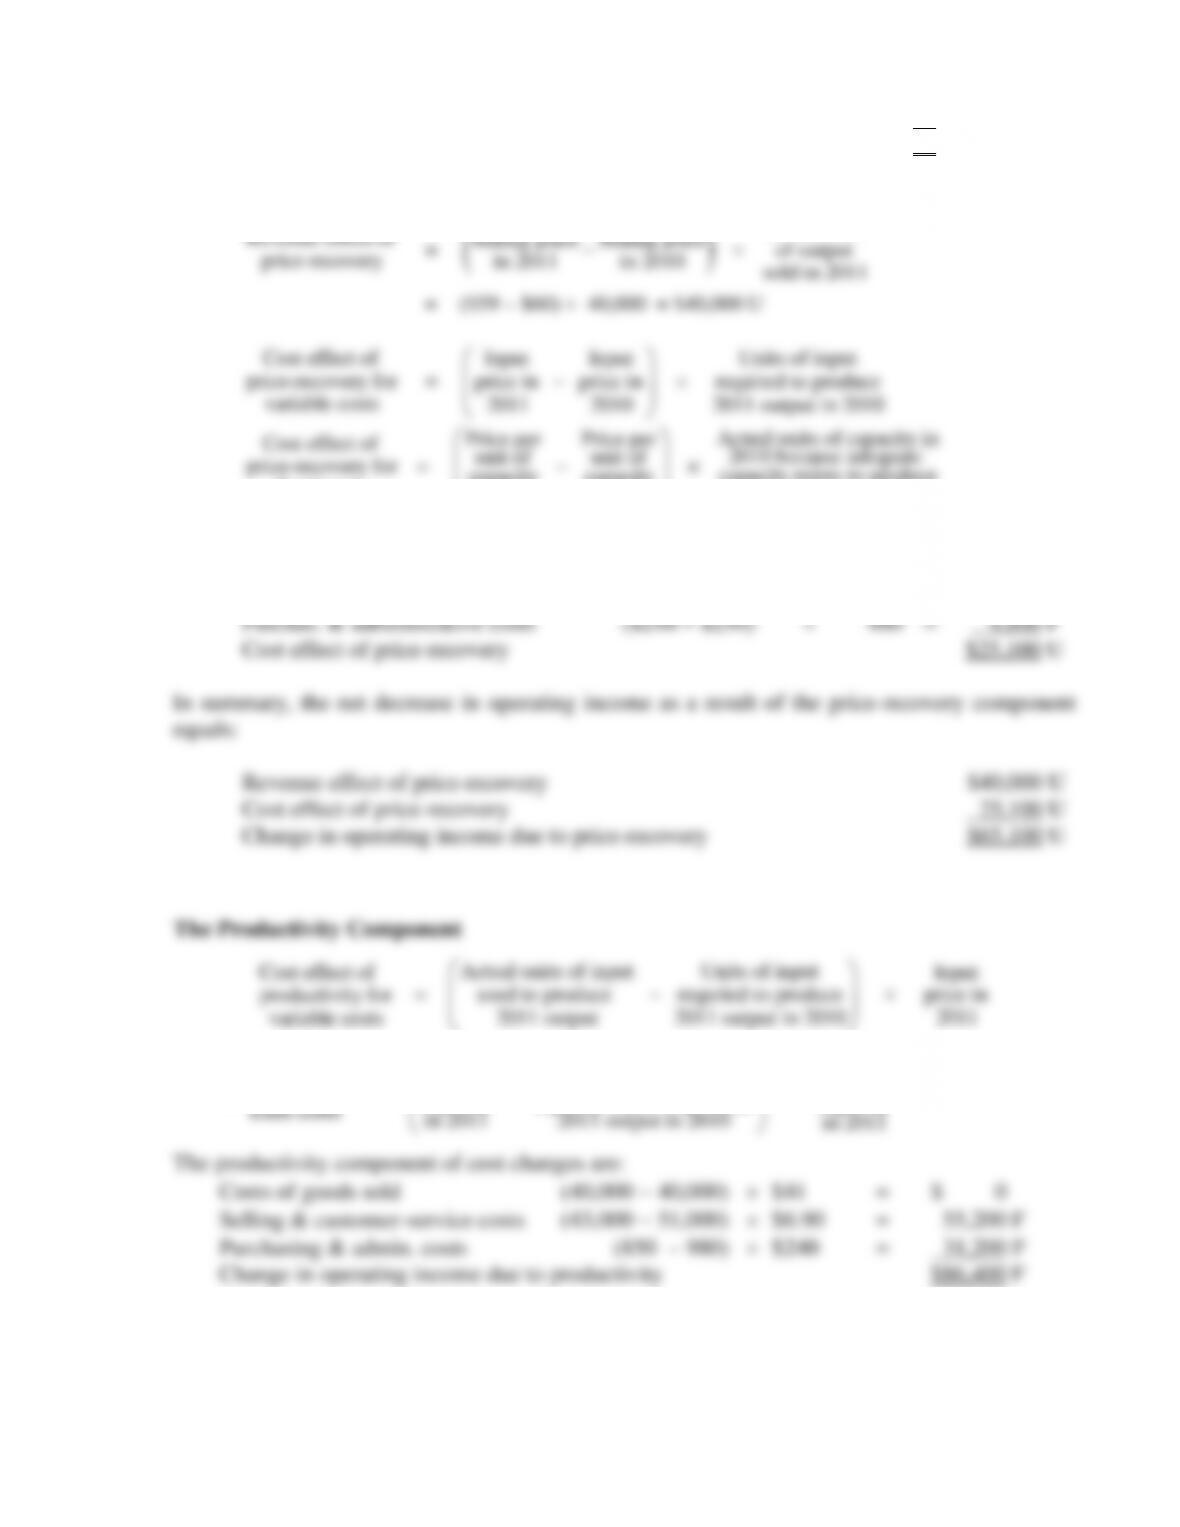
The Price-Recovery Component
Revenue effect of
Actual units
Selling price Selling price of output
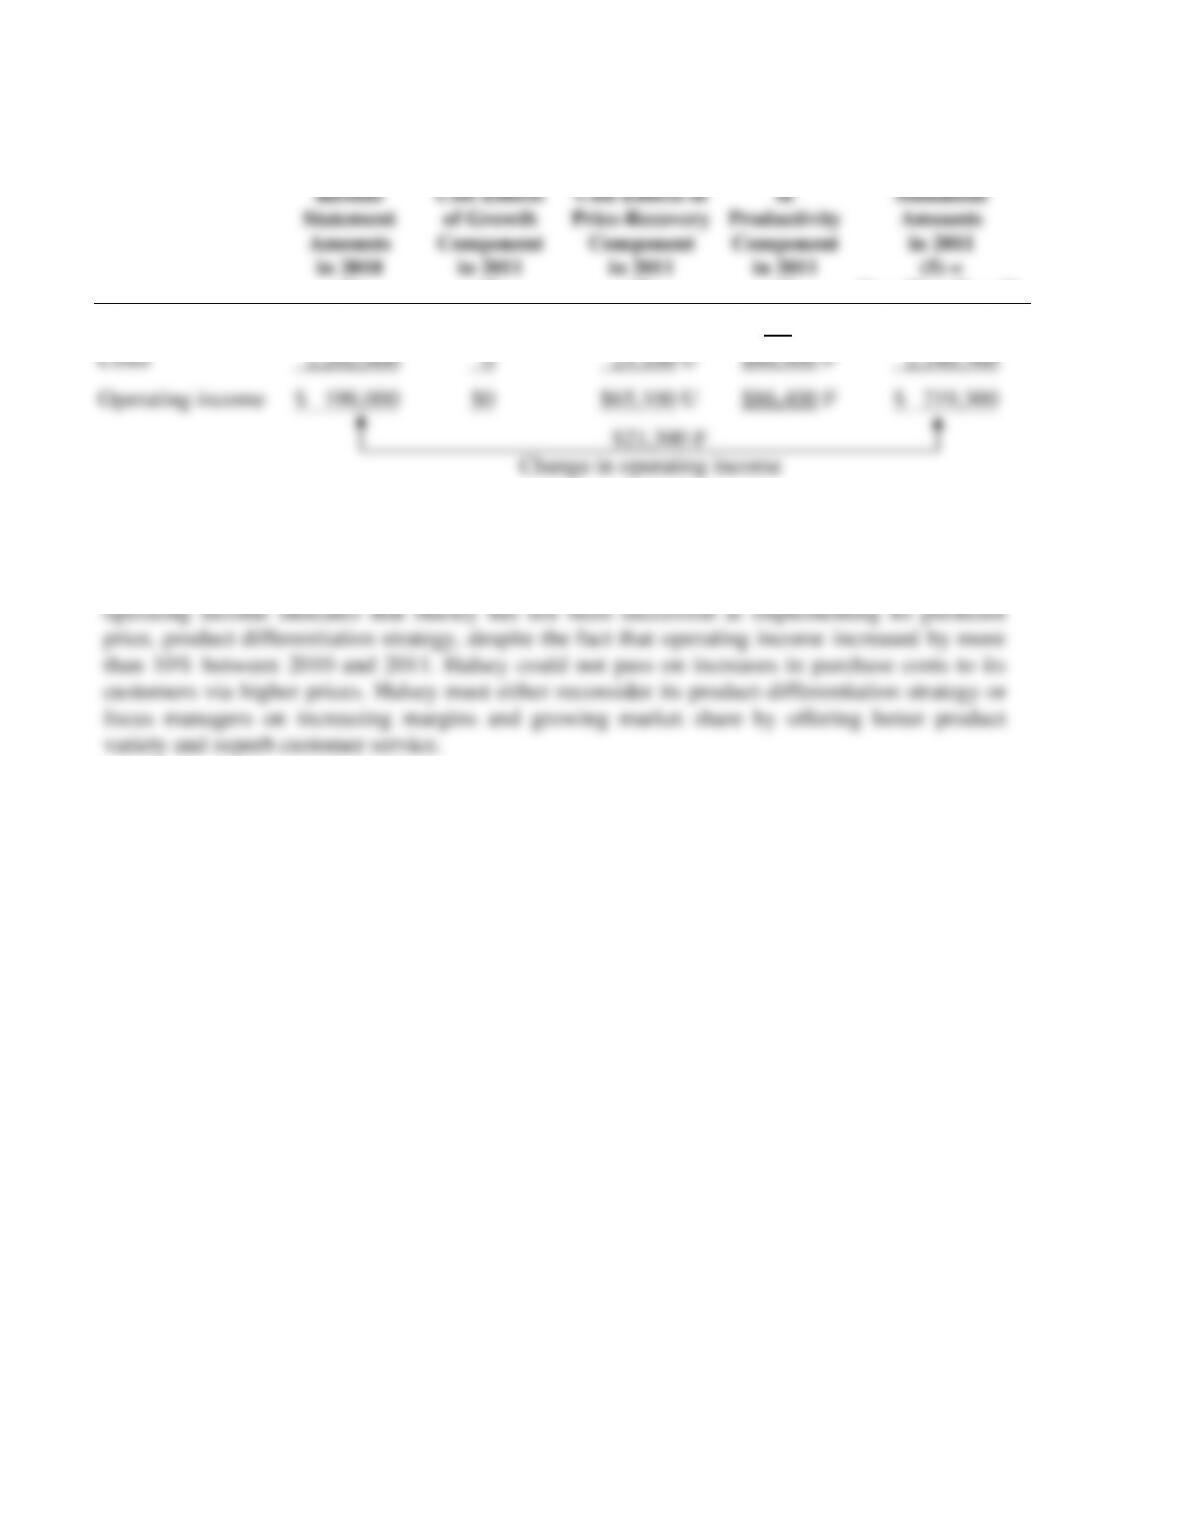
The change in operating income between 2010 and 2011 can be analyzed as follows:
Income
Statement
Amounts
in 2010
(1)
Revenue and
Cost Effects
of Growth
Component
in 2011
(2)
Revenue and
Cost Effects of
Price-Recovery
Component
in 2011
(3)
Cost Effect
of
Productivity
Component
in 2011
(4)
Income
Statement
Amounts
in 2011
(5) =
(1) + (2) + (3) + (4)
Revenues
$2,400,000
$0
$40,000 U
$2,360,000
Costs
2,202,000
0
25,100 U
$86,400 F
2,140,700
Operating income
$ 198,000
$0
$65,100 U
$86,400 F
$ 219,300
$21,300 F
Change in operating income
4. The analysis of operating income indicates that a significant amount of the increase in
operating income resulted from productivity gains rather than product differentiation. The
company was unable to charge a premium price for its clothes. Thus, the strategic analysis of