18-1
18-1 Managers have found that improved quality and intolerance for high spoilage have
lowered overall costs and increased sales.
18-2 Spoilage—units of production that do not meet the standards required by customers for
good units and that are discarded or sold at reduced prices.
18-3 Yes. Normal spoilage is spoilage inherent in a particular production process that arises
18-4 Abnormal spoilage is spoilage that is not inherent in a particular production process and
18-5 Management effort can affect the spoilage rate. Many companies are relentlessly
18-6 Normal spoilage typically is expressed as a percentage of good units passing the
18-7 Accounting for spoiled goods deals with cost assignment, rather than with cost
18-8 Yes. Normal spoilage rates should be computed from the good output or from the normal
input, not the total input. Normal spoilage is a given percentage of a certain output base. This
base.
18-9 Yes, the point of inspection is the key to the assignment of spoilage costs. Normal
18-10 No. If abnormal spoilage is detected at a different point in the production cycle than
18-2
18-11 No. Spoilage may be considered a normal characteristic of a given production cycle. The
18-12 No. Unless there are special reasons for charging normal rework to jobs that contained
18-13 Yes. Abnormal rework is a loss just like abnormal spoilage. By charging it to
18-14 A company is justified in inventorying scrap when its estimated net realizable value is
significant and the time between storing it and selling or reusing it is quite long.
18-15 Companies measure scrap to measure efficiency and to also control a tempting source of
theft. Managers of companies that report high levels of scrap focus attention on ways to reduce
1. Total spoiled units 12,000
2. Abnormal spoilage, 5,400 $10 $ 54,000
Normal spoilage, 6,600 $10 66,000
Potential savings, 12,000 $10 $120,000
18-3
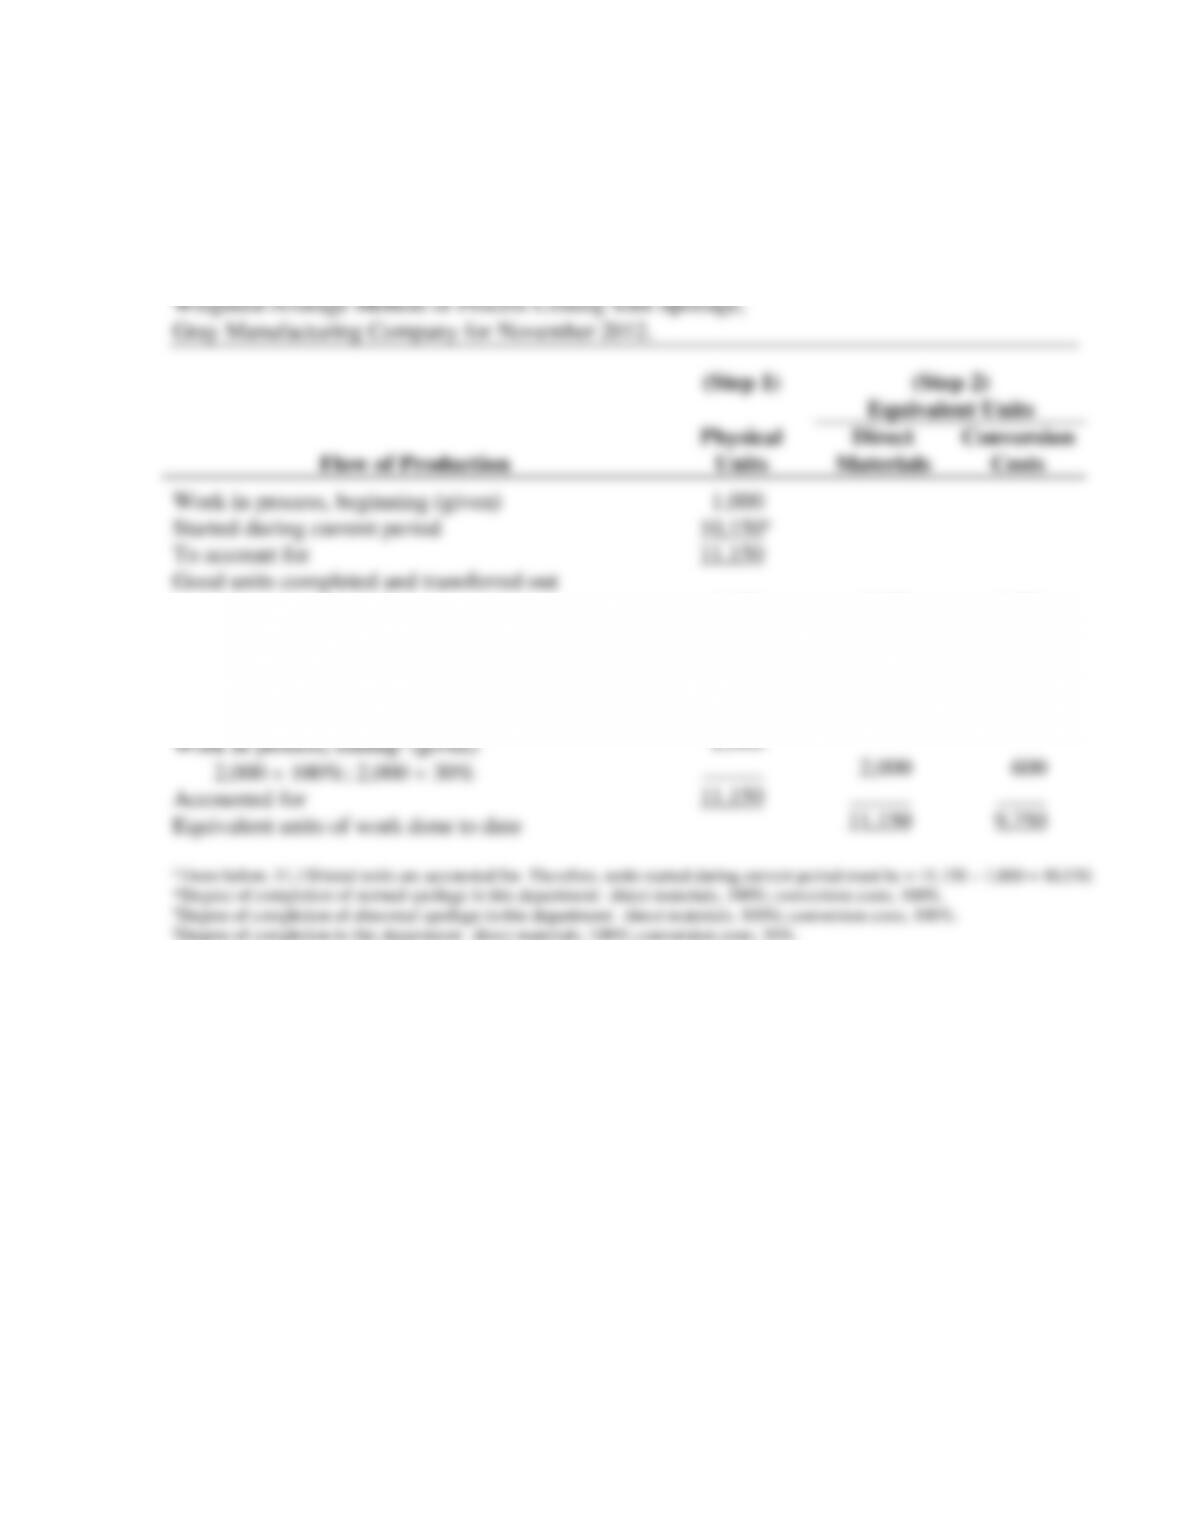
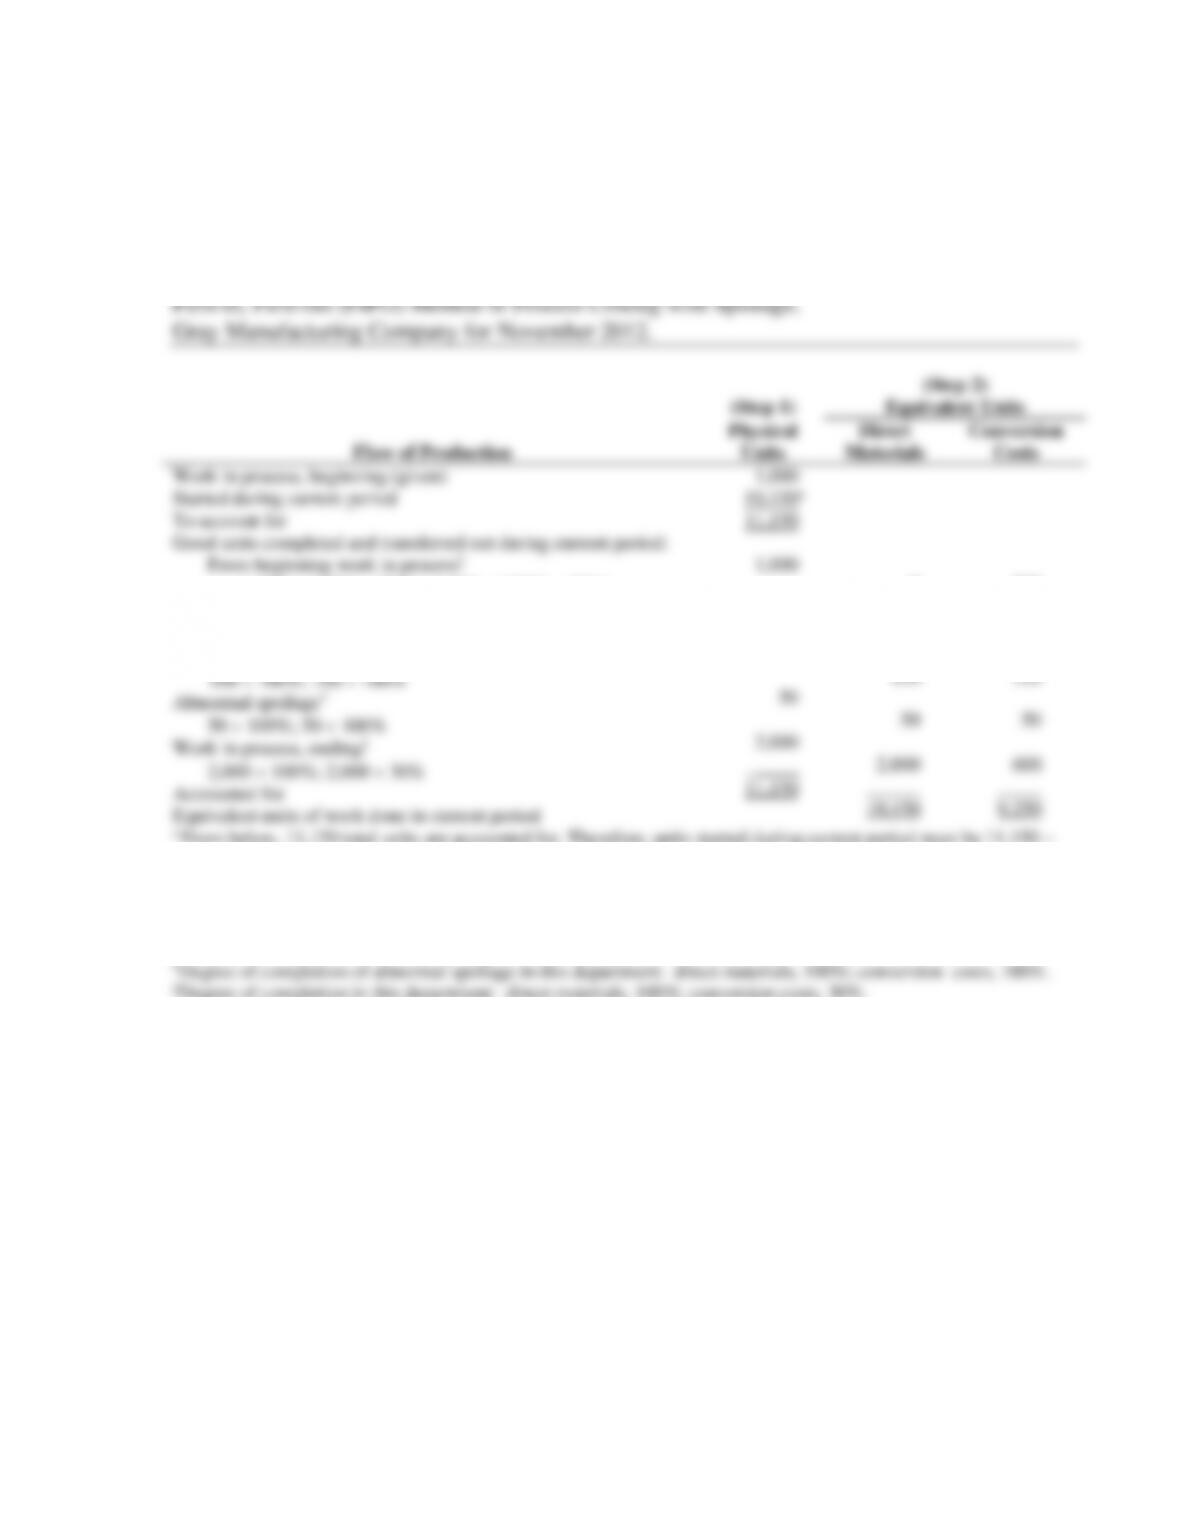
18-17 (20 min.) Weighted-average method, spoilage, equivalent units.
Solution Exhibit 18-17 calculates equivalent units of work done to date for direct materials and
conversion costs.
SOLUTION EXHIBIT 18-17
Summarize Output in Physical Units and Compute Output in Equivalent Units;
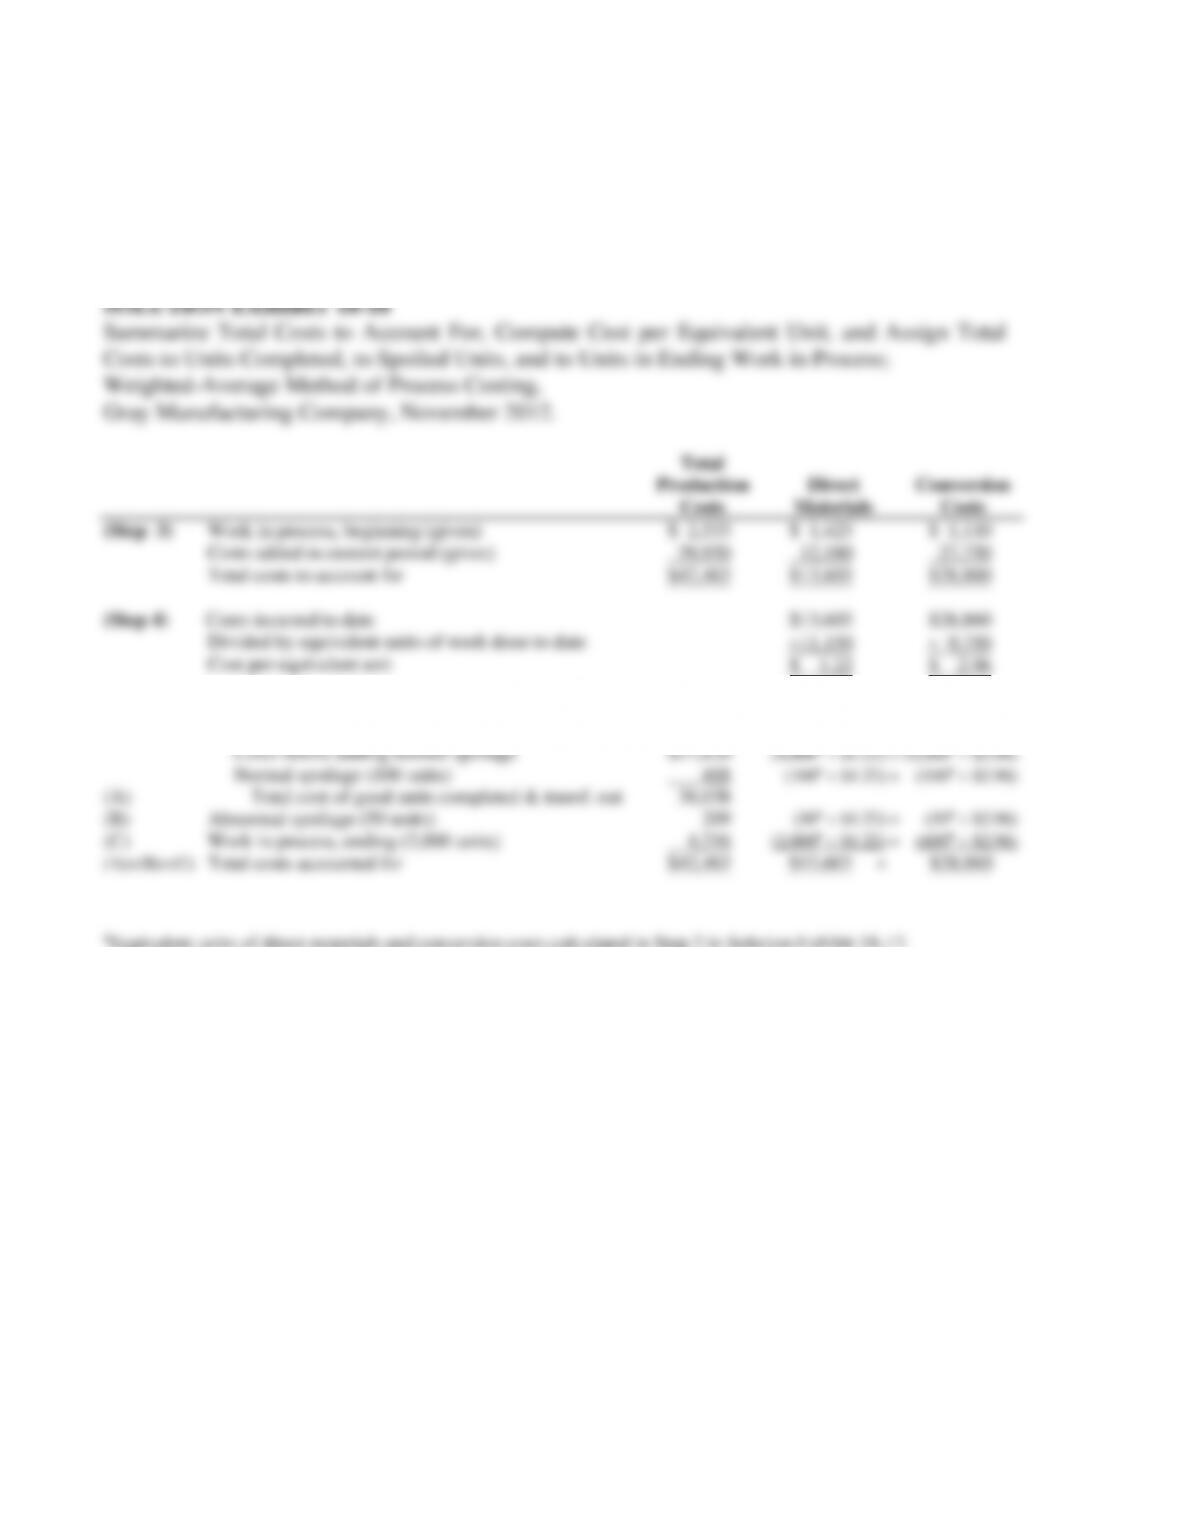
18-18 (20−25 min.) Weighted-average method, assigning costs (continuation of 18-17).
Solution Exhibit 18-18 summarizes total costs to account for, calculates the costs per equivalent
unit for direct materials and conversion costs, and assigns total costs to units completed and
transferred out (including normal spoilage), to abnormal spoilage, and to units in ending work in
process.
18-5
18-19 (15 min.) FIFO method, spoilage, equivalent units.
Solution Exhibit 18-19 calculates equivalent units of work done in the current period for direct
materials and conversion costs.
SOLUTION EXHIBIT 18-19
Summarize Output in Physical Units and Compute Output in Equivalent Units;
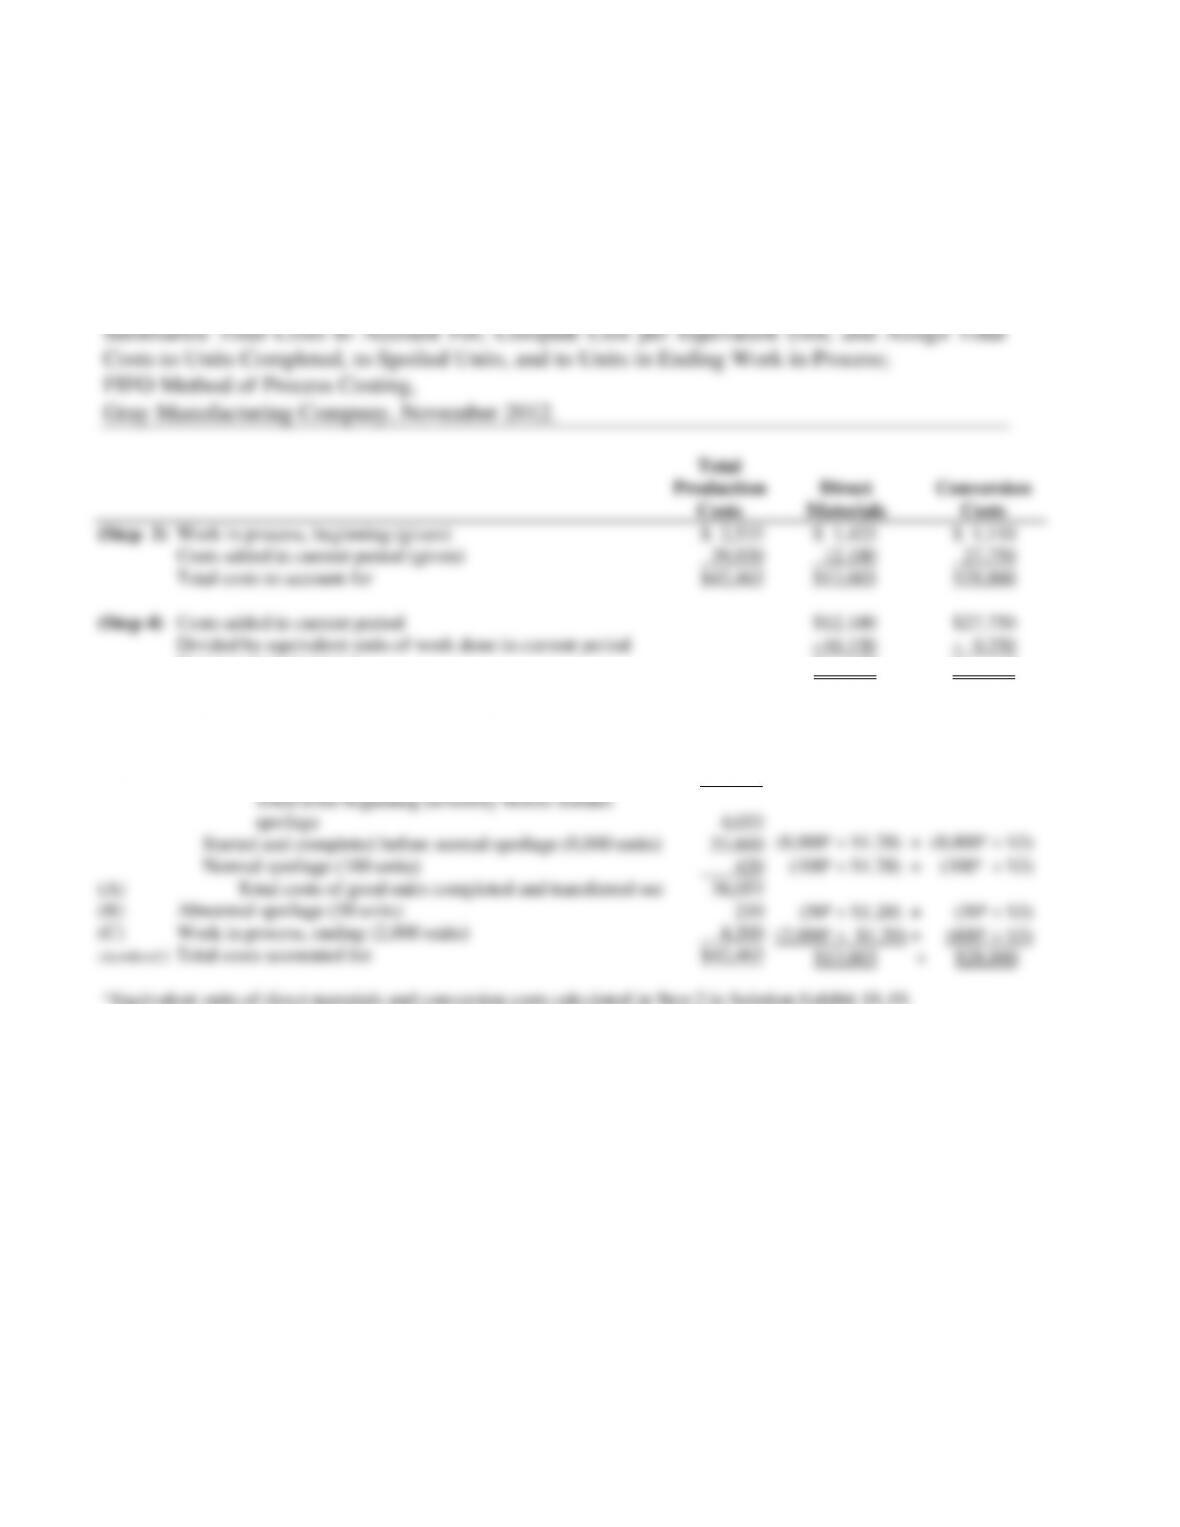
18-20 (20−25 min.) FIFO method, assigning costs (continuation of 18-19).
Solution Exhibit 18-20 summarizes total costs to account for, calculates the costs per equivalent
unit for direct materials and conversion costs, and assigns total costs to units completed and
transferred out (including normal spoilage), to abnormal spoilage, and to units in ending work in
process.
SOLUTION EXHIBIT 18-20
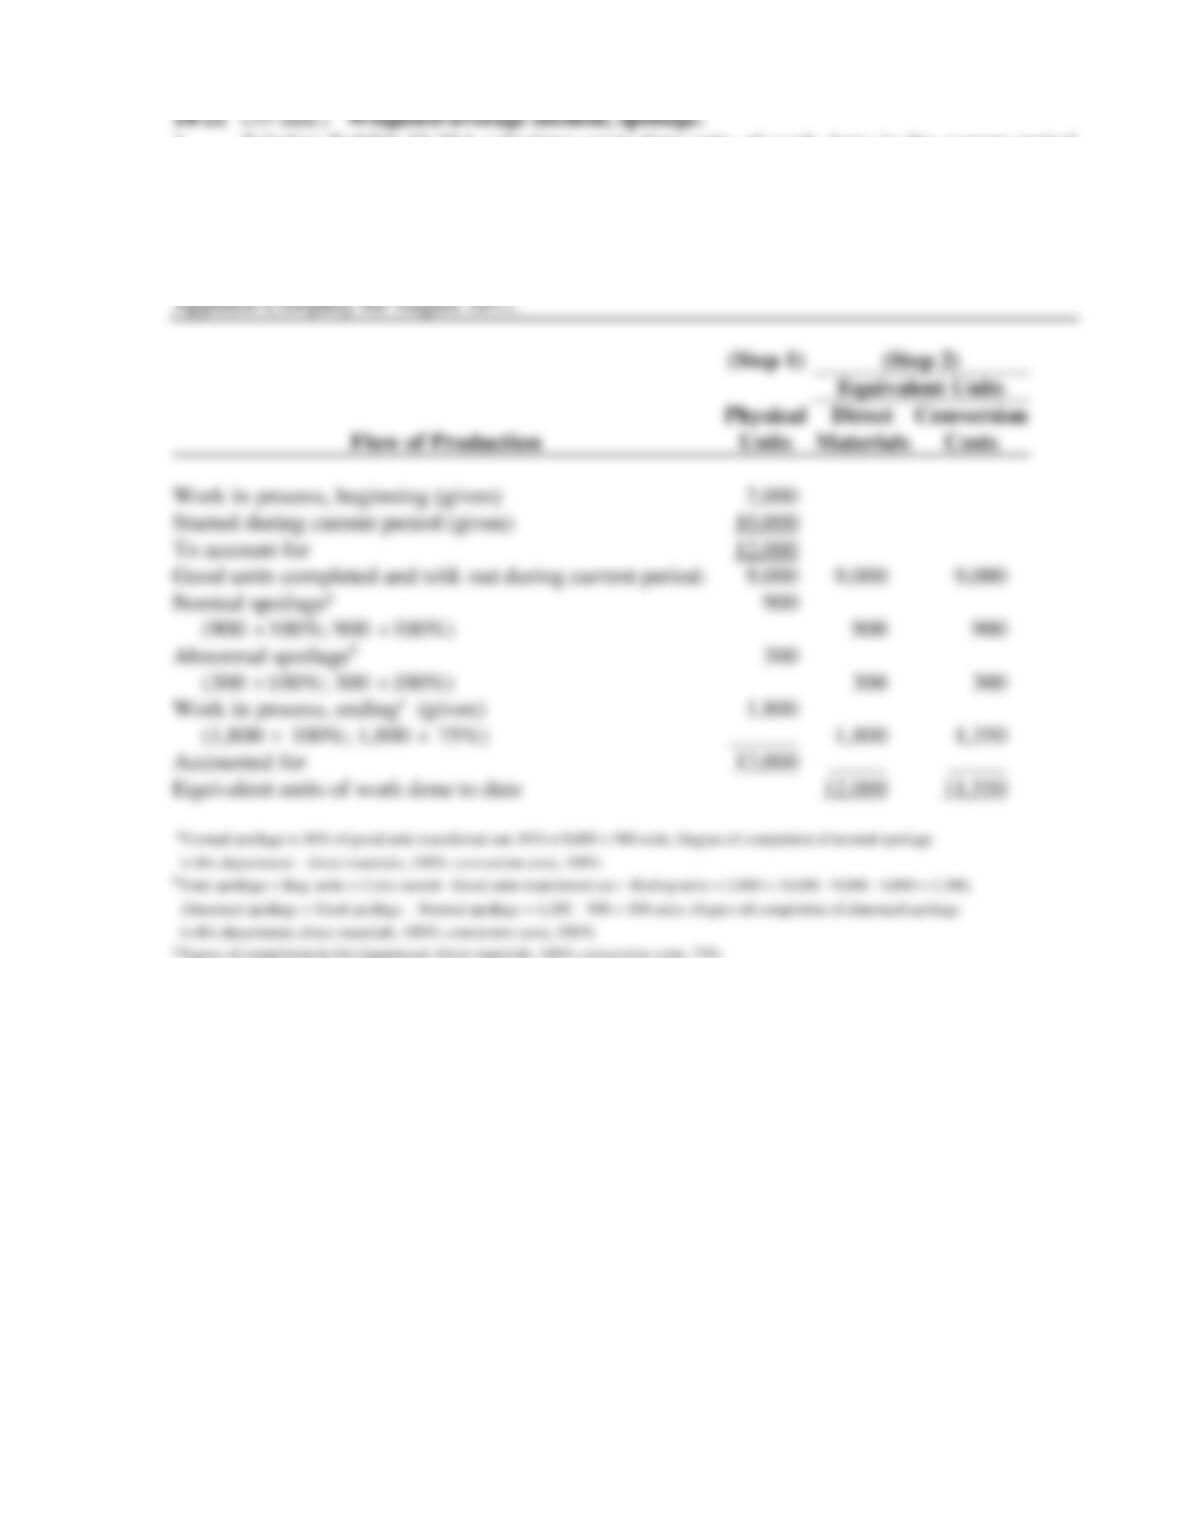
1. Solution Exhibit 18-21A calculates equivalent units of work done in the current period
for direct materials and conversion costs.
SOLUTION EXHIBIT 18-21A
Summarize Output in Physical Units and Compute Output in Equivalent Units;
Weighted-Average Method of Process Costing with Spoilage,
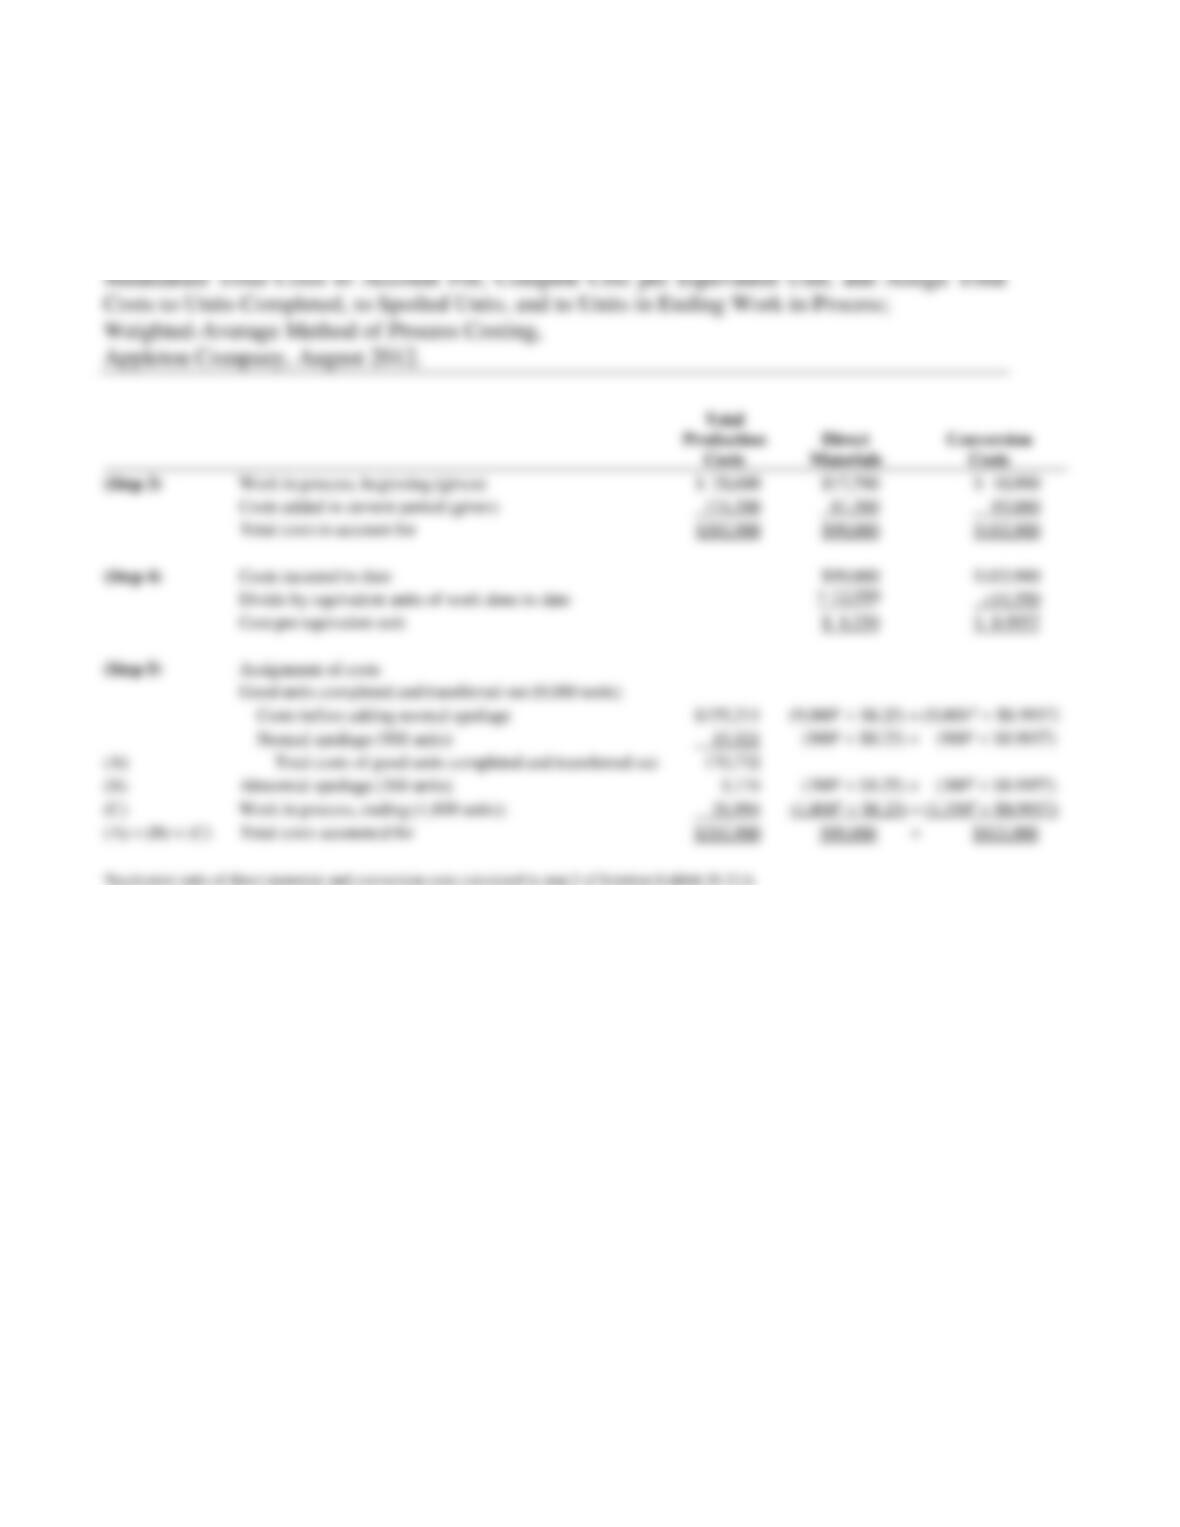
2. Solution Exhibit 18-21B summarizes total costs to account for, calculates the costs per
equivalent unit for direct materials and conversion costs, and assigns total costs to units
completed and transferred out (including normal spoilage), to abnormal spoilage, and to units in
ending work in process, using the weighted-average method.
SOLUTION EXHIBIT 18-21B
18-9
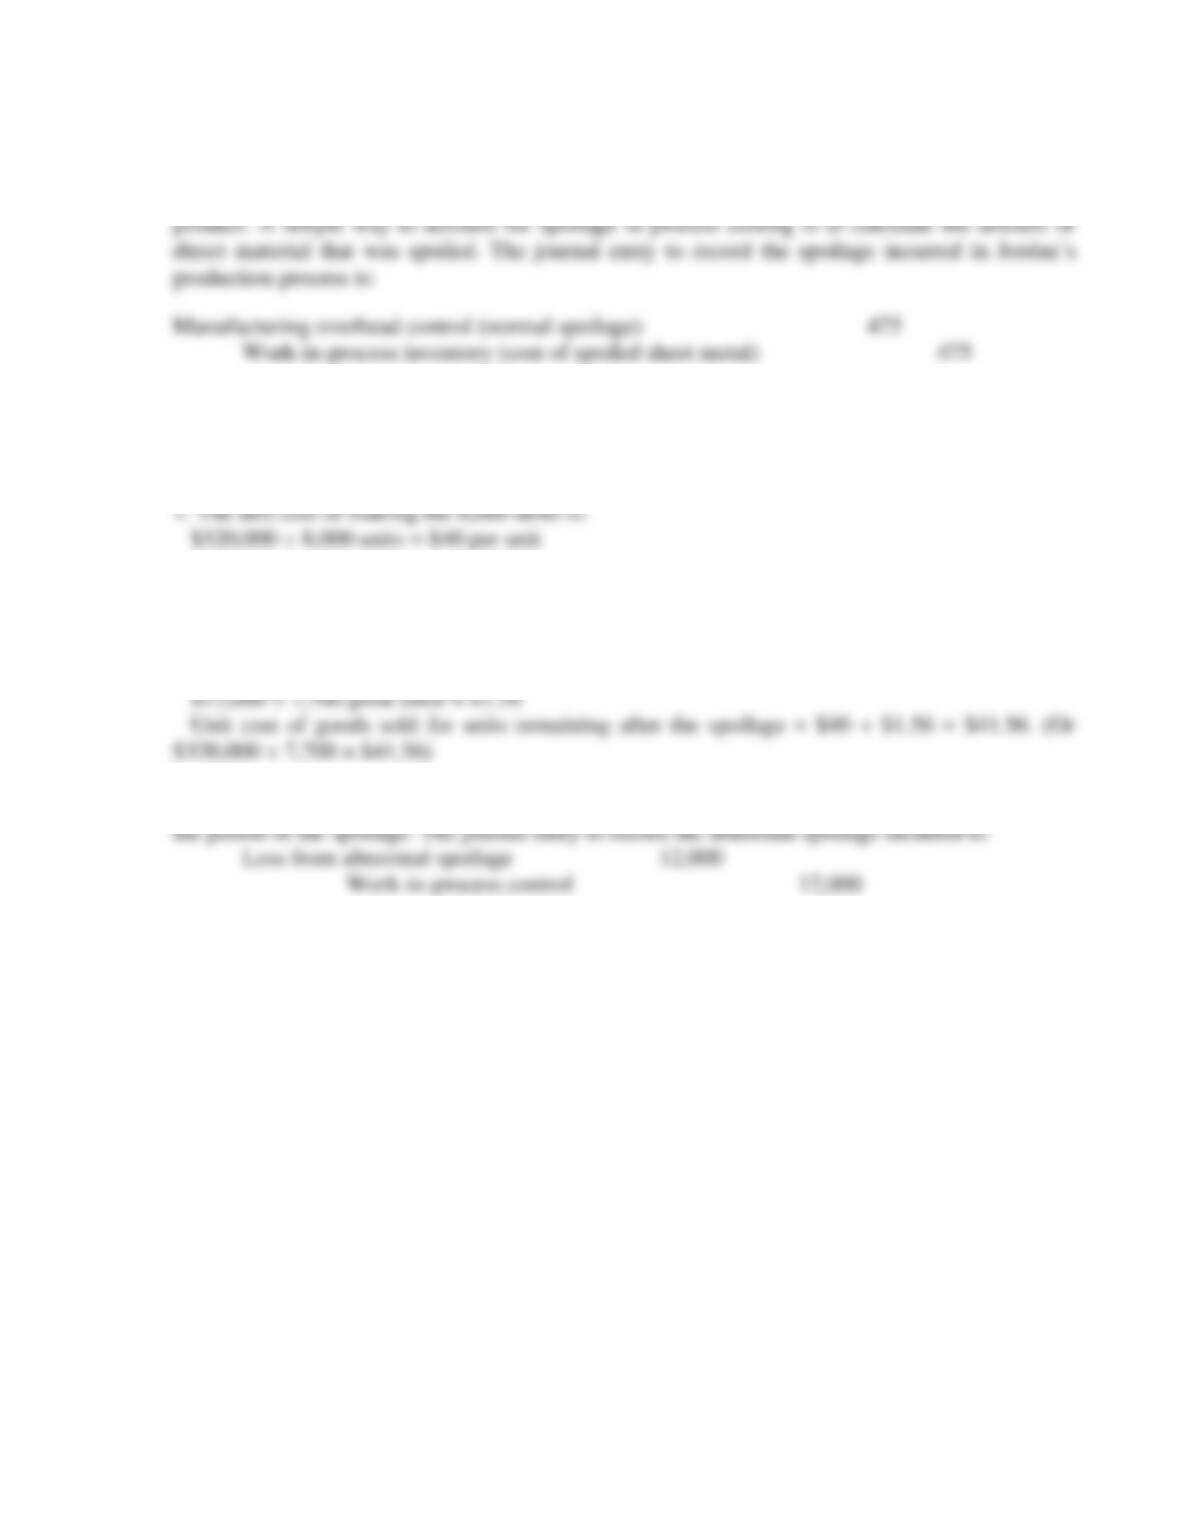
18-22 (10 min.) Standard costing method, spoilage, journal entries.
Spoilage represents the amount of resources that go into the process, but do not result in finished
18-23 (15 min.) Recognition of loss from spoilage.
2. The total cost of the 300 spoiled units is:
$40 × 300 units = $12,000
3. The increase in the per-unit cost of goods sold as a result of the normal spoilage is:
4. The $12,000 cost for the 300 spoiled units is taken out of manufacturing costs and expensed in
18-10
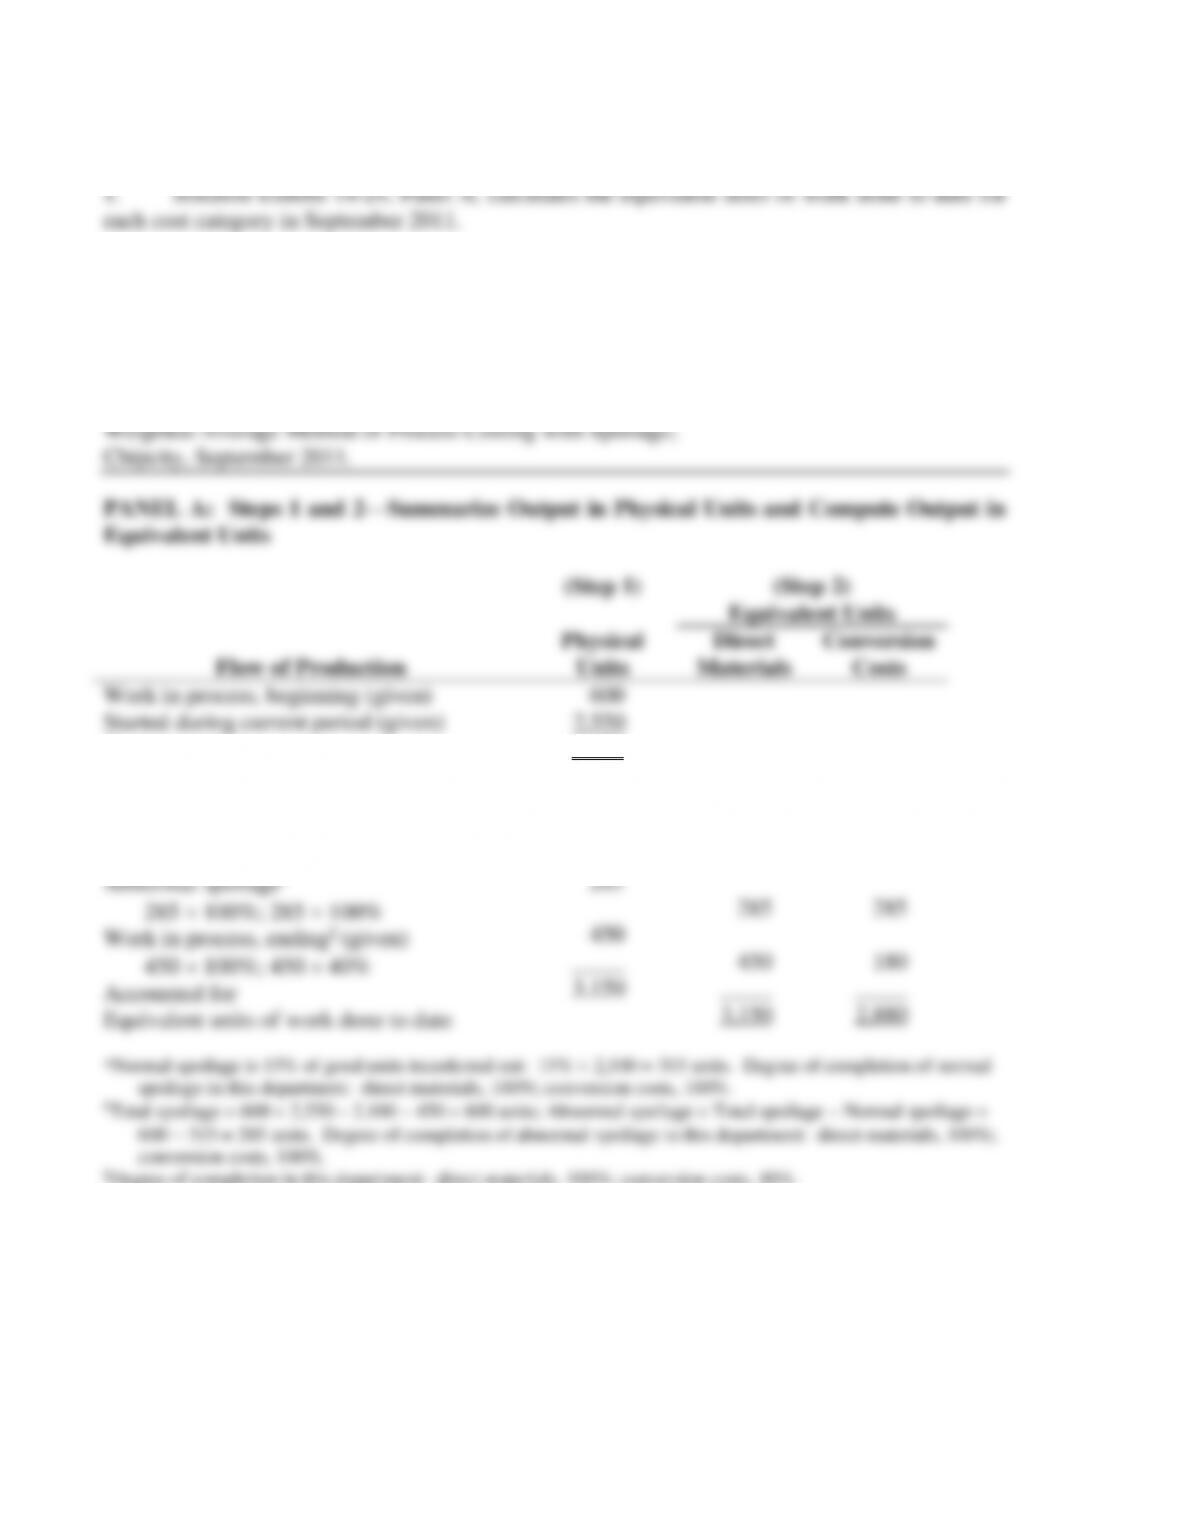
18-24 (25 min.) Weighted-average method, spoilage.
2. Solution Exhibit 18-24, Panel B, summarizes total costs to account for, calculates the
costs per equivalent unit for each cost category, and assigns total costs to units completed
(including normal spoilage), to abnormal spoilage, and to units in ending work in process using
the weighted-average method.
SOLUTION EXHIBIT 18-24