14-31
3. Dropping customers should be the last resort taken by Spring Distribution. Factors to
consider include the following:
a. What is the expected future profitability of each customer? Are the currently
month?
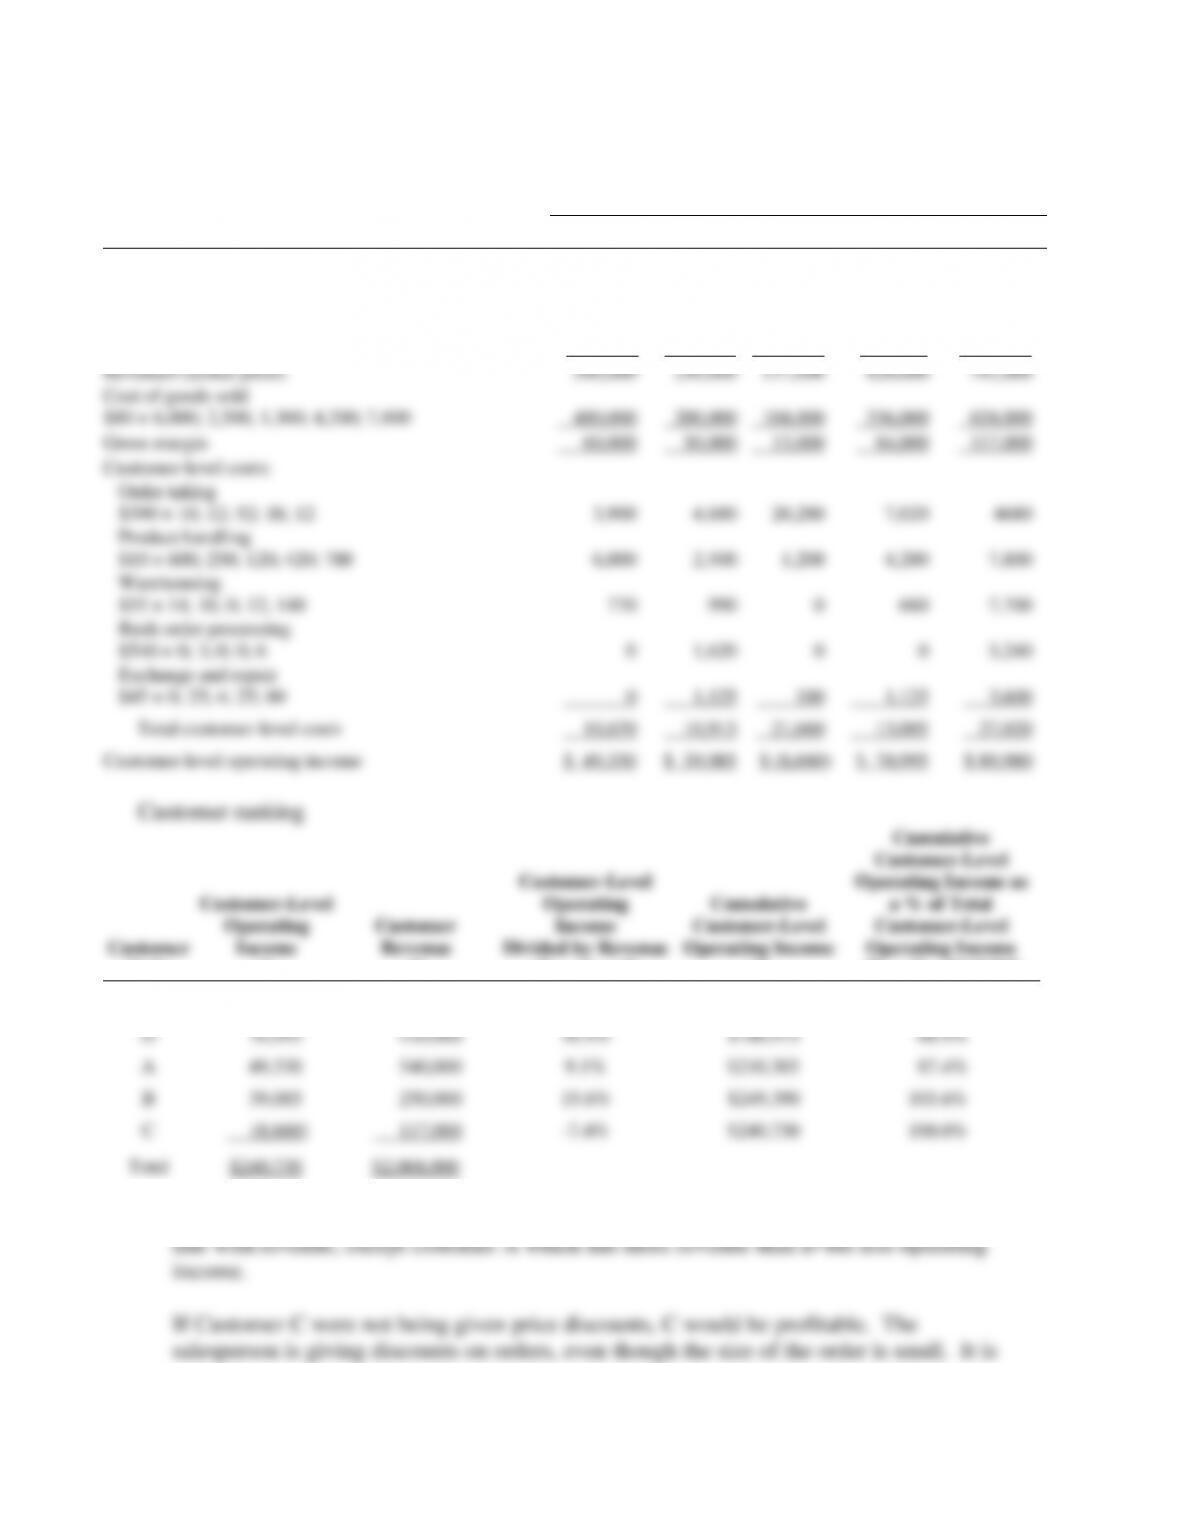
14-31 Customer profitability in a manufacturing firm.
1. Calculation of customer profitability by customer:
Customer
A
B
C
D
E
Revenues at list price
$100 × 6,000; 2,500; 1,300; 4,200; 7,800
$600,000
$250,000
$130,000
$420,000
$780,000
Price discount
10% × $600,000; 0; 10% × $130,000; 0; 10% × $390,000
60,000
0
13,000
0
39,000
Revenues (actual price)
540,000
250,000
117,000
420,000
741,000
Cost of goods sold
$80 × 6,000; 2,500, 1,300; 4,200; 7,800
480,000
200,000
104,000
336,000
624,000
Gross margin
60,000
50,000
13,000
84,000
117,000
Customer-level costs:
Order taking
$390 × 10; 12; 52; 18; 12
3,900
4,680
20,280
7,020
4680
Product handling
$10 × 600; 250; 120; 420; 780
6,000
2,500
1,200
4,200
7,800
Warehousing
$55 × 14; 18; 0; 12; 140
770
990
0
660
7,700
Rush order processing
$540 × 0; 3; 0; 0; 6
0
1,620
0
0
3,240
Exchange and repair
$45 × 0; 25; 4; 25; 80
0
1,125
180
1,125
3,600
Total customer-level costs
10,670
10,915
21,660
13,005
27,020
Customer-level operating income
$ 49,330
$ 39,085
$ (8,660)
$ 70,995
$ 89,980
Total
14-33
costing Bizzan money to process many small orders as opposed to a few large orders. To
turn Customer C into a profitable customer, Bizzan needs to encourage Customer C to
place fewer, larger orders and offer a price discount only if Customer C changes
behavior, rather than as a reward for repeat business.
service.
14-34
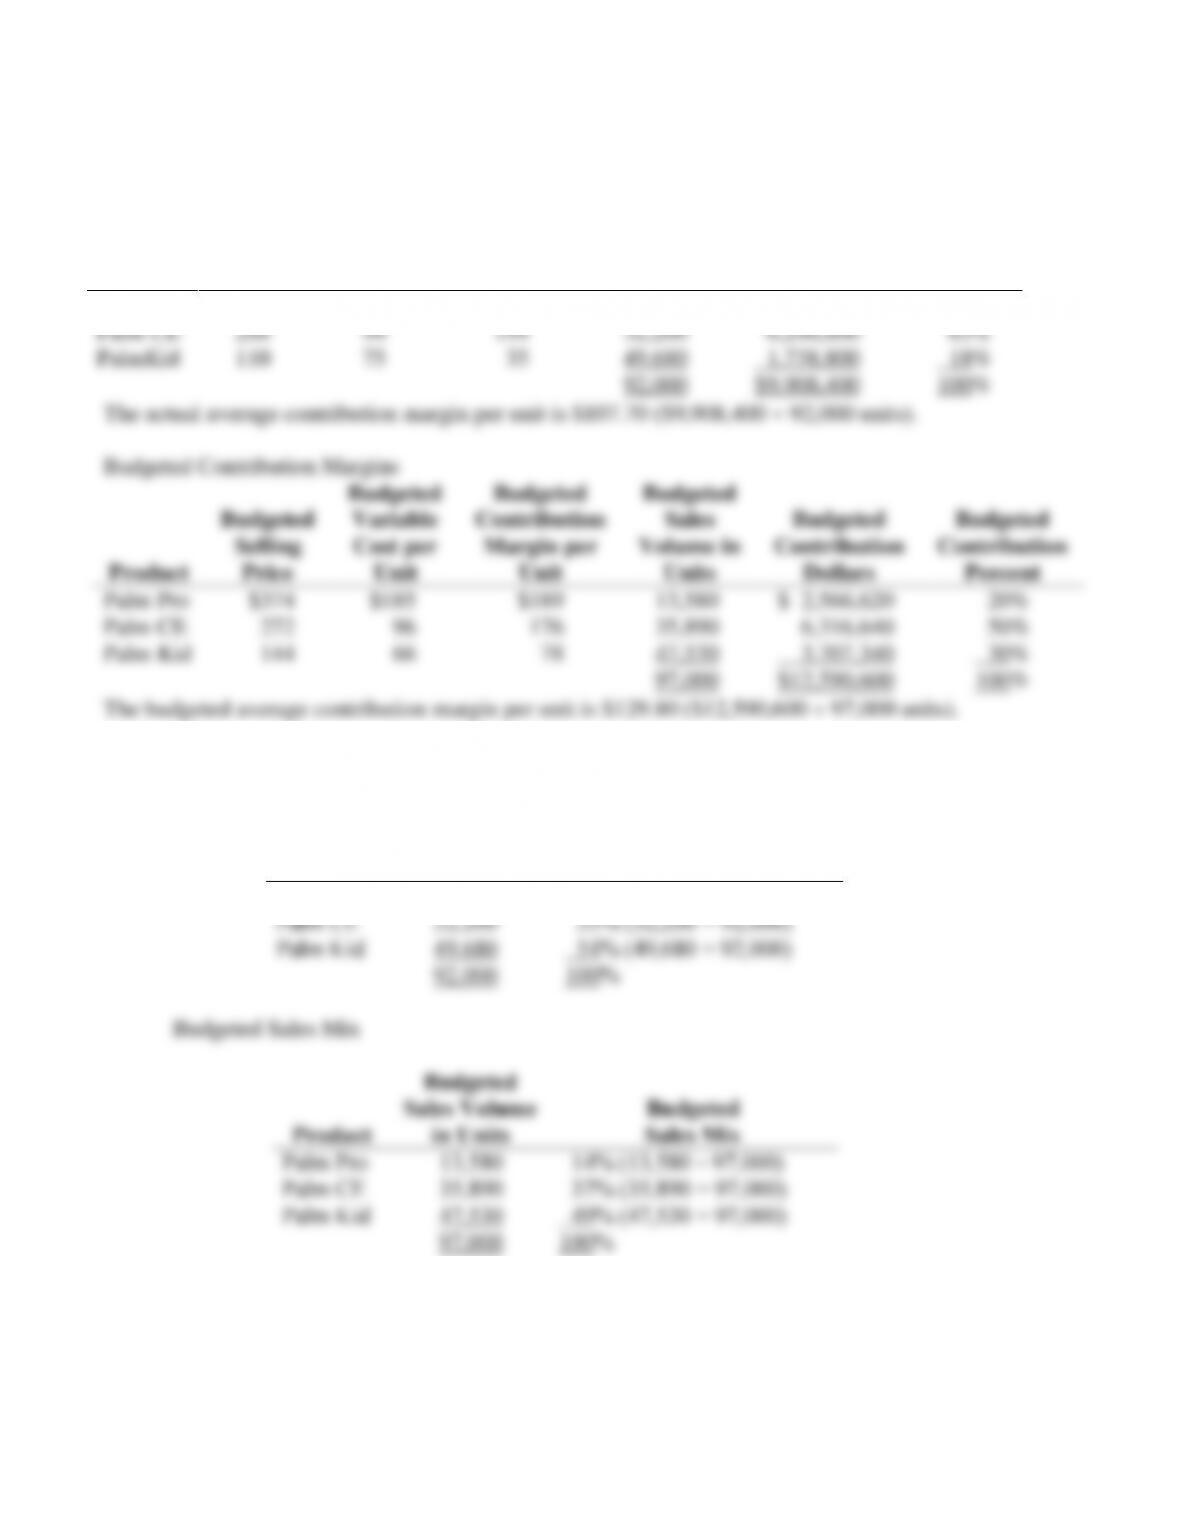
14-32 (60 min.) Variance analysis, sales-mix and sales-quantity variances.
1. Actual Contribution Margins
Product
Actual
Selling
Price
Actual
Variable
Cost per
Unit
Actual
Contribution
Margin per
Unit
Actual
Sales
Volume in
Units
Actual
Contribution
Dollars
Actual
Contribution
Percent
Palm Pro
$365
$175
$190
10,120
$1,922,800
19%
Palm CE
288
94
194
32,200
6,246,800
63%
PalmKid
110
75
35
49,680
1,738,800
18%
92,000
$9,908,400
100%
The actual average contribution margin per unit is $107.70 ($9,908,400 92,000 units).
Budgeted Contribution Margins
Product
Budgeted
Selling
Price
Budgeted
Variable
Cost per
Unit
Budgeted
Contribution
Margin per
Unit
Budgeted
Sales
Volume in
Units
Budgeted
Contribution
Dollars
Budgeted
Contribution
Percent
Palm Pro
$374
$185
$189
13,580
$ 2,566,620
20%
Palm CE
272
96
176
35,890
6,316,640
50%
Palm Kid
144
66
78
47,530
3,707,340
30%
97,000
$12,590,600
100%
The budgeted average contribution margin per unit is $129.80 ($12,590,600 97,000 units).
2. Actual Sales Mix
Product
Actual
Sales Volume
in Units
Actual
Sales Mix
Palm Pro
10,120
11% (10,120 ÷ 92,000)
Palm CE
32,200
35% (32,200 ÷ 92,000)
Palm Kid
49,680
54% (49,680 ÷ 92,000)
92,000
100%
Budgeted Sales Mix
Product
Budgeted
Sales Volume
in Units
Budgeted
Sales Mix
Palm Pro
13,580
14% (13,580 ÷ 97,000)
Palm CE
35,890
37% (35,890 ÷ 97,000)
Palm Kid
47,530
49% (47,530 ÷ 97,000)
97,000
100%
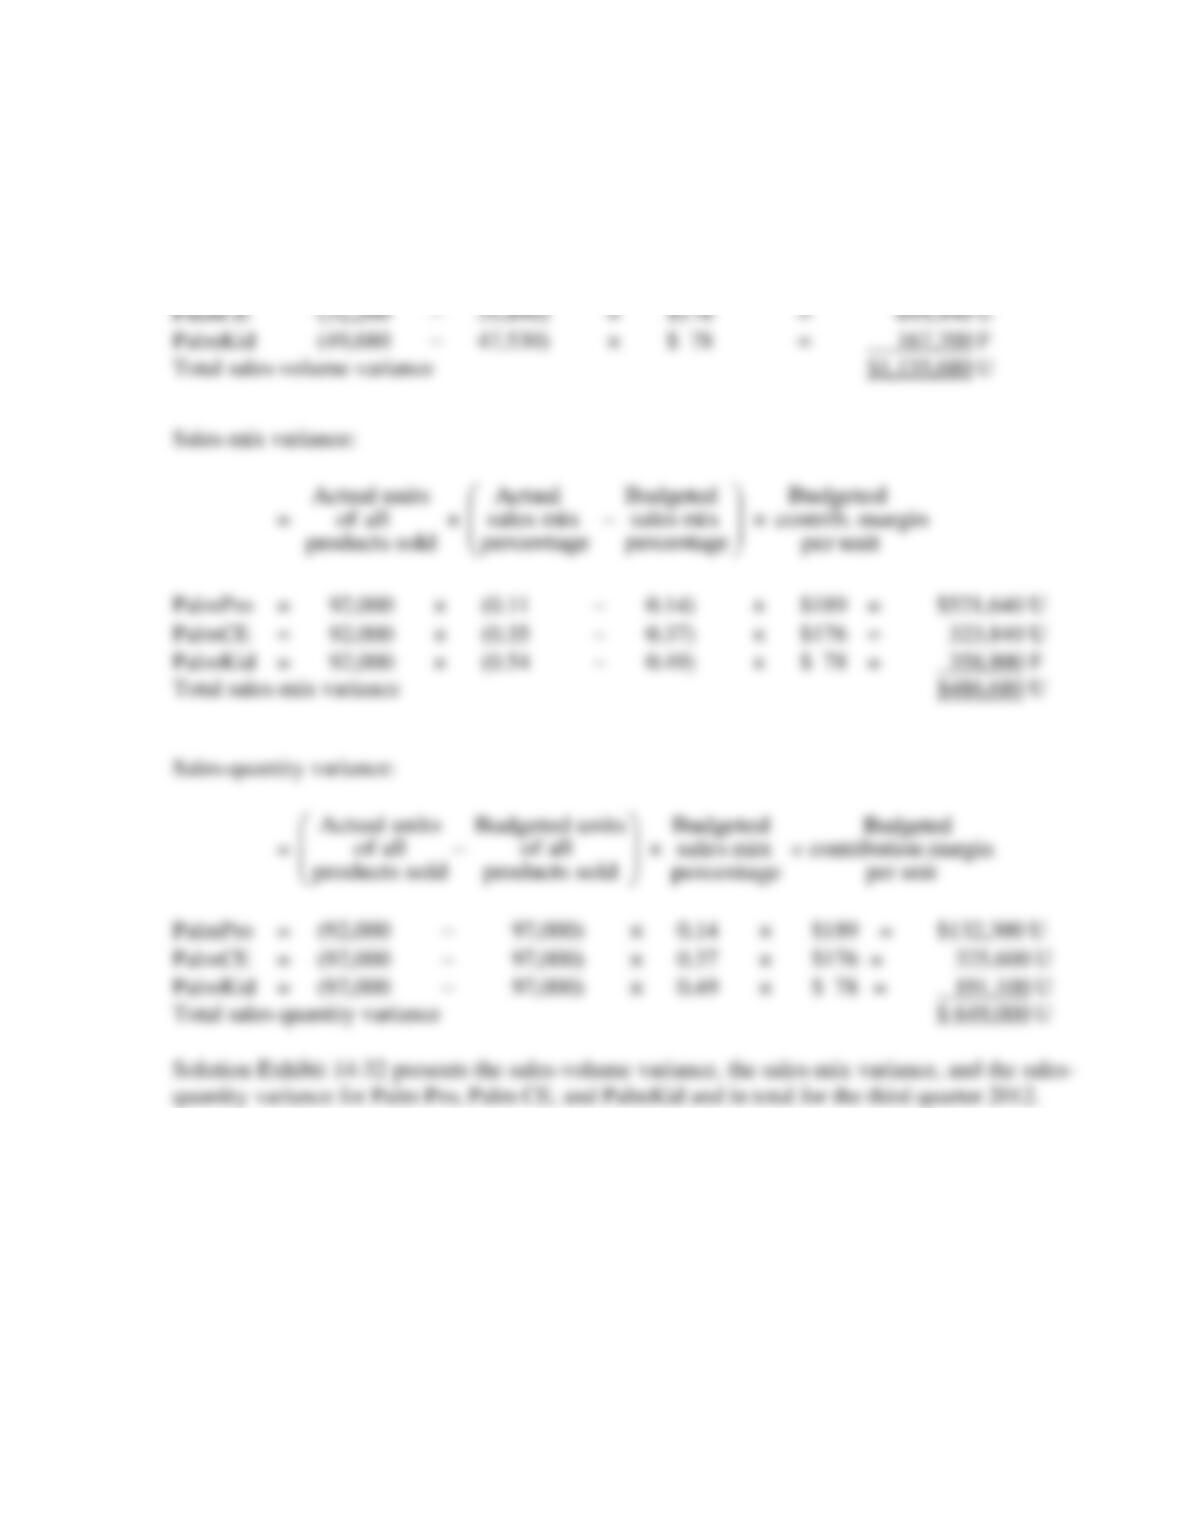
3. Sales-volume variance:
=
Actual Budgeted
quantity of quantity of
units sold units sold
−
Budgeted
contribution margin
per unit
PalmPro (10,120 − 13,580) × $189 = $ 653,940 U
contribution margin
per unit
14-36
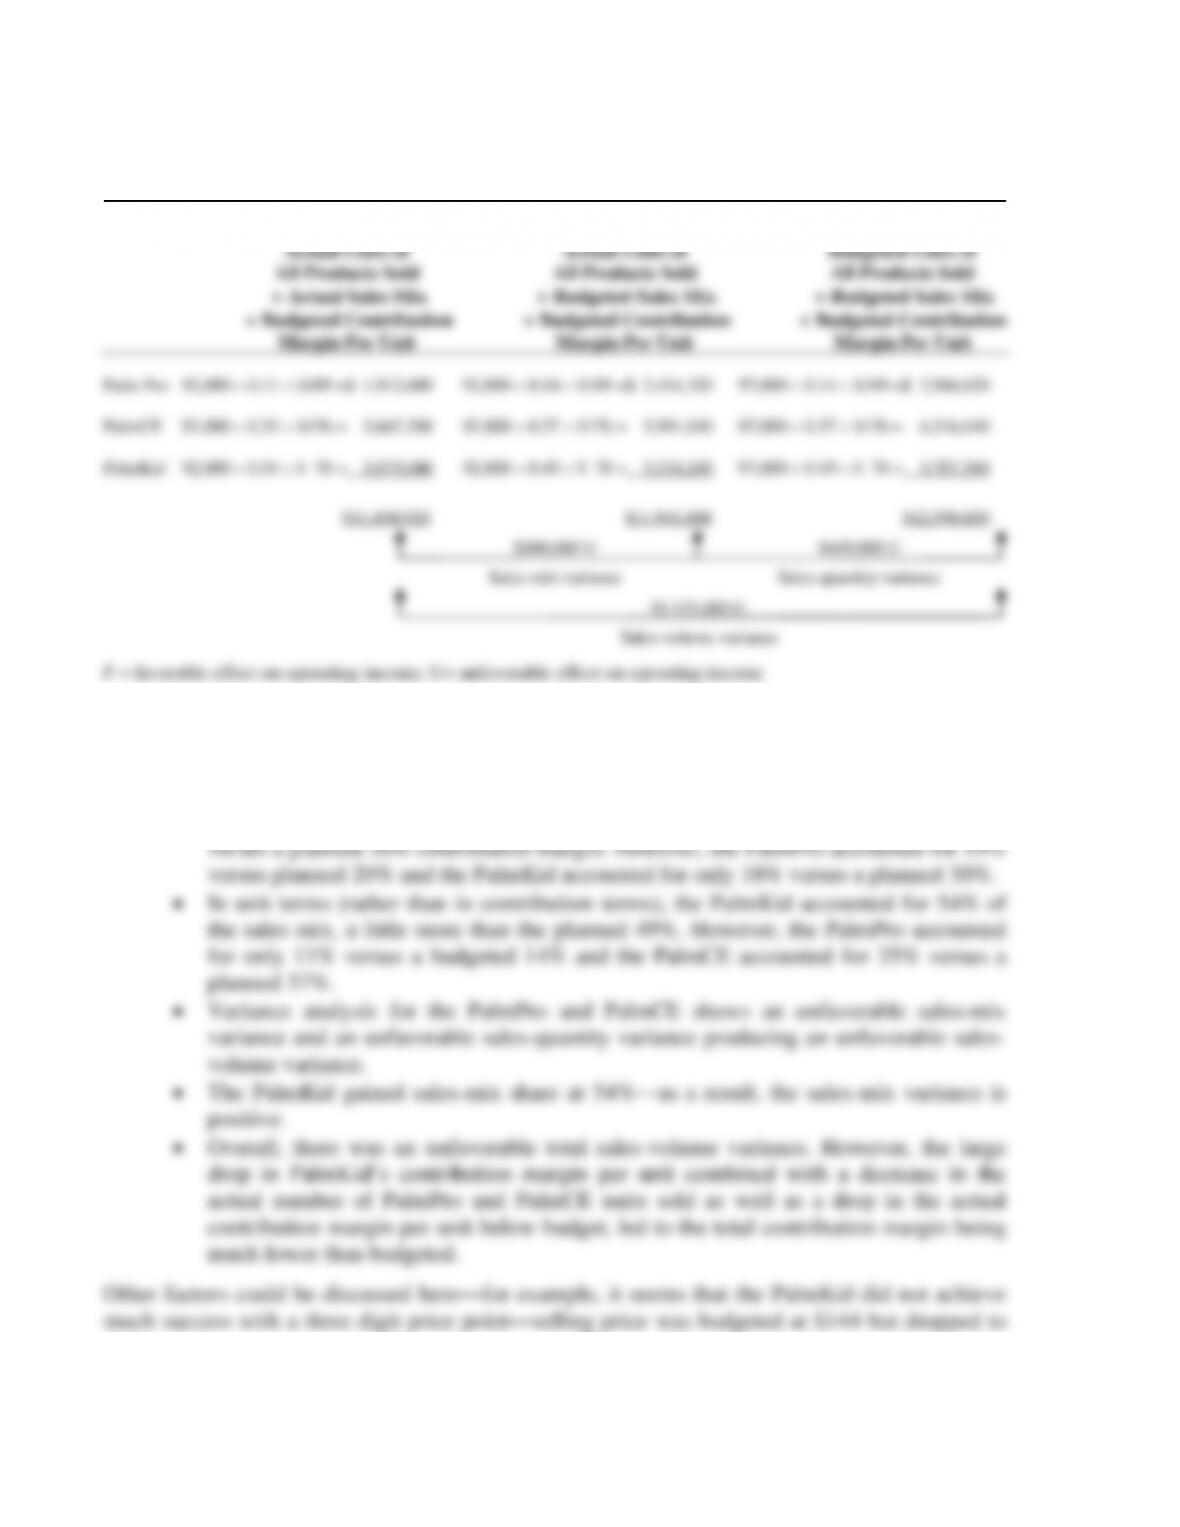
SOLUTION EXHIBIT 14-32
Sales-Mix and Sales-Quantity Variance Analysis of Chicago Infonautics for the Third
Quarter 2012.
Flexible Budget: Static Budget:
4. The following factors help explain the difference between actual and budgeted amounts:
• The difference in actual versus budgeted contribution margins was $2,682,200
unfavorable ($9,908,400 − $12,590,600). The contribution margins from PalmCE,
PalmPro and the PalmKid were lower than expected.
• In percentage terms, the PalmCE accounted for 63% of actual contribution margin
$110. At the same time, variable costs increased. This could have been due to a marketing push
that did not succeed.
14-33 (20 min.) Market-share and market-size variances (continuation of 14-32).
1.
Actual
Budgeted
Worldwide
400,000
388,000
Chicago Info.
92,000
97,000
Market share
23%
25%
Average contribution margin per unit:
Actual = $107.70 ($9,908,400 92,000)
400,000 (0.23 – 0.25) $129.80
400,000 (–0.02) $129.80
=
$1,038,400 U
12,000 0.25 $129.80
=
$389,400 F
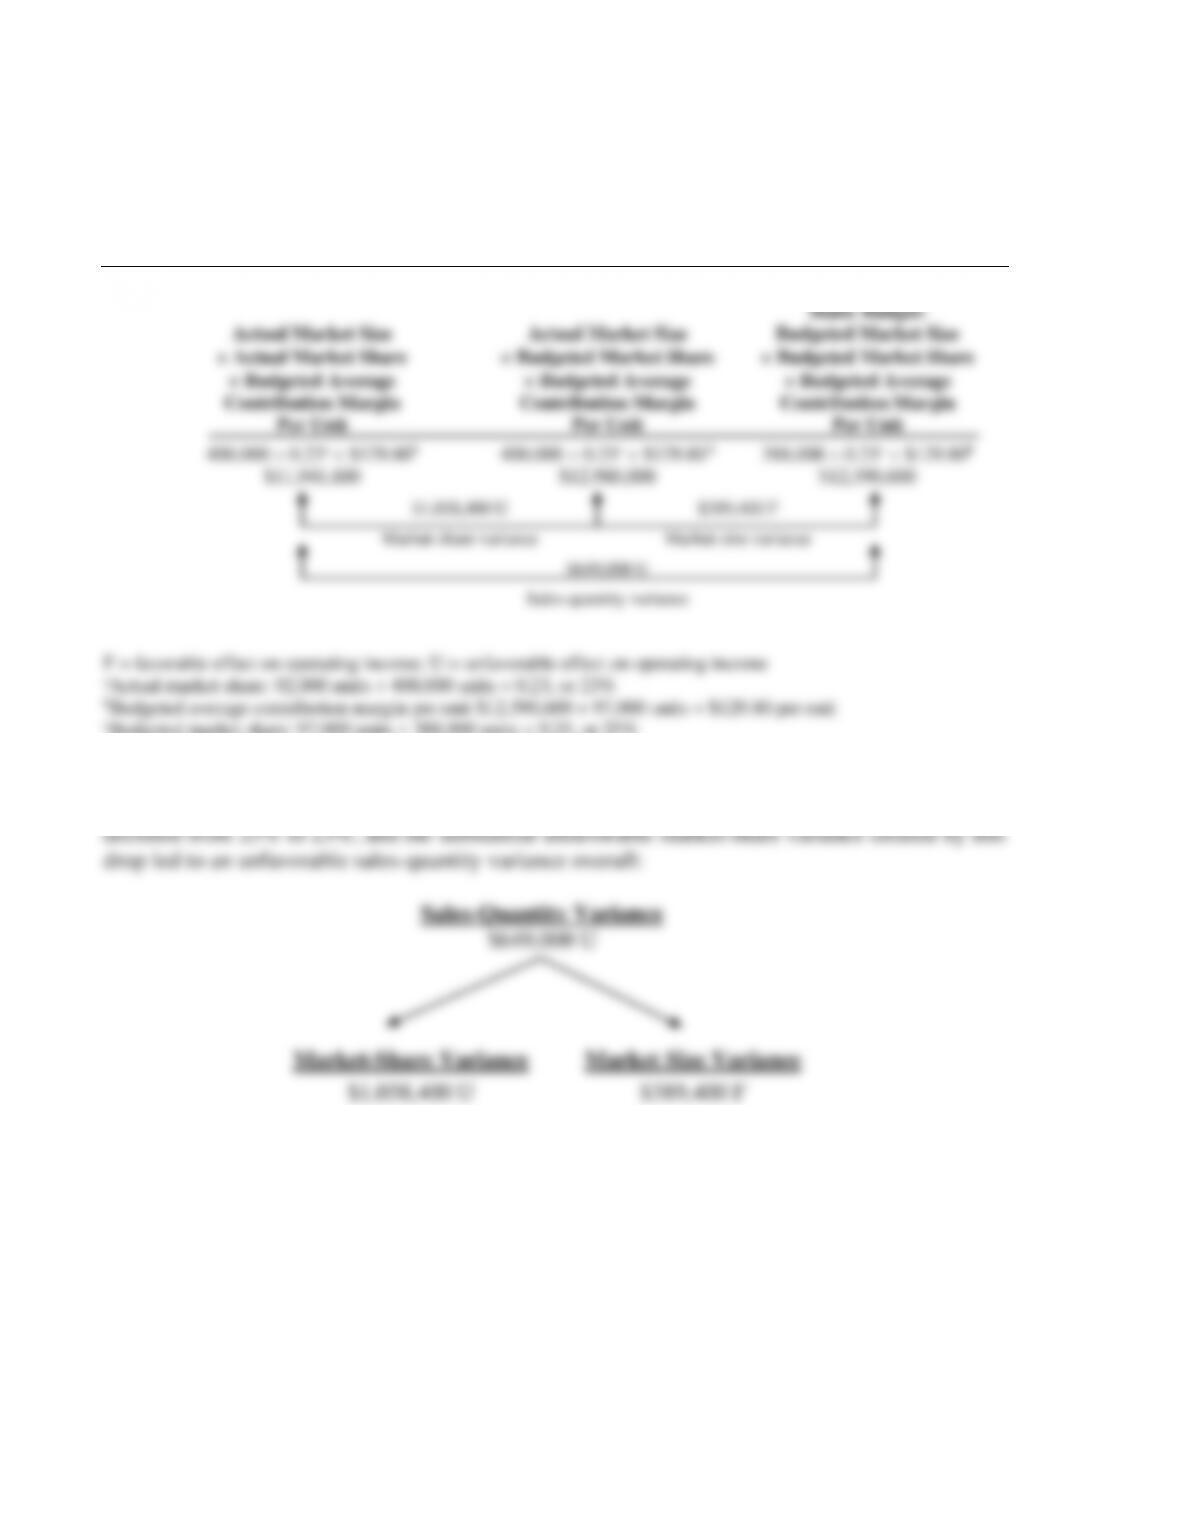
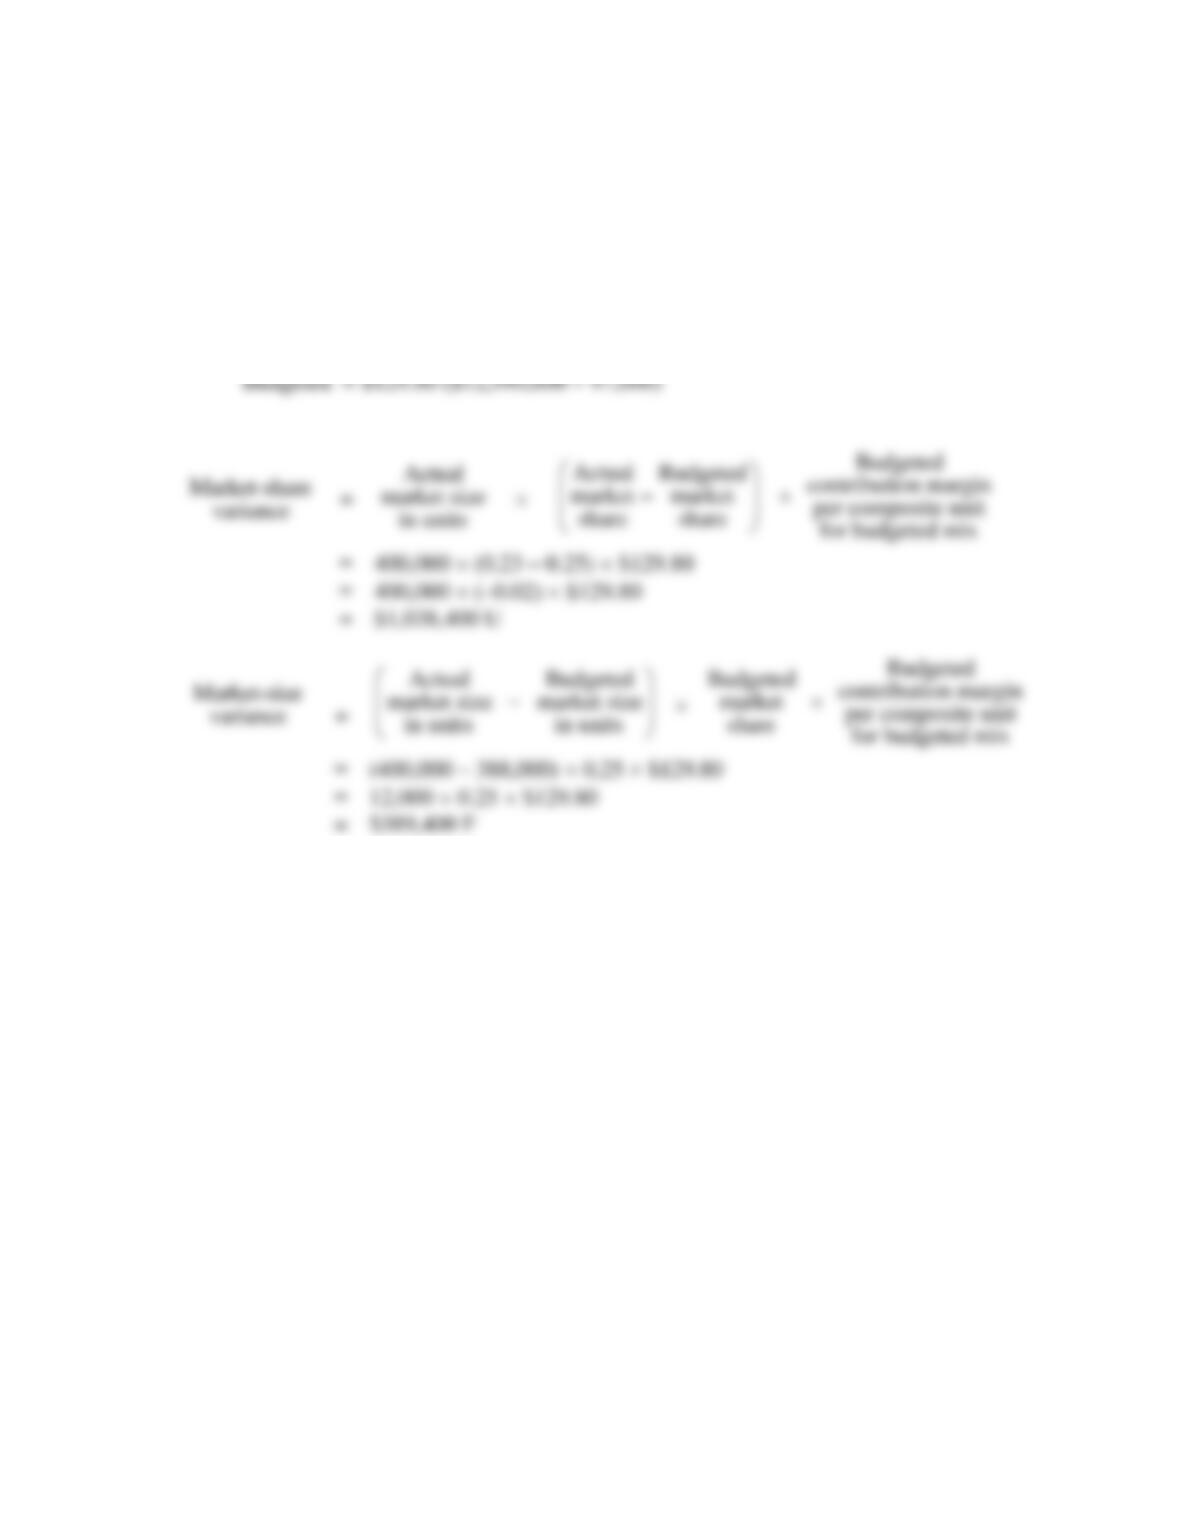
Solution Exhibit 14-33 presents the market-share variance, the market-size variance, and the
sales-quantity variance for the third quarter 2012.
SOLUTION EXHIBIT 14-33
Market-Share and Market-Size Variance Analysis of Chicago Infonautics for the Third
Quarter 2012.
2. The actual market size of 400,000 units exceeded the projected size of 388,000 units,
leading to a favorable market-size variance. However, Chicago Infonautics’ share of the market
14-39
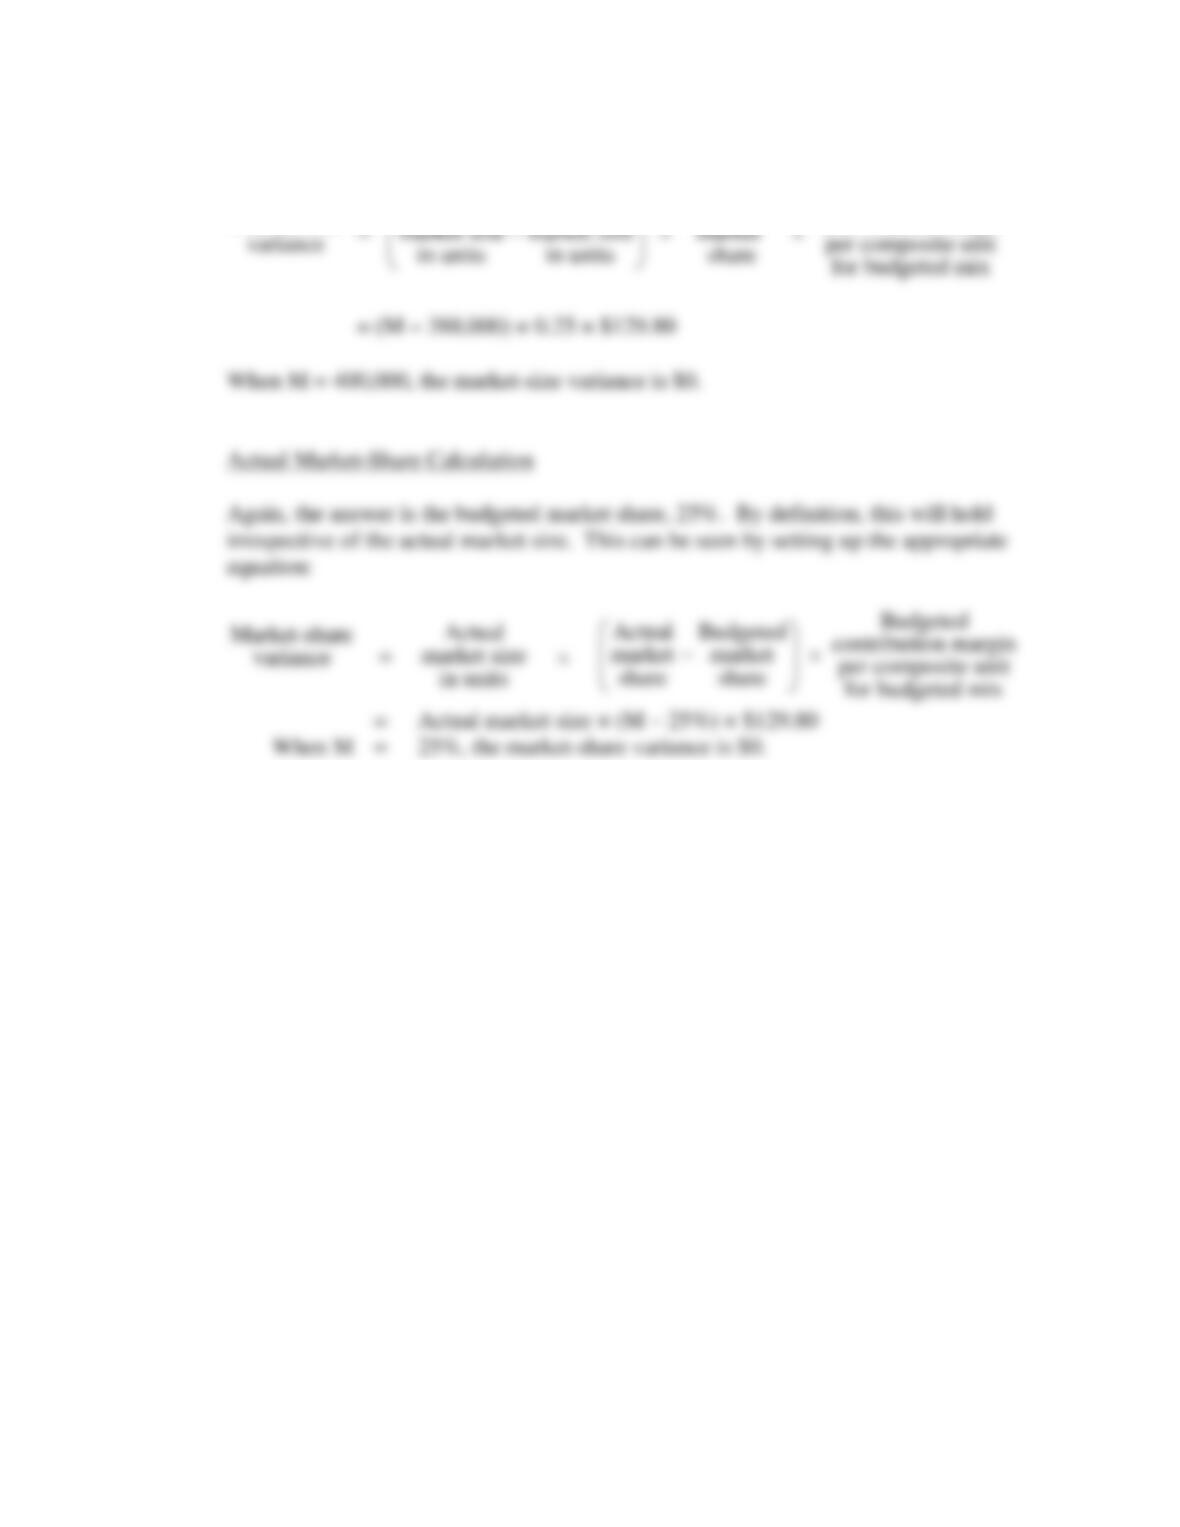
3. The required actual market size is the budgeted market size, i.e., 388,000 units. This can
easily be seen by setting up the following equation:
Budgeted
Actual Budgeted Budgeted
Market-size contribution margin
market size market size market per composite unit
variance in units in units share for budgeted mix
= −
= (M – 388,000) × 0.25 × $129.80
When M = 400,000, the market-size variance is $0.
Actual Market-Share Calculation
Again, the answer is the budgeted market share, 25%. By definition, this will hold
irrespective of the actual market size. This can be seen by setting up the appropriate
equation:
Market-share
variance
=
Actual
market size
in units
Budgeted
Actual Budgeted contribution margin
market market per composite unit
share share for budgeted mix
−
=
Actual market size × (M – 25%) × $129.80
When M
=
25%, the market-share variance is $0.
14-34 (40 min.) Variance analysis, multiple products.
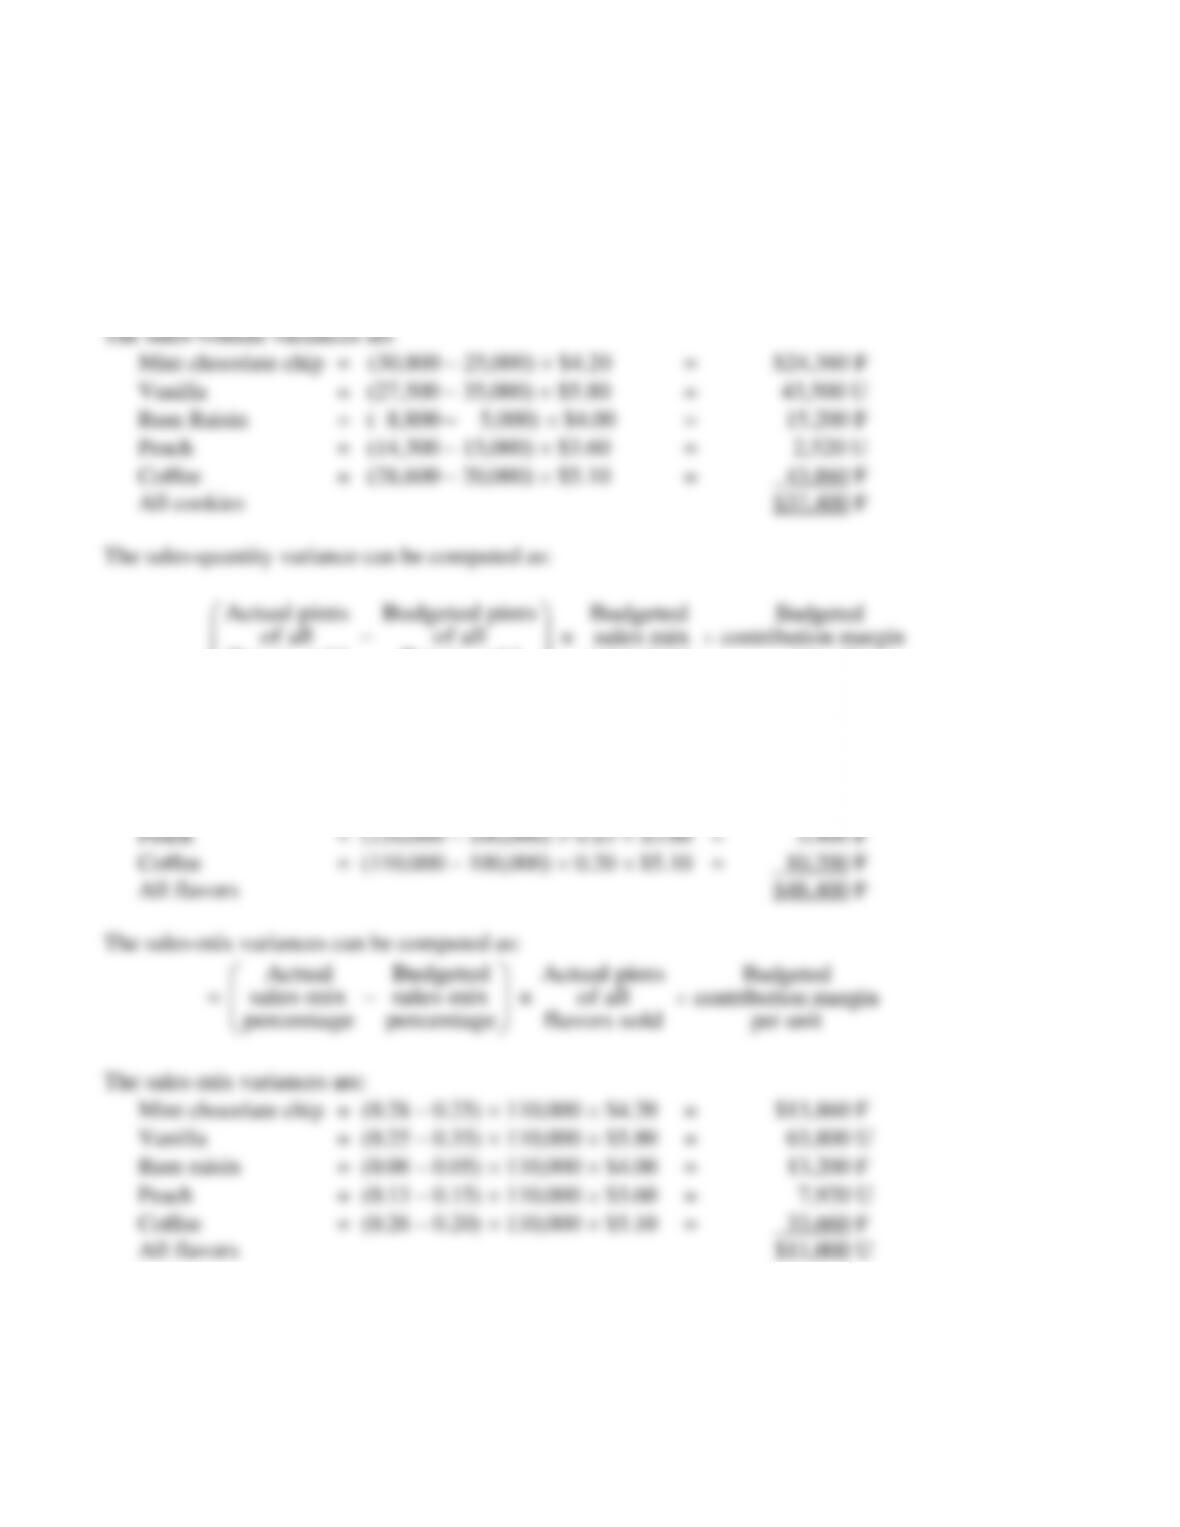
1, 2, and 3. Solution Exhibit 14-34 presents the sales-volume, sales-quantity, and sales-mix
variances for each flavor of gelato and in total for The Split Banana, Inc., in August 2011.
The sales-volume variances can also be computed as:
(Actual pints sold – Budgeted pints sold) × Budgeted contribution margin per unit