14-21
14-25 (60 min.) Variance analysis, multiple products.
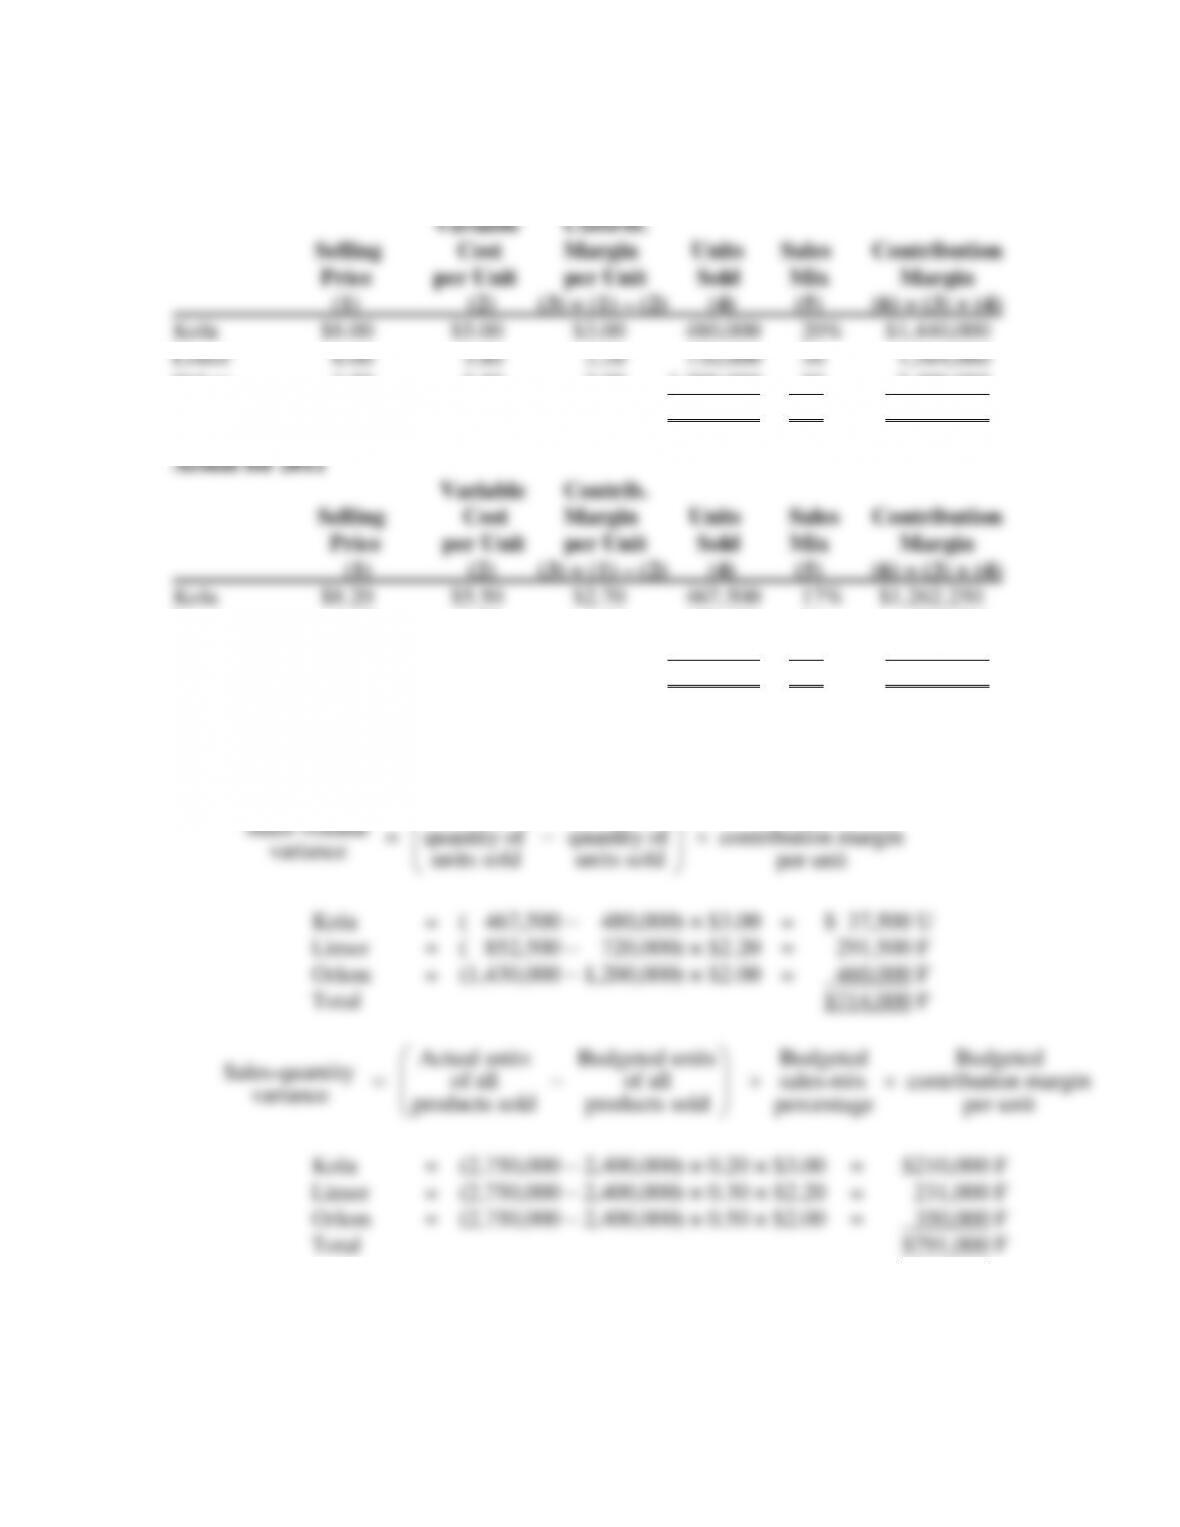
1. Budget for 2011
Orlem 7.50 5.50 2.00 1,200,000 50 2,400,000
Total 2,400,000 100% $5,424,000
Limor 5.75 3.75 2.00 852,500 31 1,705,000
Orlem 7.80 5.60 2.20 1,430,000 52 3,146,000
Total 2,750,000 100% $6,113,250
Solution Exhibit 14-25 presents the sales-volume, sales-quantity, and sales-mix variances for
each product and in total for 2011.
Sales-volume
variance
=
Actual Budgeted
quantity of quantity of
units sold units sold
−
Budgeted
contribution margin
per unit
Kola = ( 467,500 – 480,000) × $3.00 = $ 37,500 U
Limor = ( 852,500 – 720,000) × $2.20 = 291,500 F
Orlem = (1,430,000 – 1,200,000) × $2.00 = 460,000 F
Total $714,000 F
Sales-quantity
variance
Actual units Budgeted units
of all of all
products sold products sold
= −
Budgeted
sales-mix
percentage
Budgeted
contribution margin
per unit
Kola = (2,750,000 – 2,400,000) × 0.20 × $3.00 = $210,000 F
Limor = (2,750,000 – 2,400,000) × 0.30 × $2.20 = 231,000 F
Orlem = (2,750,000 – 2,400,000) × 0.50 × $2.00 = 350,000 F
Total $791,000 F
14-22
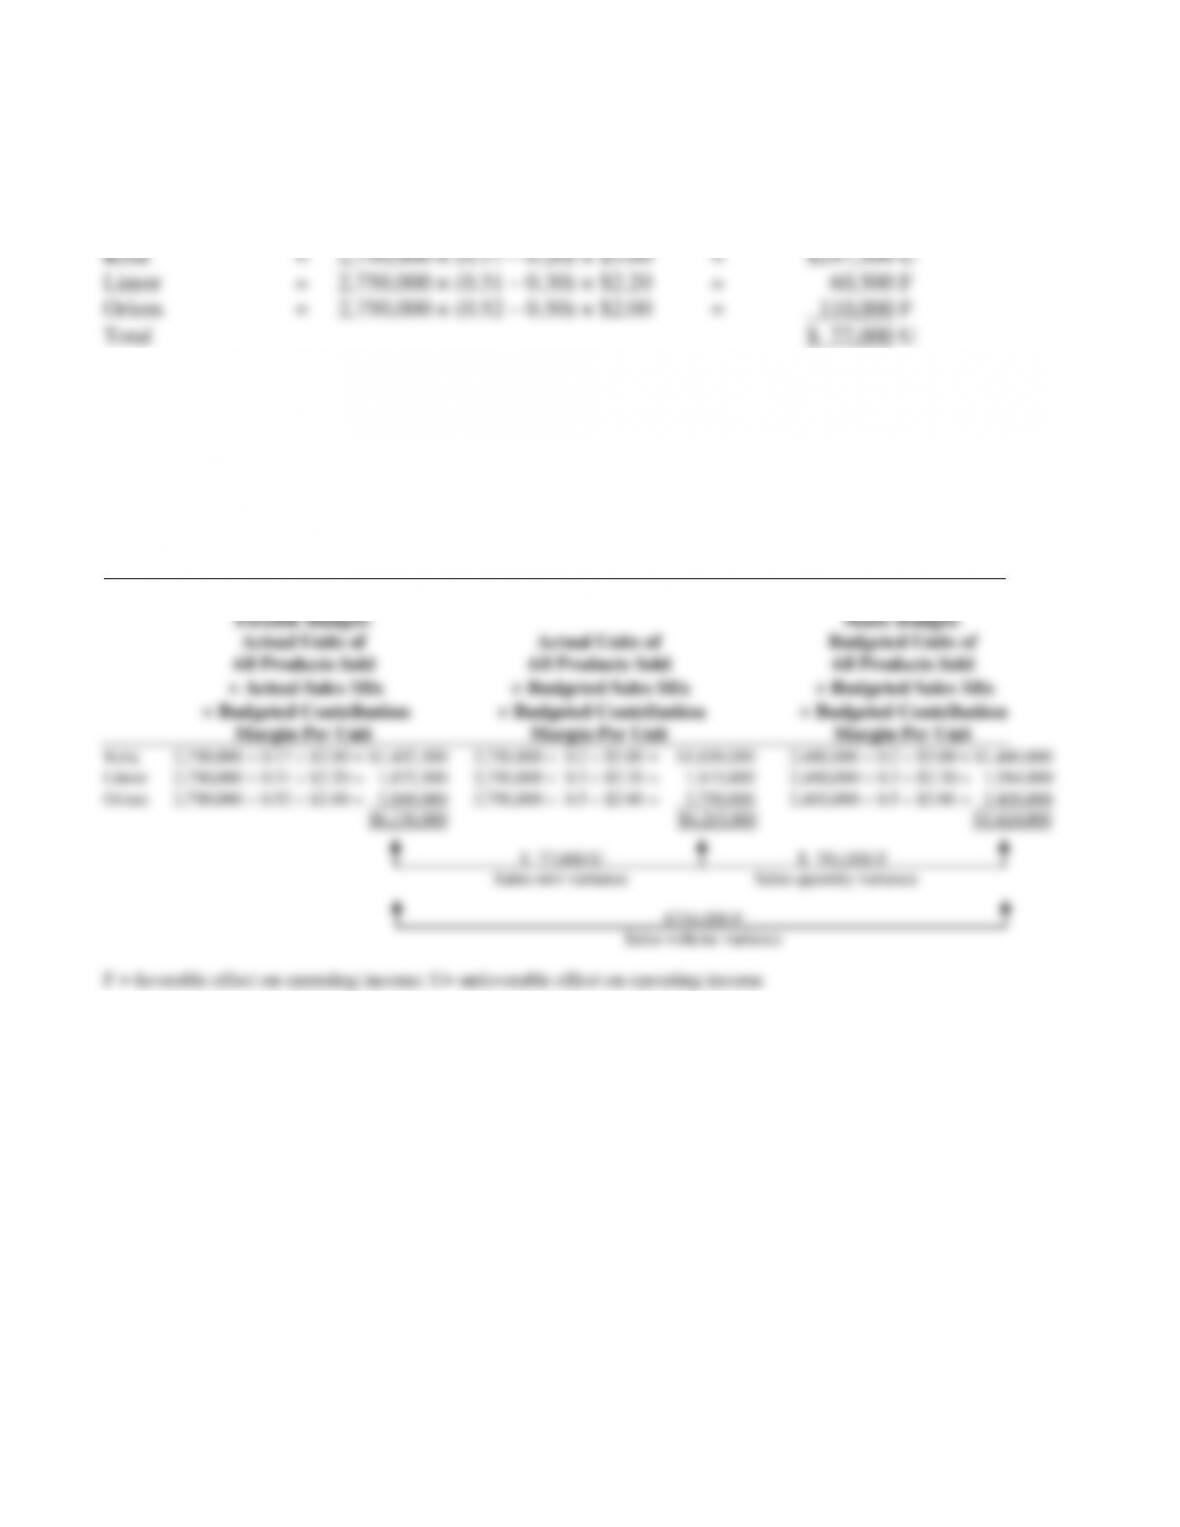
Sales-mix
variance
=
Actual units of
all products
sold
Actual
sales-mix
percentage
–
Budgeted
sales-mix
percentage
Budgeted
contribution margin
per unit
2. The breakdown of the favorable sales-volume variance of $714,000 shows that the biggest
contributor is the 350,000 unit increase in sales resulting in a favorable sales-quantity variance of
$791,000. There is a partially offsetting unfavorable sales-mix variance of $77,000 in contribution
margin.
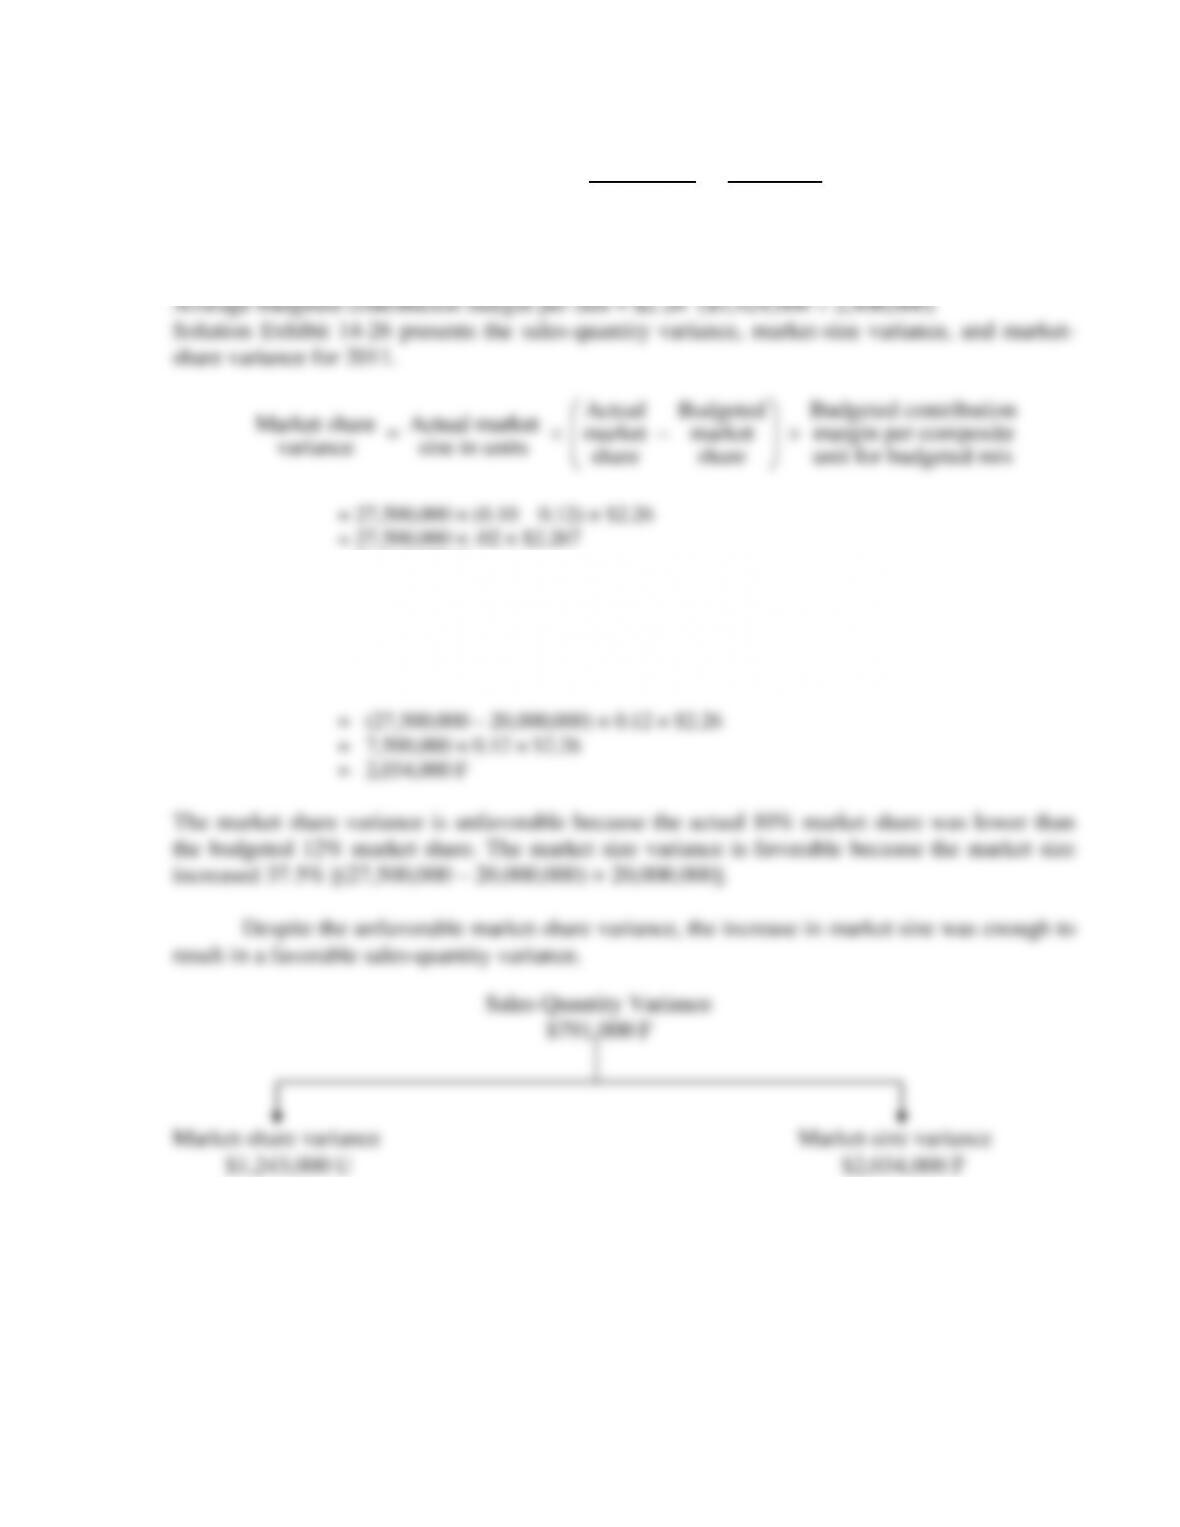
SOLUTION EXHIBIT 14-25
Sales-Mix and Sales-Quantity Variance Analysis of Soda King for 2011
14-23
14-26 (20 min.) Market-share and market-size variances (continuation of 14-25).
Actual Budgeted
Western region 27.5 million 20 million
Soda King 2.75 million 2.4 million
Market share 10% 12%
= $1,243,000 U
Market-size
variance
=
Actual
market size
in units
–
Budgeted
market size
in units
Budgeted
market
share
Budgeted contribution
margin per composite
unit for budgeted mix
14-24
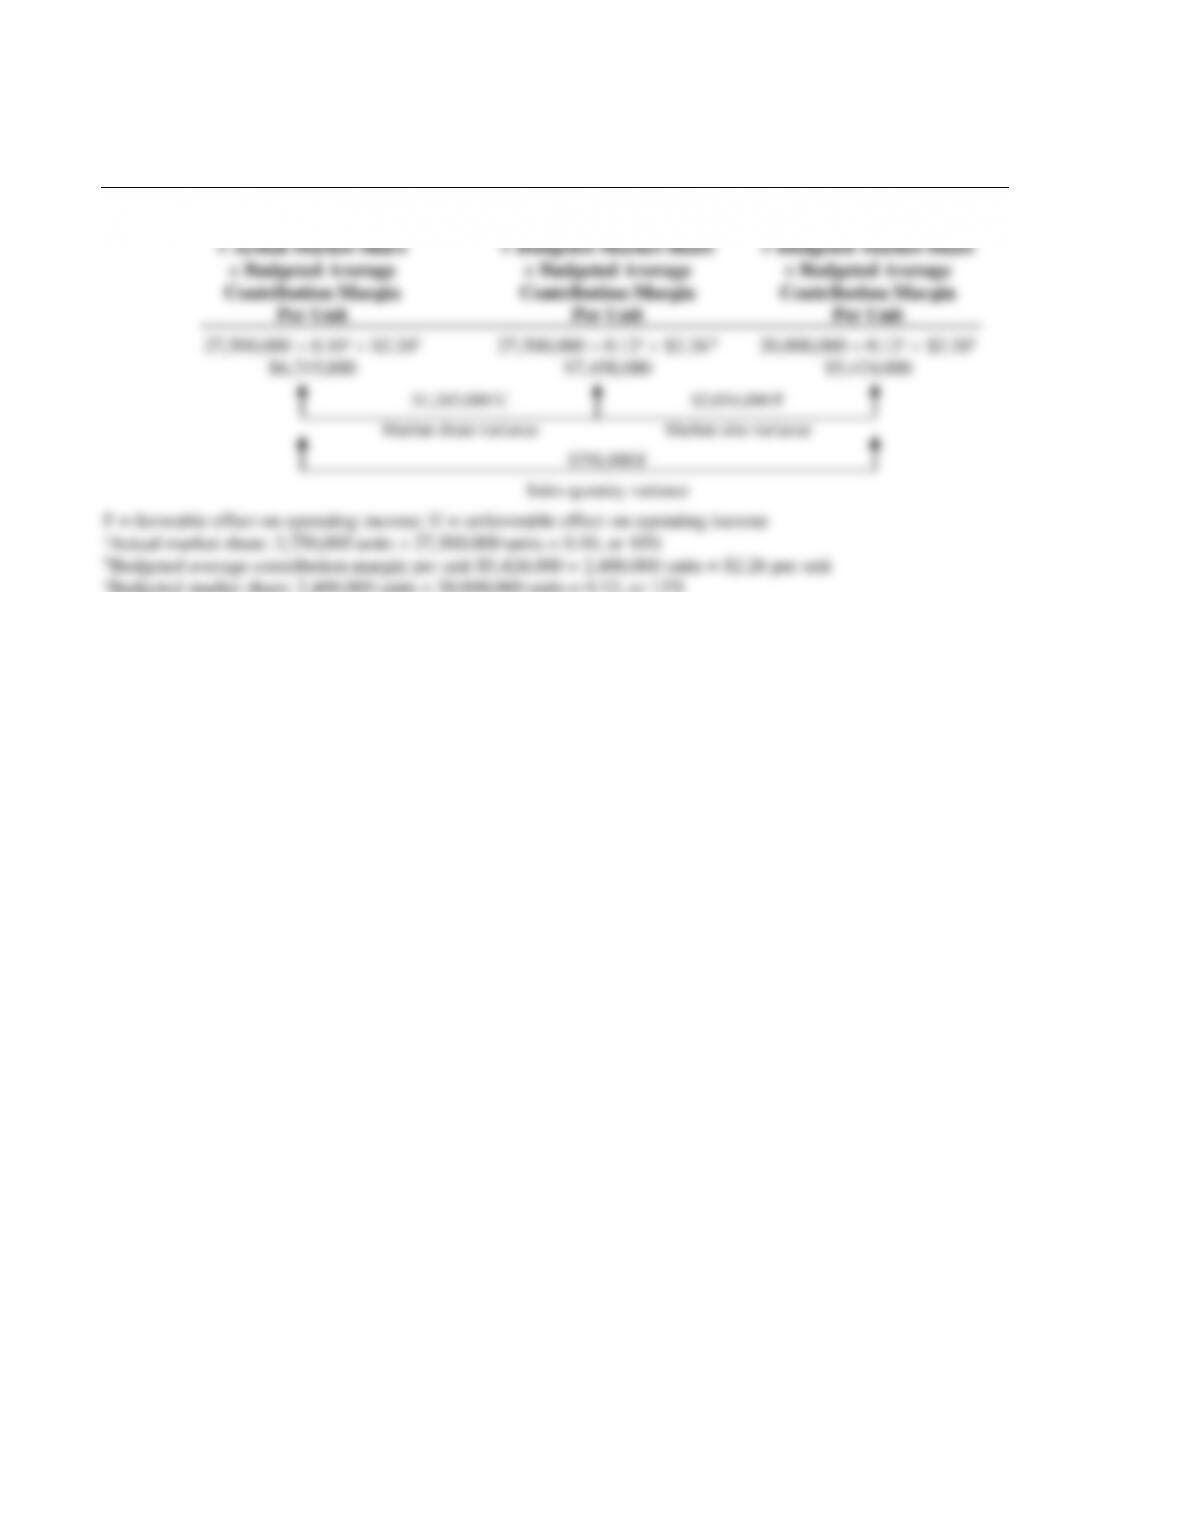
SOLUTION EXHIBIT 14-26
Market-Share and Market-Size Variance Analysis of Soda King for 2011
Static Budget:
Actual Market Size Actual Market Size Budgeted Market Size
14-25
1. The purposes for allocating central corporate costs to each division include the following
(students may pick and discuss any two):
a. To provide information for economic decisions. Allocations can signal to division
managers that decisions to expand (contract) activities will likely require increases
(decreases) in corporate costs that should be considered in the initial decision about
2.
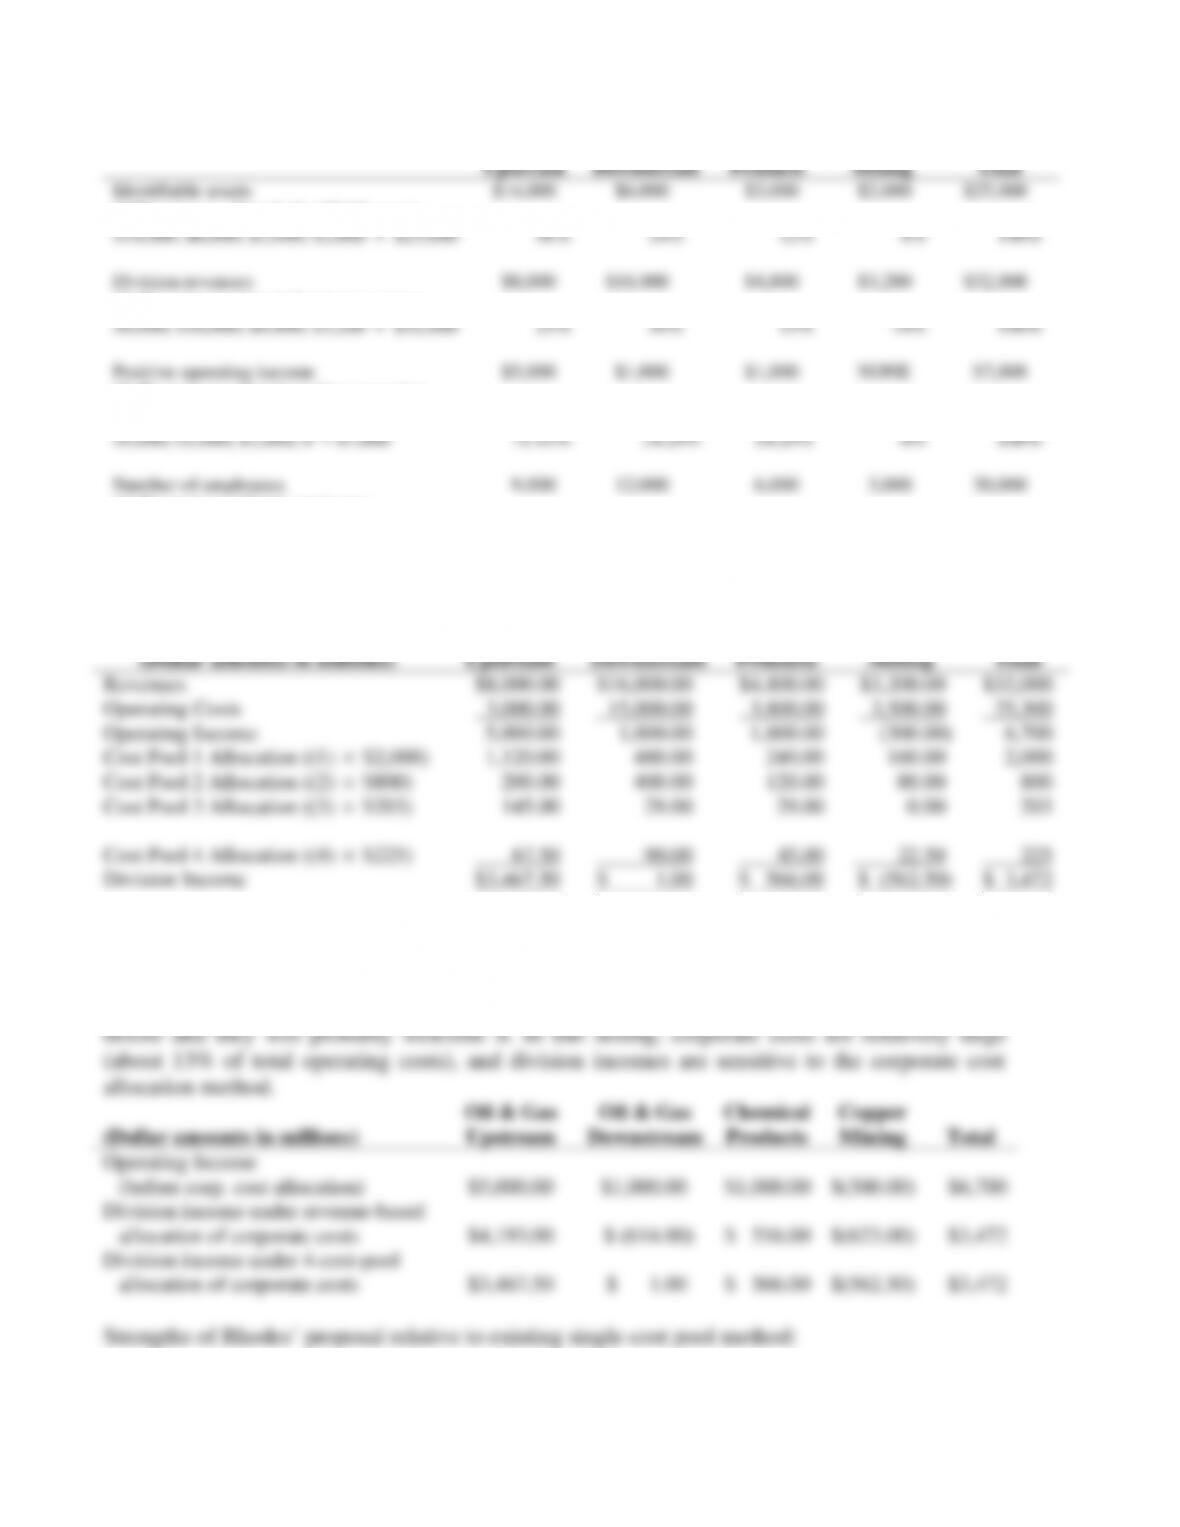
Oil & Gas
Upstream
Oil & Gas
Downstream
Chemical
Products
Copper
Mining
Total
Revenues
$8,000
$16,000
$4,800
$3,200
$32,000
Percentage of revenues
$8,000; $16,000; $4,800; $3,200
$32,000
25%
50%
15%
10%
100%
(Dollar amounts in millions)
Oil & Gas
Upstream
Oil & Gas
Downstream
Chemical
Products
Copper
Mining
Total
Revenues
$8,000
$16,000
$4,800
$3,200
$32,000
Operating costs
3,000
15,000
3,800
3,500
25,300
Operating income
5,000
1,000
1,000
(300)
6,700
Corp. costs allocated on revenues
(% of revs
$3,228)
807
,614
484
323
3,228
Division operating income
$4,193
$ (614)
$ 516
$ (623)
$ 3,472
14-26
3. First, calculate the share of each allocation base for each of the four corporate cost pools:
Oil & Gas
Upstream
Oil & Gas
Downstream
Chemical
Products
Copper
Mining
Total
Identifiable assets
$14,000
$6,000
$3,000
$2,000
$25,000
(1)Percentage of total identifiable assets
$14,000; $6,000; $3,000; $2,000
$25,000
56%
24%
12%
8%
100%
Division revenues
$8,000
$16,000
$4,800
$3,200
$32,000
(2) Percentage of total division revenues
$8,000; $16,000; $4,800; $3,200
$32,000
25%
50%
15%
10%
100%
Positive operating income
$5,000
$1,000
$1,000
NONE
$7,000
(3) Percentage of total positive operating
income
$5,000; $1,000; $1,000; 0
$7,000
71.43%
14.29%
14.29%
0%
100%
Number of employees
9,000
12,000
6,000
3,000
30,000
(4) Percentage of total employees
9,000; 12,000; 6,000; 3,000
30,000
30%
40%
20%
10%
100%
Using these allocation percentages and the allocation bases suggested by Rhodes, we can allocate the $3,228 M of
corporate costs as shown below. Note that the costs in Cost Pool 2 total $800 M ($150 + $110 + $200 + $140 + $200).
(Dollar amounts in millions)
Oil & Gas
Upstream
Oil & Gas
Downstream
Chemical
Products
Copper
Mining
Total
Revenues
$8,000.00
$16,000.00
$4,800.00
$3,200.00
$32,000
Operating Costs
3,000.00
15,000.00
3,800.00
3,500.00
25,300
Operating Income
5,000.00
1,000.00
1,000.00
(300.00)
6,700
Cost Pool 1 Allocation ((1)
$2,000)
1,120.00
480.00
240.00
160.00
2,000
Cost Pool 2 Allocation ((2)
$800)
200.00
400.00
120.00
80.00
800
Cost Pool 3 Allocation ((3)
$203)
145.00
29.00
29.00
0.00
203
Cost Pool 4 Allocation ((4)
$225)
67.50
90.00
45.00
22.50
225
Division Income
$3,467.50
$ 1.00
$ 566.00
$ (562.50)
$ 3,472
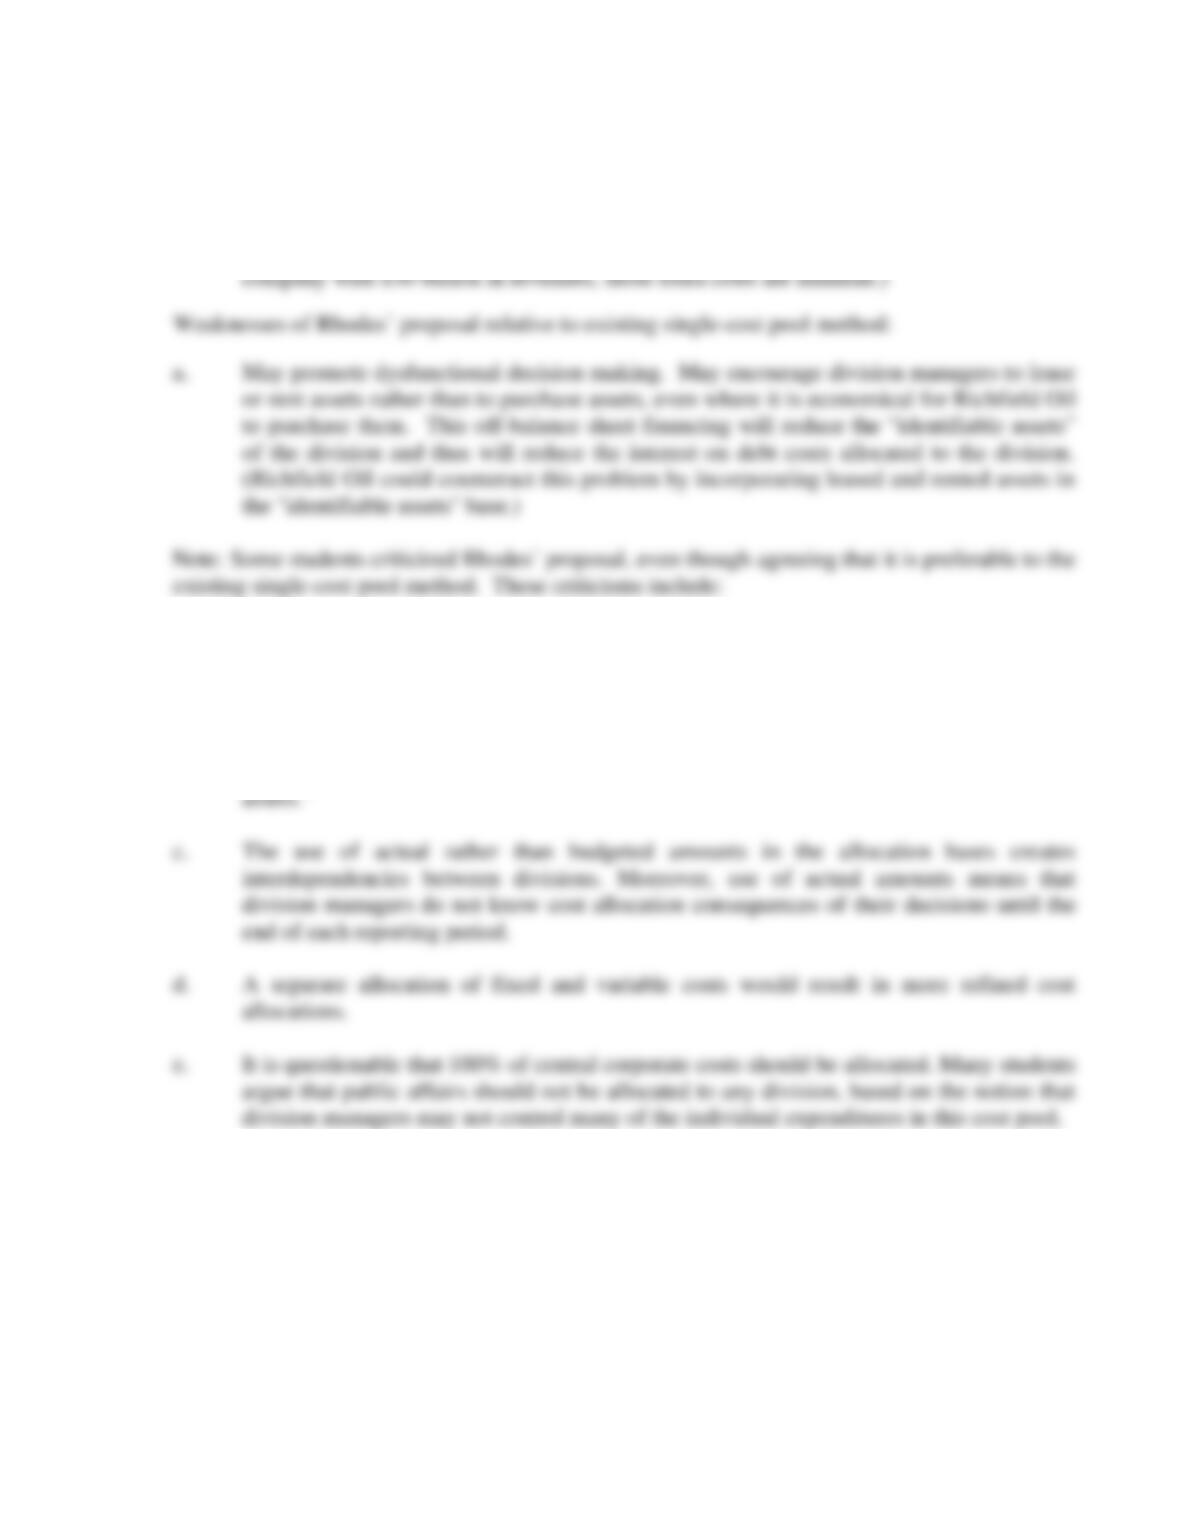
4. The table below compares the reported income of each division under the original
revenue-based allocation scheme and the new 4-pool-based allocation scheme. Oil & Gas
Upstream seems 17% less profitable than before ($3,467.5
$4,193 = 83%), and may resist the
new allocation, but each of the other divisions seem more profitable (or less loss-making) than
Upstream
Products
$5,000.00
$1,000.00
$(300.00)
$4,193.00
$ 516.00
$(623.00)
$3,467.50
$ 566.00
$(562.50)
14-27
a. Better able to capture cause-and-effect relationships. Interest on debt is more likely
caused by the financing of assets than by revenues. Personnel and payroll costs are more
likely caused by the number of employees than by revenues.
b. Relatively simple. No extra information need be collected beyond that already available.
(Some students will list the extra costs of Rhodes’ proposal as a weakness. However, for a
a. The proposal does not adequately capture cause-and-effect relationships for the legal and
research and development cost pools. For these cost pools, specific identification of
individual projects with an individual division can better capture cause-and-effect
relationships.
b. The proposal may give rise to disputes over the definition and valuation of “identifiable
14-28
14-28 Cost allocation to divisions.
1.
Bread
Cake
Doughnuts
Total
Segment margin
$6,400,000
$1,300,000
$6,150,000
$13,850,000
Allocated headquarter costs
($5,100,000 ÷ 3)
1,700,000
1,700,000
1,700,000
5,100,000
Operating income
$4,700,000
$ (400,000)
$4,450,000
$ 8,750,000
2.
Bread
Cake
Doughnuts
Total
Segment margin
$6,400,000
$1,300,000
$6,150,000
$13,850,000
Allocated headquarter costs,
Human resources1
(50%; 12.5%; 37.5% × $1,900,000)
950,000
237,500
712,500
1,900,000
Accounting department2
(53.9%; 11.6%; 34.5% × $1,400,000)
754,600
162,400
483,000
1,400,000
Rent and depreciation3
(50%; 20%; 30% × $1,200,000)
600,000
240,000
360,000
1,200,000
Other (
1$600,000
3
)
200,000
200,000
200,000
600,000
Total
2,504,600
839,900
1,755,500
5,100,000
Operating income
$3,895,400
$ 460,100
$4,394,500
$ 8,750,000
1HR costs: 400 ÷ 800 = 50%; 100 ÷ 800 = 12.5%; 300 ÷ 800 = 37.5%
2Accounting: $20,900,000 ÷ $38,800,000 = 53.9%; $4,500,000 ÷ $38,800,000 = 11.6%;
$13,400,000 ÷ $38,800,000 = 34.5%
3Rent and depreciation: 10,000 ÷ 20,000 = 50%; 4,000 ÷ 20,000 = 20%; 6,000 ÷ 20,000 = 30%
A cause-and-effect relationship may exist between Human Resources costs and the number of
employees at each division. Rent and depreciation costs may be related to square feet, except
that very expensive machines may require little square footage, which is inconsistent with this
choice of allocation base. The Accounting Department costs are probably related to the revenues
earned by each division – higher revenues mean more transactions and more accounting. Other
overhead costs are allocated arbitrarily.
3. The manager suggesting the new allocation bases probably works in the Cake Division.
Under the old scheme, the Cake Division shows an operating loss after allocating headquarter
14-29 Customer-profitability.
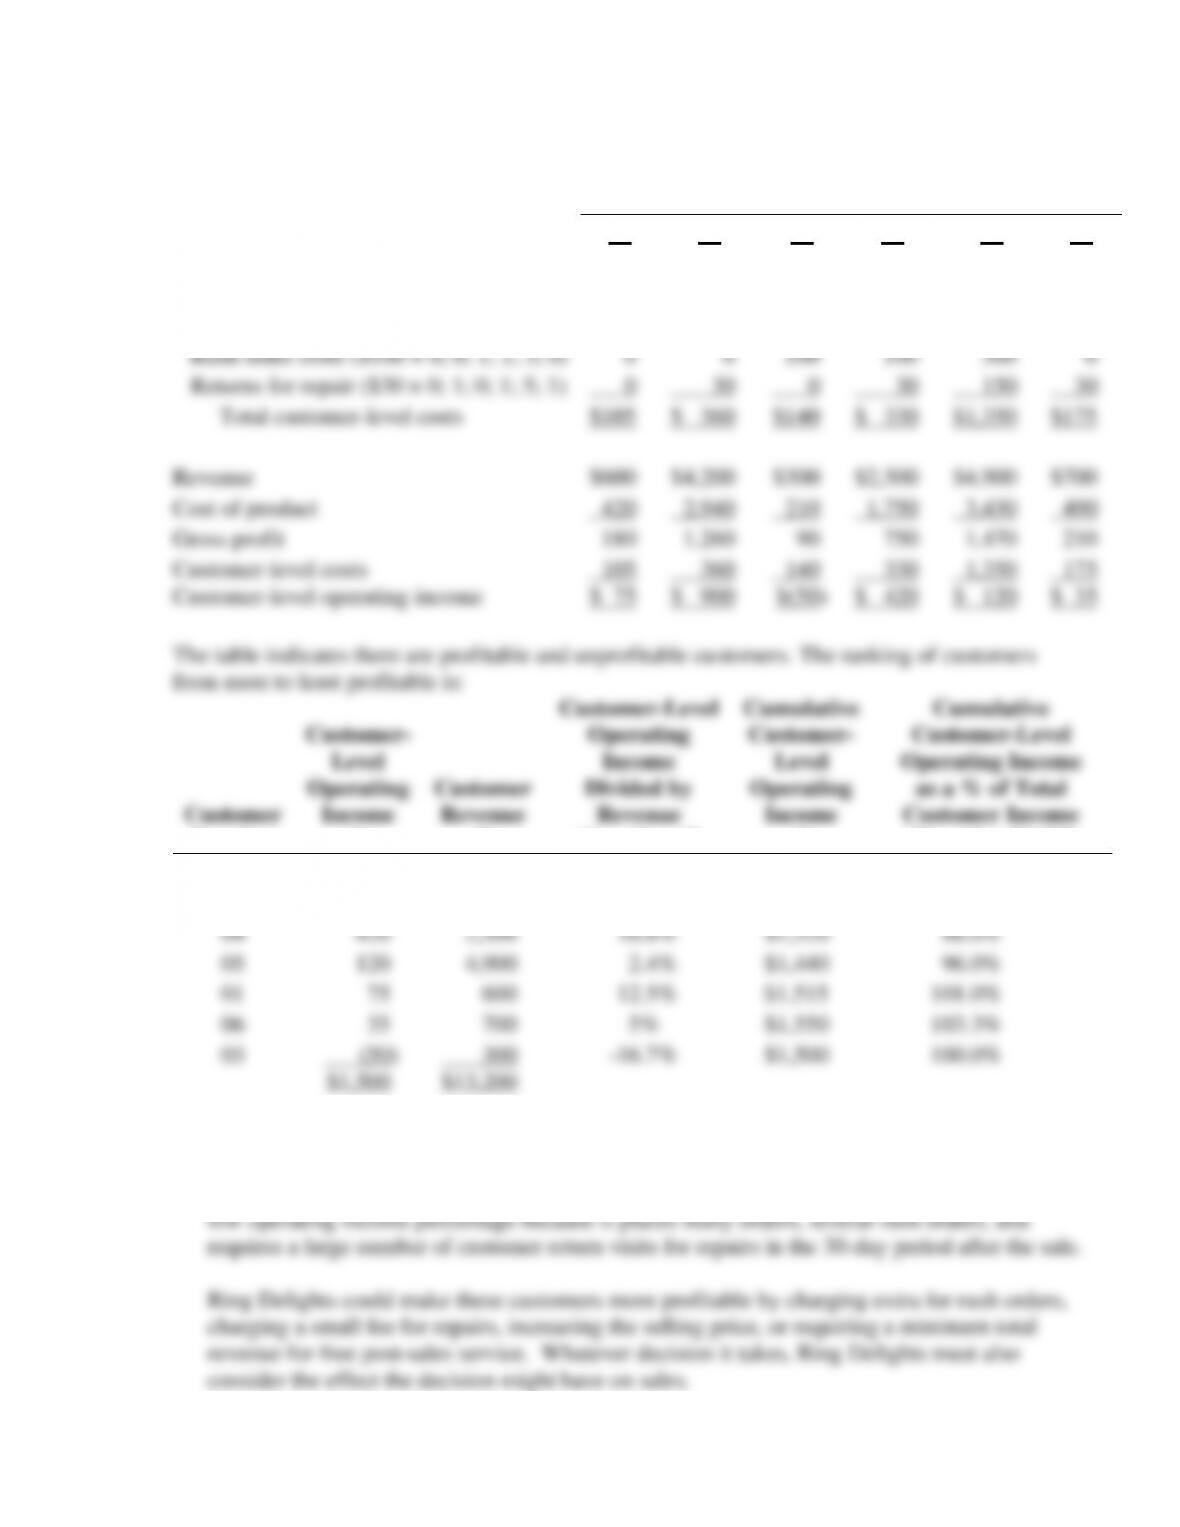
1.
Customer
01
02
03
04
05
06
Customer-level costs
Customer orders ($40 × 2; 7; 1; 5; 20; 3)
$ 80
$ 280
$ 40
$ 200
$ 800
$120
Customer fittings ($25 × 1; 2; 0; 0; 4; 1)
25
50
0
0
100
25
Rush order costs ($100 × 0; 0; 1; 1; 3; 0)
0
0
100
100
300
0
Returns for repair ($30 × 0; 1; 0; 1; 5; 1)
0
30
0
30
150
30
Total customer-level costs
$105
$ 360
$140
$ 330
$1,350
$175
Revenue
$600
$4,200
$300
$2,500
$4,900
$700
Cost of product
420
2,940
210
1,750
3,430
490
Gross profit
180
1,260
90
750
1,470
210
Customer-level costs
105
360
140
330
1,350
175
Customer-level operating income
$ 75
$ 900
$(50)
$ 420
$ 120
$ 35
The table indicates there are profitable and unprofitable customers. The ranking of customers
from most to least profitable is:
Customer
Number
Customer-
Level
Operating
Income
(1)
Customer
Revenue
(2)
Customer-Level
Operating
Income
Divided by
Revenue
(3) = (1) ÷ (2)
Cumulative
Customer-
Level
Operating
Income
(4)
Cumulative
Customer-Level
Operating Income
as a % of Total
Customer Income
(5) = (4) ÷ $1,500
02
$ 900
$ 4,200
21.4%
$ 900
60.0%
04
420
2,500
16.8%
$1,320
88.0%
05
120
4,900
2.4%
$1,440
96.0%
01
75
600
12.5%
$1,515
101.0%
06
35
700
5%
$1,550
103.3%
03
(50)
300
-16.7%
$1,500
100.0%
$1,500
$13,200
2. Customer 03 is unprofitable and of the rest, customer 06 has the lowest operating income.
Customer 05 has a very low operating income to revenue percentage. Customer 3 is
unprofitable because it has very low revenues and requires a rush order. Customer 5 has a
14-30
14-30 (40 min.) Customer profitability, distribution.
1.
Customer
P
Q
R
S
T
Revenues at list pricesa
$29,952
$126,000
$875,520
$457,920
$56,160
Discountb
0
2,100
72,960
15,264
5,616
Revenues (at actual prices)
Cost of goods soldc
Gross margin
Customer-level operating costs
29,952
24,960
4,992
123,900
105,000
18,900
802,560
729,600
72,960
442,656
381,600
61,056
50,544
46,800
3,744
Order takingd
1,500
2,500
3,000
2,500
3,000
Customer visitse
160
240
480
160
240
Delivery vehiclesf
280
240
360
640
1,600
Product handlingg
1,040
4,375
30,400
15,900
1,950
Expedited runsh
0
0
0
0
300
Total
2,980
7,355
34,240
19,200
7,090
Customer-level operating income
$ 2,012
$ 11,545
$ 38,720
$ 41,856
$ (3,346)
a $14.40 2,080; 8,750; 60,800; 31,800; 3,900
b ($14.40 – $14.40) 2,080; ($14.40 – $14.16) 8,750; ($14.40 – $13.20) 60,800; ($14.40 – $13.92) 31,800;
g $0.50 2,080; 8,750; 60,800; 31,800; 3,900
h $300 0; 0; 0; 0; 1
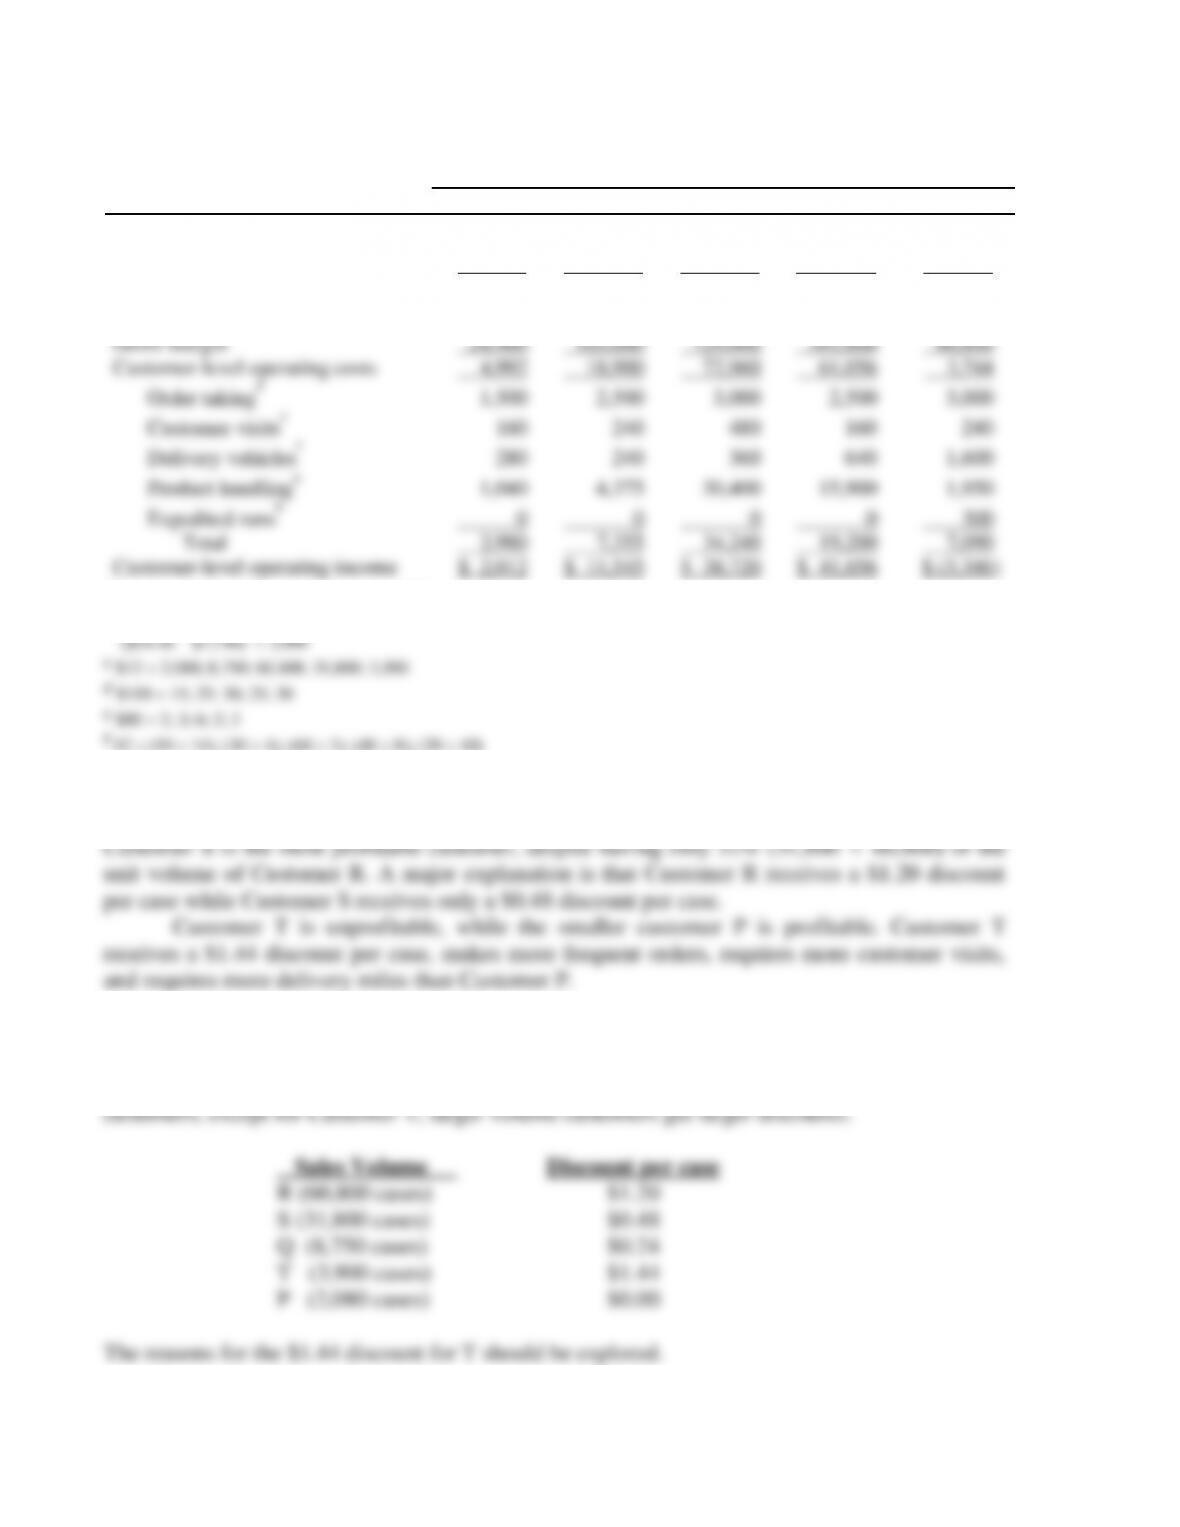
2. Separate reporting of both the list selling price and the actual selling price enables Spring
Distribution to examine which customers receive different discounts and how salespeople may
differ in the discounts they grant. There is a size pattern in the discounts across the five