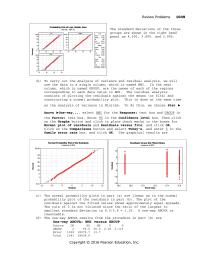
Archives
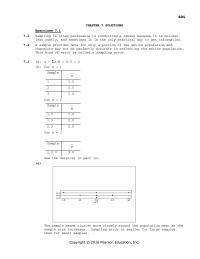
Chapter 1 The population is the collection of all individuals
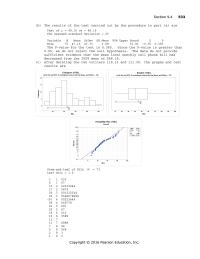
Chapter 10 All of the computation above are the same for
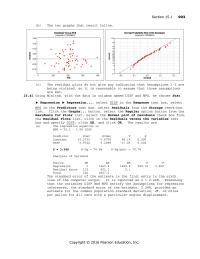
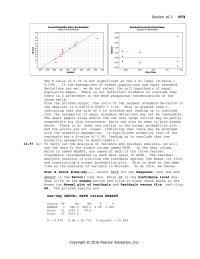
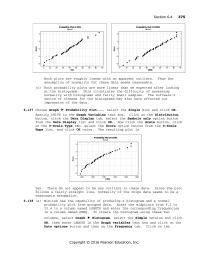
Chapter 10 Although the normal probability plots are quite close
Chapter 10 between men over 65 and younger men is somewhere between
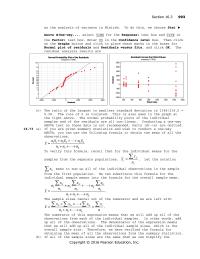
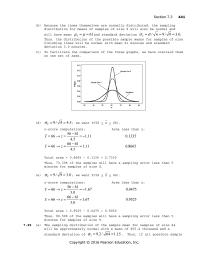
Chapter 10 It is the sampling distribution of the difference of the
Chapter 10 The two sample sizes are small and moderate
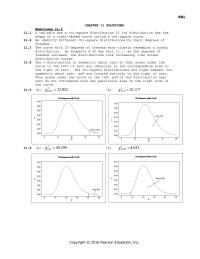
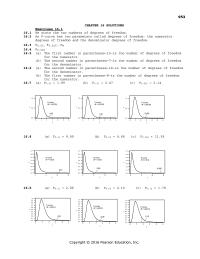
Chapter 11 The curve with 20 degrees of freedom more closely resembles
Chapter 11 treated for pulmonary hypertension and those not so treated
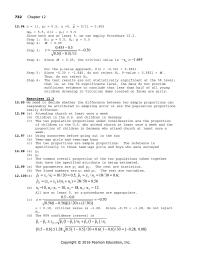
Chapter 12 The common overall proportion of the two populations taken together
Chapter 12 Usually the population under consideration is large
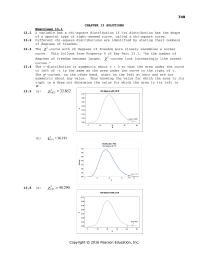
Chapter 13 A variable has a chi-square distribution if its distribution
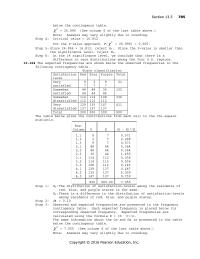
Chapter 13 The distribution of satisfaction-levels among the residents
Chapter 13 then their frequencies do not rise and fall together
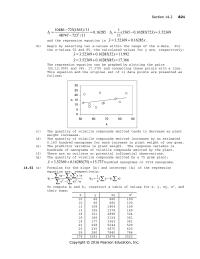
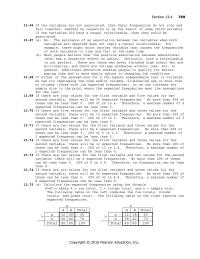
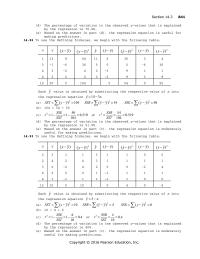
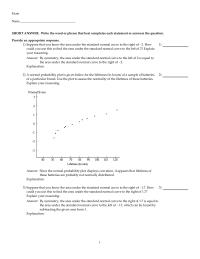
Chapter 14 It is reasonable to use the regression equation to predict
Chapter 14 The criterion is that the line that best fits a set of data
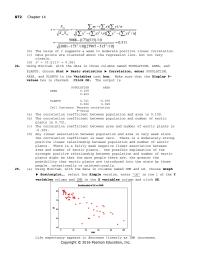
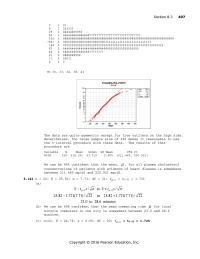
Chapter 14 the data point for the United States is an influential observation
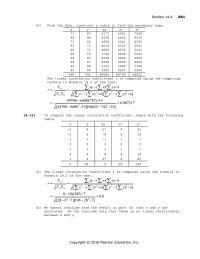
Chapter 14 There is a very weak linear relationship between PCB concentration
Chapter 14 we saw from the scatterplot that finding a regression
Chapter 15 A plot of the residuals against the values of the predictor variable
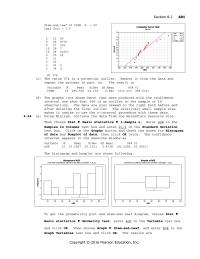
Chapter 15 The point estimate for the conditional mean WEIGHT for babies
Chapter 15 we conclude that estriol levels of mothers are useful
Chapter 15 we look at the graph produced by the procedure at the beginning
Chapter 16 Looking at the intervals that do not contain zero
Chapter 16 The logic behind one-way ANOVA is to reject the null hypothesis
Chapter 16 The normal probability plots for each age group are non-linear,
Chapter 16 They are the same since there is only one difference in the family
Chapter 16 To carry out the Analysis of variance and residual analysis
Chapter 16 which is less than the 0.05 significance level
Chapter 2 Both variables have distributions that are unimodal
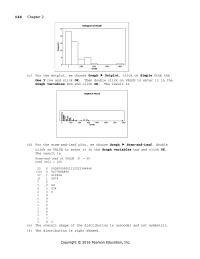
Chapter 2 demonstrates that the data are grouped using classes based
Chapter 2 The actual drop was from a happiness score of about
Chapter 2 The fourth column consists of quantitative, continuous data.
Chapter 2 The relative frequencies were calculated in part
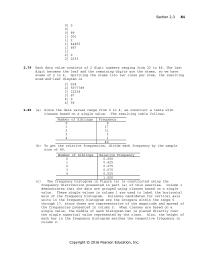
Chapter 2 The stem-and-leaf diagram used five lines per stem
Chapter 3 Now click on the Statistics button and check the range
Section 3.2 147 85.53 112 92.31898 s 2 2 ( ) / 1 i i x x n sn 85.53 112 12/941105689 2 s 2 ( ) 1 i x x sn /x n 11.0 19 10.0 s Copyright © […]
Chapter 3 of the observations lie within 1 standard deviations
Section 3.3 167 Copyright © 2016 Pearson Education, Inc. 168 Chapter 3 2 2 2 1 1/ 0.99 0.01 1/ 1/ 0.01 100 10 k k k k 2 2 2 1 1/ 0.95 0.05 1 / 1 / 0.05 […]
Chapter 3 The first quartile is the median of the lower half
Review Problems 201 305.3 30.53 10 i x x n Copyright © 2016 Pearson Education, Inc. 457 45.7 10 i x x n 0.5 9 10/45721109 1 /)( 2 22 n nxx s Copyright © 2016 Pearson Education, Inc. 202 […]
Chapter 3 The mean does not have the property of being resistant
127 Copyright © 2016 Pearson Education, Inc. 128 Chapter 3 Copyright © 2016 Pearson Education, Inc. Section 3.1 129 Copyright © 2016 Pearson Education, Inc. 130 Chapter 3 Copyright © 2016 Pearson Education, Inc. Section 3.1 131 Copyright © 2016 […]
Chapter 3 The tiger snake of 850g is larger relative to other tiger
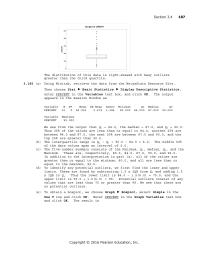
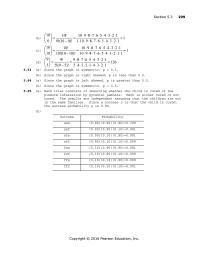
Section 3.4 187 500 400 300 200 100 0 Boxplot of LENGTH Copyright © 2016 Pearson Education, Inc. 188 Chapter 3 92 90 88 86 84 82 80 Boxplot of PERCENT Copyright © 2016 Pearson Education, Inc. Section 3.4 189 […]
Chapter 4 Conditional probabilities can sometimes be computed directly
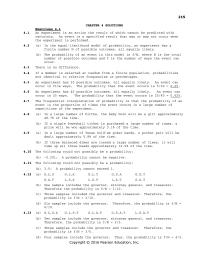
Chapter 4 If a member is selected at random from a finite population
Chapter 4 The contestant first picked the door with the car behind it
Chapter 4 The sum of each row and column of joint probabilities
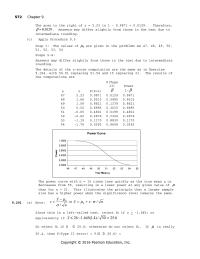
Chapter 5 Ne note that the first calculation using the sample
Chapter 5 the trials are independent because the results of one
Chapter 5 Yours will almost certainly differ from these
Chapter 6 associated with any one battery lasting longer than 25 hours
Chapter 6 If X represents the number of college women that have been
Chapter 6 Since the total area under the density curve is one
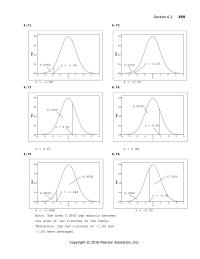
Chapter 6 The empirical rule says that for any variable having approximately
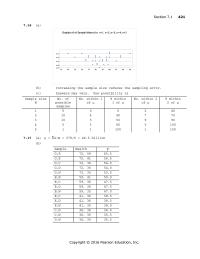
Chapter 7 Since each sample mean is based upon a single observation
Chapter 7 the probability that the sampling error will be
Chapter 7 The sampling distribution of the sample mean for samples
Chapter 8 A confidence-interval estimate of a parameter
Chapter 8 the confidence interval has not changed dramatically
Chapter 8 we must quadruple the sample size in order to double
º
Chapter 9 occur when the null hypothesis is true
Chapter 9 We predicted 5 out of 100 would lead to a rejection
Chapter 9 you could possibly make a Type I error
Chapter 9 mean amount spent by consumers on nonalcoholic beverages has
Mathematics Chapter 1 Answers Will Vary Possible Answer The Population
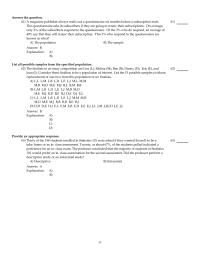
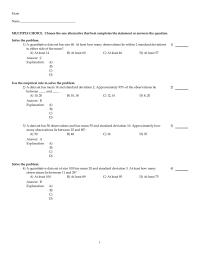
Answer the question. 61) A magazine publisher always mails out a questionnaire six months before a subscription ends. This questionnaire asks its subscribers if they are going to renew their subscriptions. On average, only 3% of the subscribers respond to […]
Mathematics Chapter 1 Differences Reading Ability Between The Three groups The
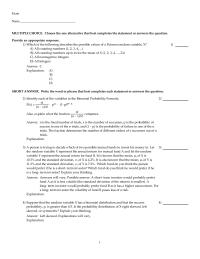
Exam Name___________________________________ SHORT ANSWER. Write the word or phrase that best completes each statement or answers the question. Provide an appropriate response. 1) At one hospital in 1992, 674 women were diagnosed with breast cancer. Five years later, 88% of […]
Mathematics Chapter 10 A researcher would like to conduct a hypothesis
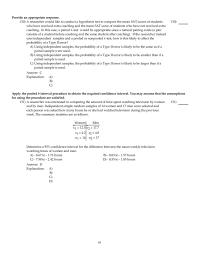
Provide an appropriate response. 130) A researcher would like to conduct a hypothesis test to compare the mean SAT scores of students who have received extra coaching and the mean SAT score of students who have not received extra coaching. […]
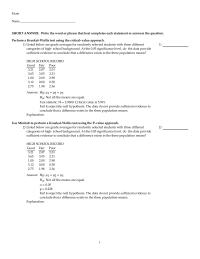
Mathematics Chapter 10 A statistician performs a paired Wilcoxon
Provide an appropriate response. 43) Suppose that you want to perform a hypothesis test based on independent simple random samples to compare the means of two populations. Several procedures are available, namely, the pooled t–test, the nonpooled t–test, and the […]
Mathematics Chapter 10 mean weight of women who have been on this
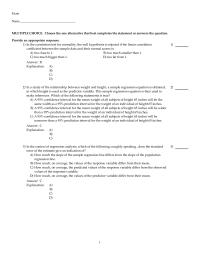
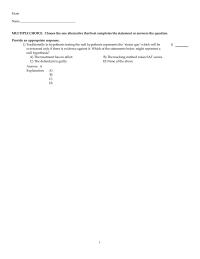
Exam Name___________________________________ MULTIPLE CHOICE. Choose the one alternative that best completes the statement or answers the question. Provide an appropriate response. 1) Suppose that you want to perform a hypothesis test to compare the means of two populations using independent […]
Mathematics Chapter 10 Preliminary Data Analyses Indicate That You Can
Preliminary data analyses indicate that you can reasonably use nonpooled t–procedures on the given data. Apply a nonpooled t–test to perform the required hypothesis test, using either the critical–value approach or the P–value approach as indicated. 77) A researcher was […]
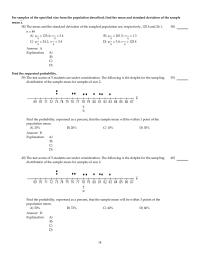
Mathematics Chapter 10 The null and alternative hypotheses for the hypothesis
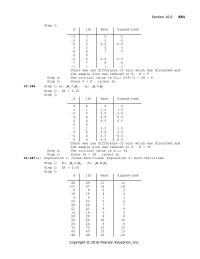
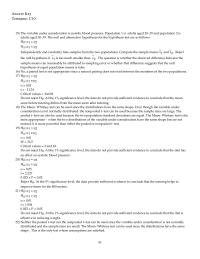
Answer Key Testname: C10 93 15) The variable under consideration is systolic blood pressure. Population 1 is adults aged 20–29 and population 2 is adults aged 30–39. The null and alternative hypotheses for the hypothesis test are as follows: H0: […]
Mathematics Chapter 10 Use The Information Provided Decide Which Procedure should
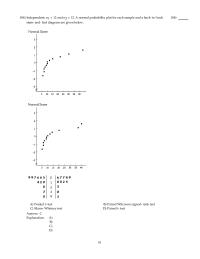
186) Independent; n1= 12 and n2= 12. A normal probability plot for each sample and a back–to–back stem–and–leaf diagram are given below. 186) A) Pooled t–test B) Paired Wilcoxon signed–rank test C) Mann–Whitney test D) Paired t–test 81 Answer: C […]
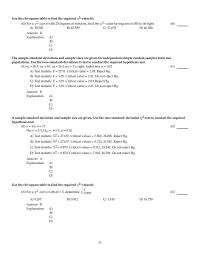
Mathematics Chapter 11 A sample standard deviation and sample size
Use the chi–square table to find the required 2–value(s). 60) For a 2–curve with 25 degrees of freedom, find the 2–value having area 0.005 to its right. 60) A) 10.520 B) 45.559 C) 37.653 D) 46.928 The sample standard deviations […]
Mathematics Chapter 11 When 25 randomly selected customers enter any
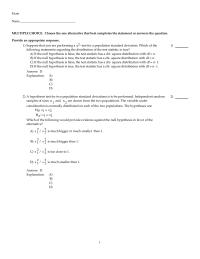
Exam Name___________________________________ MULTIPLE CHOICE. Choose the one alternative that best completes the statement or answers the question. Provide an appropriate response. 1) Suppose that you are performing a 2–test for a population standard deviation. Which of the following statements regarding […]
Mathematics Chapter 12 Assume That Independent Simple Random Samples Have
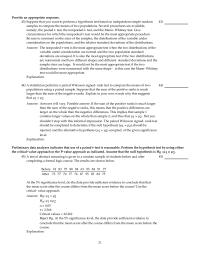
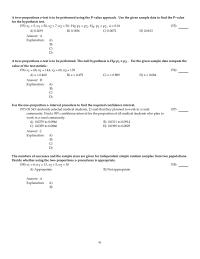
A two–proportions z–test is to be performed using the P–value approach. Use the given sample data to find the P–value for the hypothesis test. 155) x1= 5, n1 = 50, x2= 7, n2= 50; H0: p1=p2, Ha: p1<p2 , […]
Mathematics Chapter 12 Does The Special Class Have Some Value
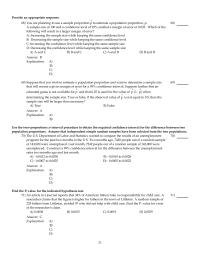
Provide an appropriate response. 68) ^ You are planning to use a sample proportion p to estimate a population proportion, p. A sample size of 100 and a confidence level of 95% yielded a margin of error of 0.025. Which […]
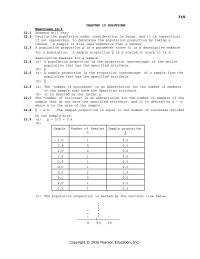
Mathematics Chapter 12 Sample Number Males Sample Proportion
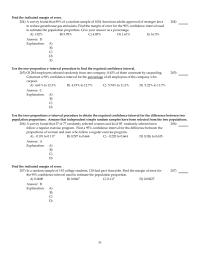
Find the indicated margin of error. 204) A survey found that 89% of a random sample of 1024 American adults approved of stronger laws to reduce greenhouse gas emissions. Find the margin of error for the 90% confidence interval used […]
Mathematics Chapter 12 Which of the statements below is a valid interpretation
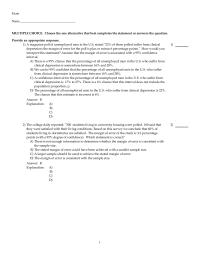
Exam Name___________________________________ MULTIPLE CHOICE. Choose the one alternative that best completes the statement or answers the question. Provide an appropriate response. 1) A magazine poll of unemployed men in the U.S. stated “22% of those polled suffer from clinical depression; […]
Mathematics Chapter 13 do the data provide sufficient evidence to conclude
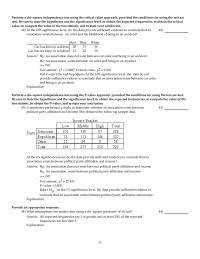
Perform a chi–square independence test using the critical value approach, provided the conditions for using the test are met. Be sure to state the hypotheses and the significance level, to obtain the expected frequencies, to obtain the critical value, to […]
Mathematics Chapter 13 New Woman Magazine Indicates That The Number
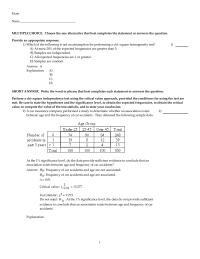
Exam Name___________________________________ MULTIPLE CHOICE. Choose the one alternative that best completes the statement or answers the question. Provide an appropriate response. 1) Which of the following is not an assumption for performing a chi–square homogeneity test? 1) A) At most […]
Mathematics Chapter 13 The Marginal Distribution Of political Party Affiliation Would
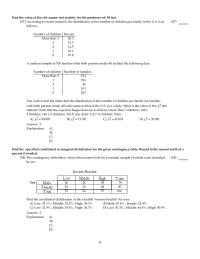
Find the value of the chi–square test statistic for the goodness–of–fit test. 107) According to recent research, the distribution of the number of children per family in the U.S. is as follows. Number of children Percent More than 3 20.3 […]
Mathematics Chapter 13 The table below shows the conditional distributions
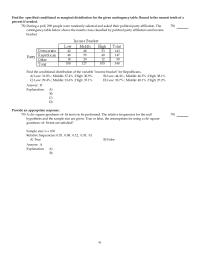
Find the specified conditional or marginal distribution for the given contingency table. Round to the nearest tenth of a percent if needed. 78) During a poll, 290 people were randomly selected and asked their political party affiliation. The contingency table […]

Mathematics Chapter 14 Obtain The Linear Correlation Coefficient For The
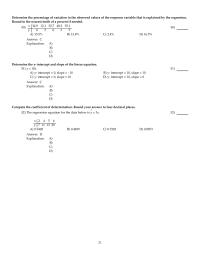
Obtain the linear correlation coefficient for the data. Round your answer to three decimal places. 102) A study was conducted to compare the number of hours spent in the computer lab on an assignment (x) and the grade on the […]
Mathematics Chapter 14 True False Every Straight Line Can Represented
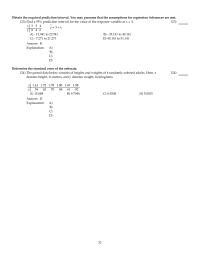
Determine the percentage of variation in the observed values of the response variable that is explained by the regression. Round to the nearest tenth of a percent if needed. 50) x 34.9 12.1 32.7 48.2 35.1 y 6 3 6 […]
Mathematics Chapter 14 When Performing Regression Analysis How Can You
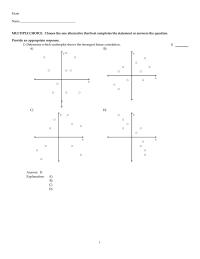
Exam Name___________________________________ MULTIPLE CHOICE. Choose the one alternative that best completes the statement or answers the question. Provide an appropriate response. 1) Determine which scatterplot shows the strongest linear correlation. 1) A) B) C) D) Answer: D Explanation: A) B) […]
Mathematics Chapter 15 Applicants For Particular Job Which Involves Extensive
Exam Name___________________________________ MULTIPLE CHOICE. Choose the one alternative that best completes the statement or answers the question. Provide an appropriate response. 1) In the correlation test for normality, the null hypothesis is rejected if the linear correlation coefficient between the […]
Mathematics Chapter 15 Eight Similar Plots Landare Selected And Each
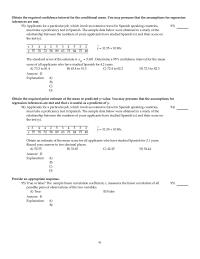
Obtain the required confidence interval for the conditional mean. You may presume that the assumptions for regression inferences are met. 93) ^ Applicants for a particular job, which involves extensive travel in Spanish speaking countries, must take a proficiency test […]
Mathematics Chapter 15 if the correlation coefficient is too much
Obtain the required prediction interval. You may presume that the assumptions for regression inferences are met. 123) ^ Find a 95% prediction interval for the value of the response variable at x =4. x 3 2 4 y 8 4 […]
Mathematics Chapter 15 Several employees Are Randomly Selected And Tested With
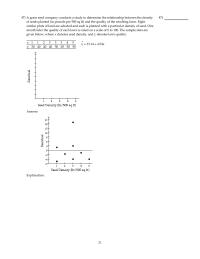
47) ^ A grass seed company conducts a study to determine the relationship between the density of seeds planted (in pounds per 500 sq ft) and the quality of the resulting lawn. Eight similar plots of land are selected and […]
Mathematics Chapter 16 A Kruskal- Wallis test is being performed to
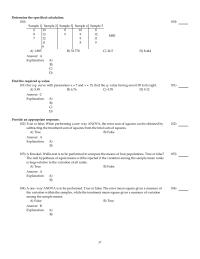
Determine the specified calculation. 100) Sample 1 Sample 2 Sample 3 Sample 4 Sample 5 610 810 8 813 9 9 12 712 911 11 8 9 9 MSE 100) A) 1.885 B) 33.778 C) 24.5 D) 8.444 Find the […]
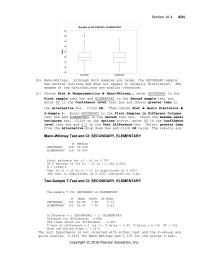
Mathematics Chapter 16 A realtor wishes to compare the square footage
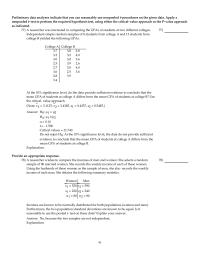
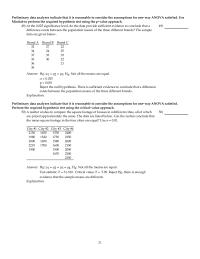
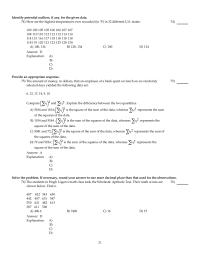
Preliminary data analyses indicate that it is reasonable to consider the assumptions for one–way ANOVA satisfied. Use Minitab to perform the required hypothesis test using the p–value approach. 49) At the 0.025 significance level, do the data provide sufficient evidence […]
Mathematics Chapter 16 Why Does This Make Sense answer Two Population
Exam Name___________________________________ SHORT ANSWER. Write the word or phrase that best completes each statement or answers the question. Perform a Kruskal–Wallis test using the critical–value approach. 1) Listed below are grade averages for randomly selected students with three different categories […]
Mathematics Chapter 2 Distributed Evenly Among The Classes Values
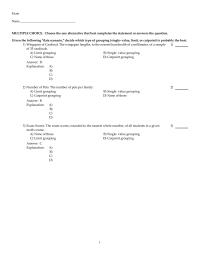
Exam Name___________________________________ MULTIPLE CHOICE. Choose the one alternative that best completes the statement or answers the question. Given the following “data scenario,” decide which type of grouping (single–value, limit, or cutpoint) is probably the best. 1) Wingspan of Cardinal: The […]
Mathematics Chapter 2 it may be hard to get a picture of the data
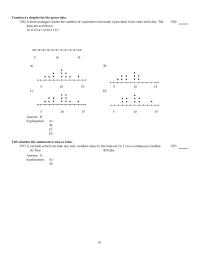
Construct a dotplot for the given data. 156) A store manager counts the number of customers who make a purchase in his store each day. The data are as follows. 10 11 814 710 10 11 8 7 510 15 […]
Mathematics Chapter 2 The Ages Group Patients Being Treated One
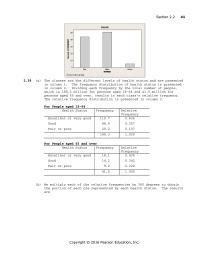
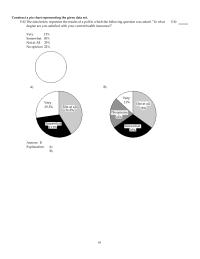
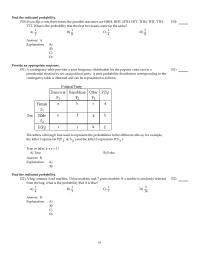
Construct a pie chart representing the given data set. 116) The data below represent the results of a poll in which the following question was asked: “To what degree are you satisfied with your current health insurance?” Very 13% Somewhat […]
Mathematics Chapter 2 The partially filled contingency table gives
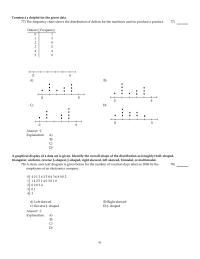
Construct a dotplot for the given data. 77) The frequency chart shows the distribution of defects for the machines used to produce a product. Defects Frequency 0 1 1 3 2 0 3 2 4 4 5 0 77) A) […]
Mathematics Chapter 2 The Results Survey About Recent Judicial Appointment
Provide an appropriate response. 38) Suppose that a group of professional athletes consists of 100 gymnasts and 100 basketball players. What kind of distribution do you think the heights of the athletes would have? Explain your thinking. 38) Answer: Answers […]
Mathematics Chapter 3 For This Reason The Median Is usually Preferred
Exam Name___________________________________ MULTIPLE CHOICE. Choose the one alternative that best completes the statement or answers the question. Solve the problem. 1) A quantitative data set has size 60. At least how many observations lie within 2 standard deviations to either […]
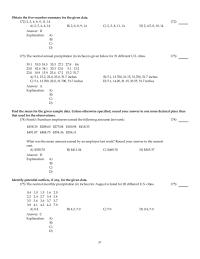
Mathematics Chapter 3 Obtain The Five number Summary For The Given
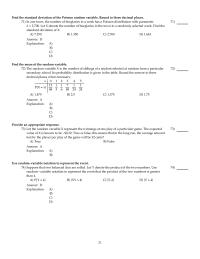
Obtain the five–number summary for the given data. 172) 2, 3, 6, 8, 9, 11, 14 172) A) 2, 5, 6, 4, 14 B) 2, 6, 8, 9, 14 C) 2, 3, 8, 11, 14 D) 2, 4.5, 8, 10, […]
Mathematics Chapter 3 The Distribution Has Been Right Skewed And
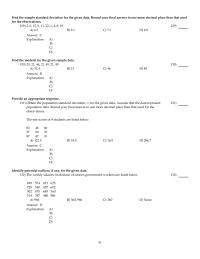
Find the sample standard deviation for the given data. Round your final answer to one more decimal place than that used for the observations. 129) 2, 6, 15, 9, 11, 22, 1, 4, 8, 19 129) A) 6.3 B) 2.1 […]
Mathematics Chapter 3 The students in Hugh Logan’s math class
Identify potential outliers, if any, for the given data. 74) Here are the highest temperatures ever recorded (in °F) in 32 different U.S. states: 100 100 105 105 106 106 107 107 108 110 110 112 112 112 114 114 […]
Mathematics Chapter 4 A has an equal chance of occurring or not occurring
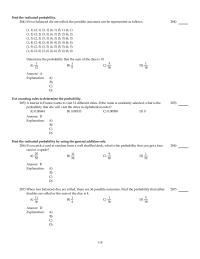
Find the indicated probability. 284) If two balanced die are rolled, the possible outcomes can be represented as follows. (1, 1) (2, 1) (3, 1) (4, 1) (5, 1) (6, 1) (1, 2) (2, 2) (3, 2) (4, 2) (5, […]
Mathematics Chapter 4 A study conducted at a certain college
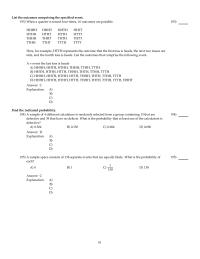
List the outcomes comprising the specified event. 193) When a quarter is tossed four times, 16 outcomes are possible. HHHH HHHT HHTH HHTT HTHH HTHT HTTH HTTT THHH THHT THTH THTT TTHH TTHT TTTH TTTT Here, for example, HTTH represents […]
Mathematics Chapter 4 At the end of each branch use symbols to represent
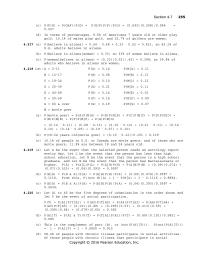
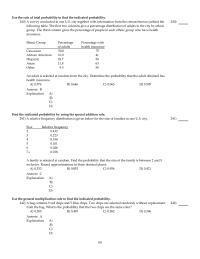
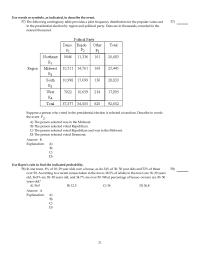
Use the rule of total probability to find the indicated probability. 240) A survey conducted in one U.S. city together with information from the census bureau yielded the following table. The first two columns give a percentage distribution of adults […]
Mathematics Chapter 4 Auto Insurance Company Was Interested Investigating
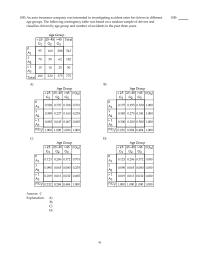
108) An auto insurance company was interested in investigating accident rates for drivers in different age groups. The following contingency table was based on a random sample of drivers and classifies drivers by age group and number of accidents in […]
Mathematics Chapter 4 Interpret The Symbol PBA And Explain What
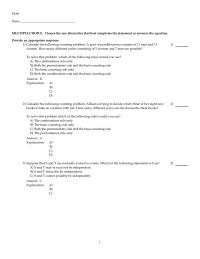
Exam Name___________________________________ MULTIPLE CHOICE. Choose the one alternative that best completes the statement or answers the question. Provide an appropriate response. 1) Consider the following counting problem. A pool of possible jurors consists of 11 men and 13 women. How […]
Mathematics Chapter 4 The following contingency table provides a joint
Find the indicated probability. 150) If you flip a coin three times, the possible outcomes are HHH, HHT, HTH, HTT, THH, THT, TTH, TTT. What is the probability that the first two tosses come up the same? 150) A) 1 […]
Mathematics Chapter 4 The Following data Were Obtained From Random Sample
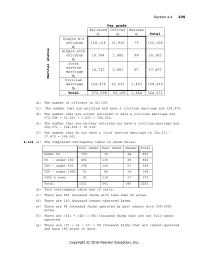
Use words or symbols, as indicated, to describe the event. 57) The following contingency table provides a joint frequency distribution for the popular votes cast in the presidential election by region and political party. Data are in thousands, rounded to […]
Mathematics Chapter 5 A naturalist leads whale watch trips every
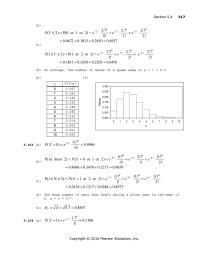
Find the standard deviation of the Poisson random variable. Round to three decimal places. 71) In one town, the number of burglaries in a week has a Poisson distribution with parameter =2.700. Let X denote the number of burglaries in […]
Mathematics Chapter 5 For a randomly selected student in a particular
A) B) C) Answer: A Explanation: A) B) C) 40 Find the standard deviation of the binomial random variable. 125) The probability that a radish seed will germinate is 0.7. A gardener plants seeds in batches of 10. Find the […]
Mathematics Chapter 5 Let the random variable X represent the winnings
Exam Name___________________________________ MULTIPLE CHOICE. Choose the one alternative that best completes the statement or answers the question. Provide an appropriate response. 1) Which of the following describes the possible values of a Poisson random variable, X? 1) A) All counting […]
Mathematics Chapter 6 It would take too long to solve the problem
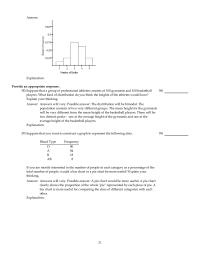
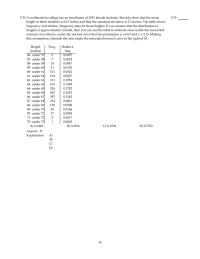
115) A southeastern college has an enrollment of 2951 female students. Records show that the mean height of these students is 64.7 inches and that the standard deviation is 2.3 inches. The table shows frequency and relative–frequency data for these […]
Mathematics Chapter 6 The lifetimes of lightbulbs of a particular type
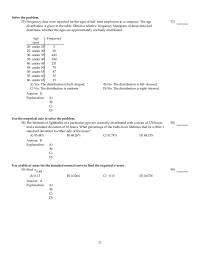
Solve the problem. 57) Frequency data were reported for the ages of full–time employees at a company. The age distribution is given in the table. Obtain a relative–frequency histogram of these data and determine whether the ages are approximately normally […]
Mathematics Chapter 6 The Prices Per Gallon In Dollars Regular
Exam Name___________________________________ SHORT ANSWER. Write the word or phrase that best completes each statement or answers the question. Provide an appropriate response. 1) Suppose that you know the area under the standard normal curve to the right of –2. How […]
Mathematics Chapter 7 The heights of people in a certain population
For samples of the specified size from the population described, find the mean and standard deviation of the sample mean x. 38) The mean and the standard deviation of the sampled population are, respectively, 125.4 and 24.1. n =49 38) […]
Mathematics Chapter 7 You Wish Find The Probability that The Mean
Exam Name___________________________________ MULTIPLE CHOICE. Choose the one alternative that best completes the statement or answers the question. Provide an appropriate response. 1) The mean annual income for adult women in one city is $28,520 and the standard deviation of the […]
Mathematics Chapter 8 A college statistics professor has office hours
52) A random sample of 110 full–grown lobsters had a mean weight of 16 ounces. Assume that =3.5 ounces. Construct a 95% confidence interval for the population mean µ. 52) A) 15.2 to 16.8 ounces B) 15.4 to 16.6 ounces […]
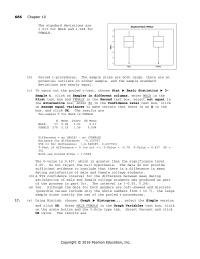
Mathematics Chapter 8 Weights Women One Age Group Are Normally
Exam Name___________________________________ MULTIPLE CHOICE. Choose the one alternative that best completes the statement or answers the question. Provide an appropriate response. 1) When estimating a population mean by a sample mean, which of the following does the margin of error […]
Mathematics Chapter 9 Nonparametric methods tend to waste information
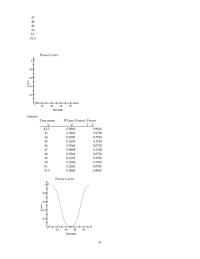
47 48 49 50 51 51.5 Power Curve Answer: 41 True mean P(Type II error) Power µ1 – 42.5 0.0060 0.9940 43 0.0262 0.9738 44 0.2090 0.7910 45 0.6255 0.3745 46 0.9264 0.0736 47 0.9898 0.0102 48 0.9264 0.0736 49 […]
Mathematics Chapter 9 Perform The appropriate Hypothesis Test Using
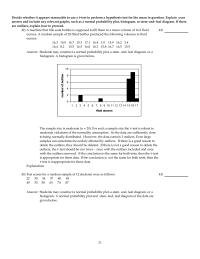
Decide whether it appears reasonable to use a t–test to perform a hypothesis test for the mean in question. Explain your answer and include any relevant graphs, such as a normal probability plot, histogram, or stem–and–leaf diagram. If there are […]
Mathematics Chapter 9 the average math SAT score for students at one school
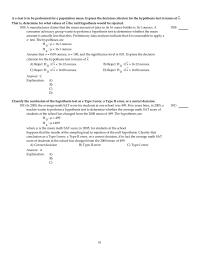
A z–test is to be performed for a population mean. Express the decision criterion for the hypothesis test in terms of x. That is, determine for what values of x the null hypothesis would be rejected. 180) A manufacturer claims […]
Mathematics Chapter 9 The Curve The Graph The Normal Curve
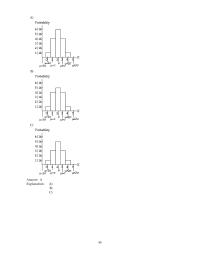
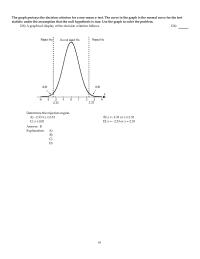
The graph portrays the decision criterion for a one–mean z–test. The curve in the graph is the normal curve for the test statistic under the assumption that the null hypothesis is true. Use the graph to solve the problem. 126) […]
Mathematics Chapter 9 The Ttest Used Instead The Z test
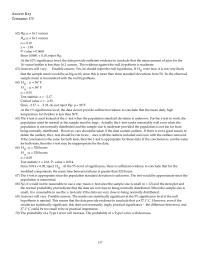
Answer Key Testname: C9 137 62) H0: µ= 16.1 ounces Ha: µ< 16.1 ounces = 0.10 z = – 1.49 P–value = 0.0681 Since 0.0681 < 0.10, reject H0. At the 10% significance level, the data provide sufficient evidence to […]
Mathematics Chapter 9 The Value Obtained For The Test Statistic
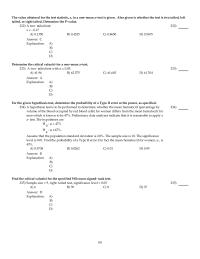
The value obtained for the test statistic, z, in a one–mean z–test is given. Also given is whether the test is two tailed, left tailed, or right tailed. Determine the P–value. 232) A two–tailed test: z = – 0.17 232) […]
Mathematics Chapter 9 They Randomly Sampled Calls Originating The Town
Exam Name___________________________________ MULTIPLE CHOICE. Choose the one alternative that best completes the statement or answers the question. Provide an appropriate response. 1) Traditionally in hypothesis testing the null hypothesis represents the “status quo” which will be overturned only if there […]
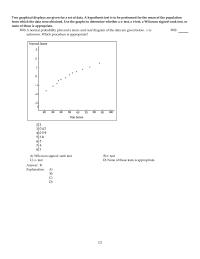
Mathematics Chapter 9 Two Graphical Displays Are Given For Set
Two graphical displays are given for a set of data. A hypothesis test is to be performed for the mean of the population from which the data were obtained. Use the graphs to determine whether a z–test, a t–test, a […]