Identify potential outliers, if any, for the given data.
74)
Here are the highest temperatures ever recorded (in °F) in 32 different U.S. states:
100 100 105 105 106 106 107 107
108 110 110 112 112 112 114 114
114 115 116 117 118 118 118 118
118 119 120 121 122 125 128 134
74)
A)
100, 134
B)
128, 134
C)
100
D)
134
Provide an appropriate response.
75)
The amount of money, in dollars, that an employee of a bank spent on lunch on six randomly
selected days yielded the following data set:
6, 12, 17, 14, 5, 18
Compute xi2 and xi2. Explain the difference between the two quantities.
75)
A)
5184 and 1014; xi2 is the square of the sum of the data, whereas xi2 represents the sum
of the squares of the data.
B)
1014 and 5184 ; xi2 is the sum of the squares of the data, whereas xi2 represents the
square of the sum of the data.
C)
5041 and 72; xi2 is the square of the sum of the data, whereas xi2 represents the sum of
the squares of the data.
D)
72 and 5184 ; xi2 is the sum of the squares of the data, whereas xi2 represents the
square of the sum of the data.
Solve the problem. If necessary, round your answer to one more decimal place than that used for the observations.
76)
The students in Hugh Logan’s math class took the Scholastic Aptitude Test. Their math scores are
shown below. Find n.
407 422 343 630
442 457 631 547
550 621 482 613
387 411 506
76)
A)
496.6
B)
7449
C)
16
D)
15
Solve the problem.
77)
The heights of the adults in one town have a mean of 67.1 inches and a standard deviation of 3.5
inches. What can you conclude from Chebyshev‘s rule about the percentage of adults in the town
whose heights are between 56.6 and 77.6 inches?
77)
A)
The percentage is at least 89%
B)
The percentage is at least 99.7%
C)
The percentage is at most 99.7%
D)
The percentage is at most 89%
Provide an appropriate response.
78)
Find the population mean. Round to one decimal place as needed.
1, 3, –1, 6
78)
A)
5.1
B)
4.5
C)
9
D)
2.3
Solve the problem.
79)
A variable x has the possible observations shown below.
Possible observations of x: –3 –1 0 1 1 2 4 4 5
Determine the standardized version of x.
Round the values of µ and to one decimal place.
79)
A)
x =z – 1.4
2.6
B)
z =x – 1.4
2.5
C)
z =x – 2.5
1.4
D)
z =x – 1.4
2.6
Solve the problem. If necessary, round your answer to one more decimal place than that used for the observations.
80)
A sample of non–recyclable waste shipping companies in a certain state yielded the following
amounts, in tons, of waste shipped during 2005. Determine n, xi, and x.
1926 409 857 765
883 1772 533 1616
446 643 706 886
80)
A)
n =10;
xi=11,442;
x=953.5
B)
n = 12;
xi=11,442;
x=1144.2
C)
n =10;
xi=11,442;
x=1144.2
D)
n = 12;
xi=11,442;
x=953.5
Find the median for the given sample data.
81)
In ten trips to Las Vegas, a person had the following net gains:
$3368 $1727 $4105 $6681 $1890
$2974 $6522 $7584 $6100 $4181
81)
A)
$4513.70
B)
$4105
C)
$4143.00
D)
$5015.72
D)
Provide an appropriate response.
82)
Find the population standard deviation. Round to one decimal place as needed.
1, 2, 4, 6, 7
82)
A)
5.2
B)
9.5
C)
1.5
D)
2.3
D)
Solve the problem.
83)
A variable x has a mean, µ, of 19.4 and a standard deviation, , of 3.6. Determine the z–score
corresponding to an observed value for x of 25.8. Round your final answer to two decimal places.
83)
A)
–1.78
B)
1.14
C)
1.78
D)
12.56
23
D)
Provide an appropriate response.
84)
A company had 80 employees whose salaries are summarized in the frequency distribution below.
Find the standard deviation.
Salary Employees
5,000–under 10,000 11
10,000–under 15,000 10
15,000–under 20,000 16
20,000–under 25,000 19
25,000–under 30,000 24
84)
A)
7741.0
B)
6973.9
C)
7531.8
D)
7322.6
Find the mean for the given sample data. Unless otherwise specified, round your answer to one more decimal place than
that used for the observations.
85)
Last year, nine employees of an electronics company retired. Their ages at retirement are listed
below. Find the mean retirement age.
55 61 63
55 66 58
61 57 56
85)
A)
58.5 yr
B)
57.8 yr
C)
58 yr
D)
59.1 yr
Find the sample standard deviation for the given data. Round your final answer to one more decimal place than that used
for the observations.
86)
22, 29, 21, 24, 27, 28, 25, 36
86)
A)
1.6
B)
2.8
C)
4.8
D)
4.2
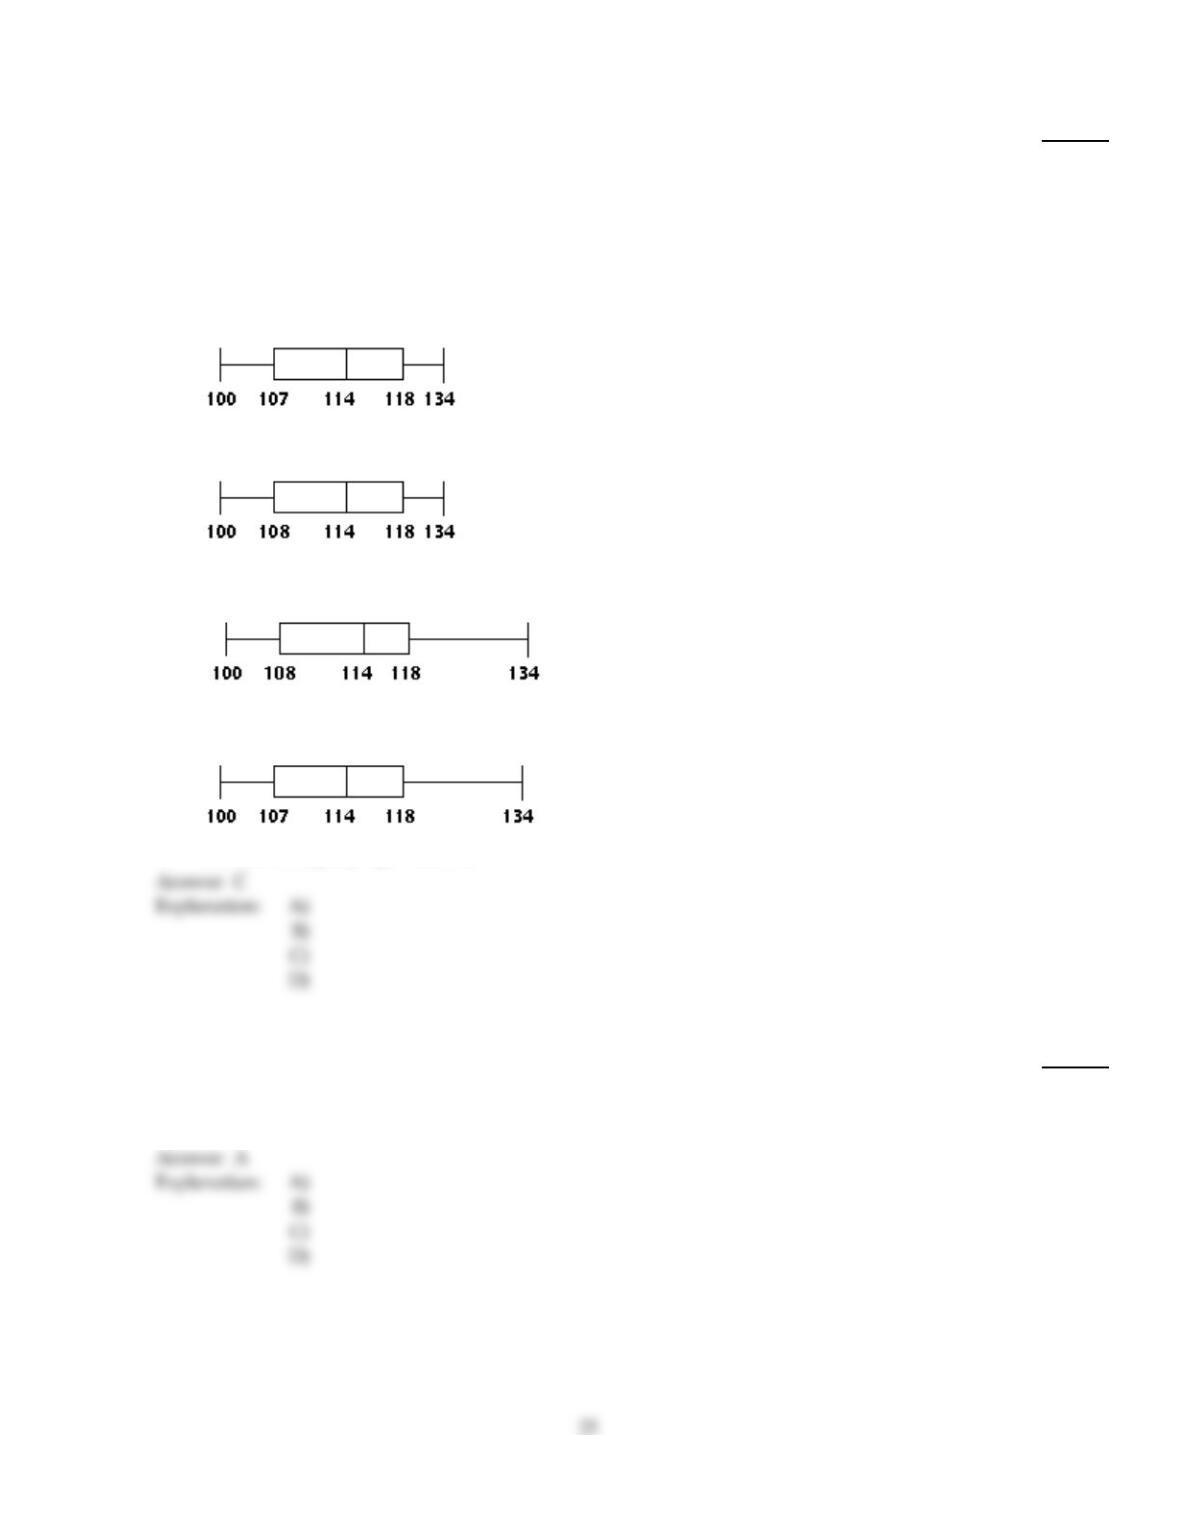
Construct and interpret a boxplot or a modified boxplot as specified.
87)
The highest temperatures ever recorded (in °F) in 32 different U.S. states are shown below.
Construct a boxplot for the data.
100 100 105 105 106 106 107 107
109 110 110 112 112 112 113 113
115 115 116 117 118 118 118 118
118 119 120 121 122 125 128 134
87)
A)
The data is fairly symmetrical.
B)
The data is fairly symmetrical.
C)
The data is slightly left–skewed.
D)
The data is slightly right–skewed.
Solve the problem.
88)
The mean of a set of data is 5.87 and its standard deviation is 2.10. Find the z–score for a value of
14.93.
Round your final answer to two decimal places.
88)
A)
4.31
B)
3.88
C)
4.61
D)
4.74
Use the empirical rule to solve the problem.
89)
The weights, in kilograms, of 60 randomly selected female school children from Country A, ages
12–15 years old, are presented in increasing order in the following table:
35.3 37.6 38.1 38.8 38.9 39.0 39.1 40.2 41.2
41.2 41.3 41.7 42.1 42.1 42.1 42.3 42.6 42.7
42.8 43.2 43.3 43.3 44.1 44.3 44.5 44.8 45.1
45.1 45.2 45.4 45.4 45.6 45.8 45.8 46.0 46.2
46.3 46.6 46.6 47.1 47.3 47.5 47.6 47.7 48.1
48.1 48.3 48.3 48.4 48.6 48.6 48.8 49.0 49.6
50.3 51.0 51.9 52.9 52.9 57.4
Note: The sample mean and sample standard deviation of these weights are, respectively, 45.19
and 4.19.
(i) Use the Empirical rule to estimate the percentages of the observations that lie within 1standard
deviation(s) to either side of the mean.
(ii) Use the data to obtain the exact percentages of the observations that lie within 1standard
deviation(s) to either side of the mean.
89)
A)
(i) Assuming that the weights have a roughly bell–shaped distribution, approximately 68%
of the observations should lie within 4.19 kg of the mean 45.19, or within the interval from
39.7 to 50.48;
(ii) 43 of the 60 observations 71.67% lie between 39.7 to 50.48.
B)
(i) Assuming that the weights have a roughly bell–shaped distribution, approximately 63%
of the observations should lie within 4.19 kg of the mean 45.19, or within the interval from 41
to 49.38;
(ii) 40 of the 60 observations 66.67% lie between 41 and 49.38.
C)
(i) Assuming that the weights have a roughly bell–shaped distribution, approximately 68%
of the observations should lie within 4.19 kg of the mean 45.19 or within the interval from 41
to 49.38;
(ii) 45 of the 60 observations (75%) lie between 41 and 49.38.
D)
(i) Assuming that the weights have a roughly bell–shaped distribution, approximately 63%
of the observations should lie within 4.19 kg of the mean 45.19, or within the interval from
40.5 to 49.68;
(ii) 45 of the 60 observations (75%) lie between 40.5 to 49.68.
Find the range for the given data set.
90)
Rich Borne is currently taking Chemistry 101. On the five laboratory assignments for the quarter, he
got the following scores.
24 31 12 47 52
90)
A)
7
B)
52
C)
40
D)
12
Provide an appropriate response.
91)
The heights of a group of professional basketball players are summarized in the frequency
distribution below. Find the standard deviation. Round your answer to one decimal place.
Height (in.) Frequency
70–under 72 3
72–under 74 7
74–under 76 16
76–under 78 12
78–under 80 10
80–under 82 4
82–under 84 1
91)
A)
3.3
B)
3.2
C)
2.9
D)
2.8
Find the mode(s) for the given sample data.
92)
The speeds (in mi/h) of the cars passing a certain checkpoint are measured by radar. The results are
shown below.
44.8 43.3 41.6 43.5 40.3
40.3 43.3 41.8 40.7 43.5
44.8 41.8 43.5 40.2 43.3
42.7 42.7 41.6 43.1 44.8
92)
A)
43.3 mi/hr
B)
43.87 mi/hr
C)
44.8 mi/hr
D)
44.8 mi/hr, 43.5 mi/hr, 43.3 mi/hr
Obtain the five–number summary for the given data.
93)
The weekly salaries (in dollars) of sixteen government workers are listed below.
690 610 813 640
728 574 484 619
521 677 685 464
543 787 503 826
93)
A)
464, 526.50, 629.5, 718.5, 826 dollars
B)
464, 532.0, 629.5, 709, 826 dollars
C)
464, 521, 619, 690, 826 dollars
D)
464, 526.50, 619, 718.5, 826 dollars
Find the mean for the given sample data. Unless otherwise specified, round your answer to one more decimal place than
that used for the observations.
94)
The normal monthly precipitation (in inches) for August is listed for 20 different U.S. cities. Find
the mean of the data.
3.5 1.6 2.4 3.7 4.1
3.9 1.0 3.6 4.2 3.4
3.7 2.2 1.5 4.2 3.4
2.7 0.4 3.7 2.0 3.6
94)
A)
2.8 in.
B)
2.94 in.
C)
3.09 in.
D)
3.27 in.
Provide an appropriate response.
95)
Obtain the population standard deviation, , for the given data. Assume that the data represent
population data. Round your final answer to one more decimal place than that used for the
observations.
The number of years of teaching experience is given below for 12 high–school teachers.
28 25 26 26 12 19
17 8 5 13 22 31
95)
A)
8.0 yr
B)
64.4 yr
C)
10.2 yr
D)
8.4 yr
96)
Which score has a higher relative position, a score of 67.2 on a test with a mean of 60 and
a standard deviation of 6, or a score of 249.6 on a test with a mean of 240 and a a standard
deviation of 24? (Assume that the distributions being compared have approximately the same
shape.)
96)
A)
A score of 67.2
B)
A score of 249.6
C)
Both scores have the same relative position.
Construct and interpret a boxplot or a modified boxplot as specified.
97)
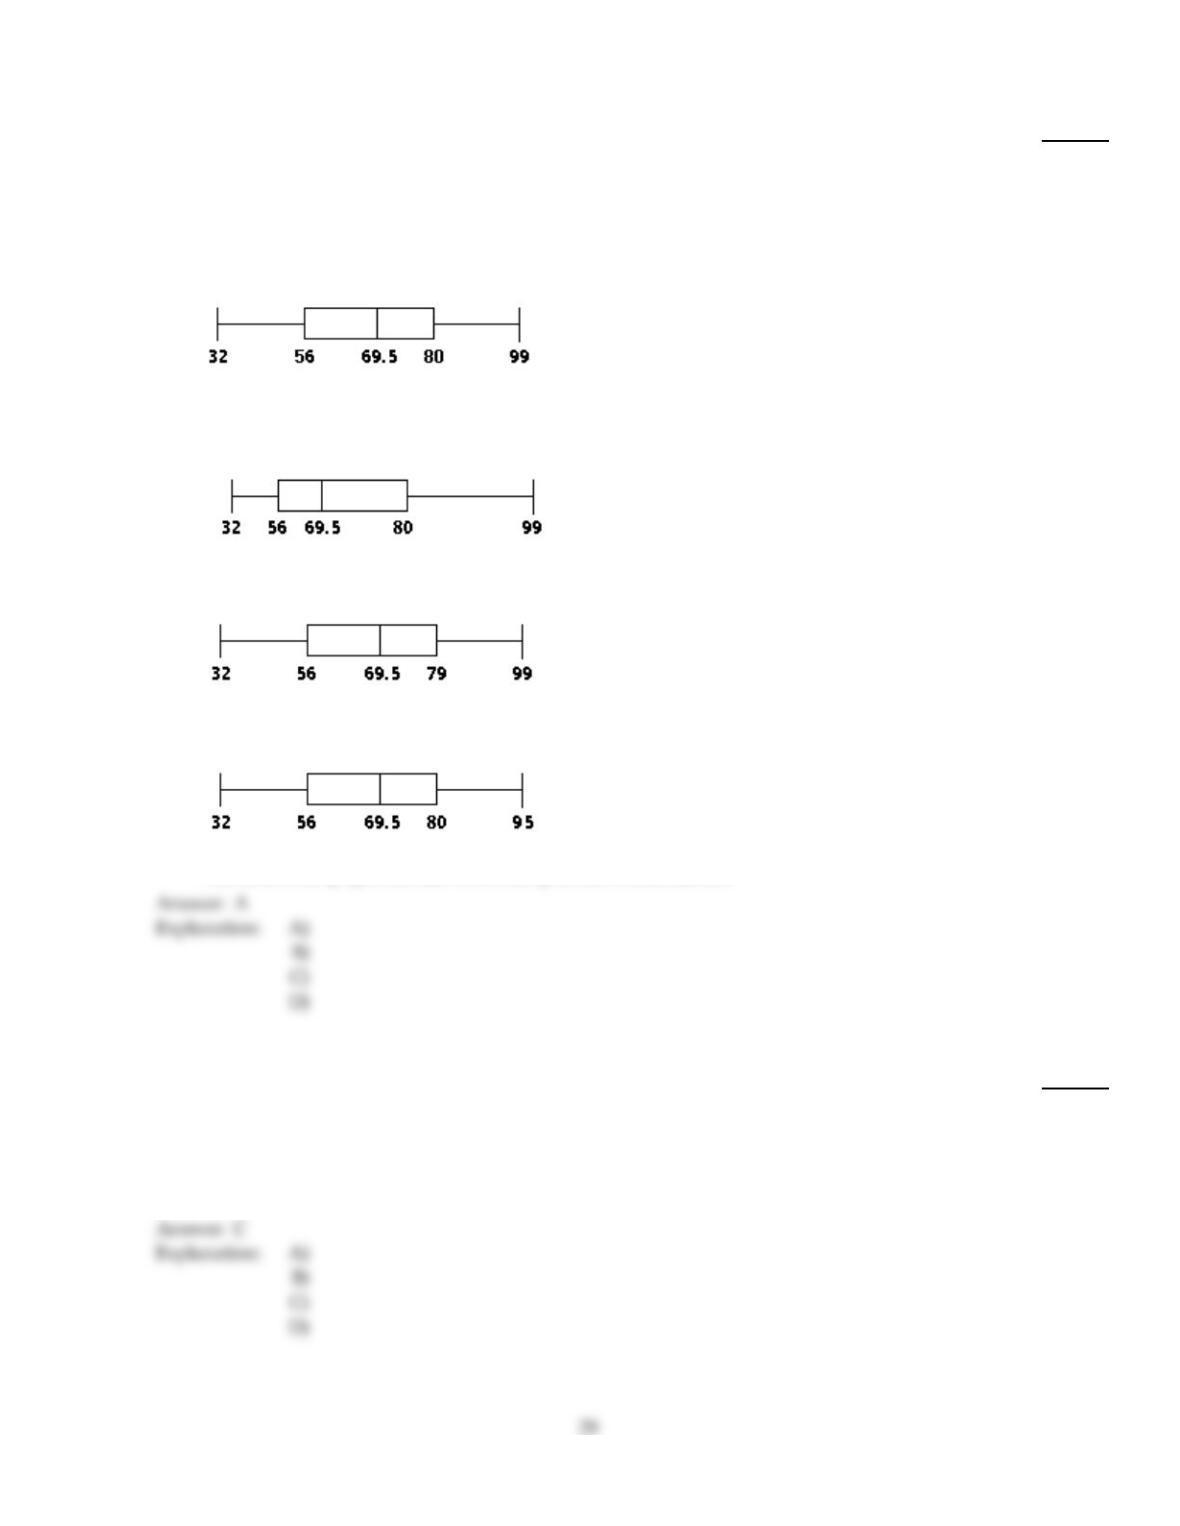
The test scores of 32 students are listed below. Construct a boxplot for the data.
32 37 41 44 46 48 53 55
57 57 59 63 65 66 68 69
70 71 74 74 75 77 78 79
81 82 83 86 89 92 95 99
97)
A)
The data is fairly symmetrical. It is a fairly uniform distribution.
B)
The data is highly right–skewed
C)
The data is left–skewed.
D)
The data is fairly symmetrical. It is a fairly uniform distribution.
Find the range for the given data set.
98)
A class of sixth grade students kept accurate records on the amount of time they spent playing
video games during a one–week period. The times (in hours) are listed below.
13.8 17.2 8.1 13.3 25.8
28.0 24.3 12.1 25.0 26.6
98)
A)
25.8 hr
B)
3.4 hr
C)
19.9 hr
D)
8.1 hr
Use the empirical rule to solve the problem.
99)
The systolic blood pressure of 18–year–old women is a roughly bell–shaped distribution with a
mean of 120 mmHg and a standard deviation of 12 mmHg. What percentage of 18–year–old
women have a systolic blood pressure between 96 mmHg and 144 mmHg?
99)
A)
68%
B)
95%
C)
99.99%
D)
99.7%
Obtain the five–number summary for the given data.
100)
2, 3, 5, 8, 10
100)
A)
2, 2.5, 5, 7.5, 10
B)
2, 3.5, 5, 8.5, 10
C)
2, 2, 5, 10, 10
D)
2, 3, 5, 8, 10
Find the mean for the given sample data. Unless otherwise specified, round your answer to one more decimal place than
that used for the observations.
101)
The grocery expenses for six families were $66.15, $58.95, $58.84, $46.06, $47.63, and $44.03.
Compute the mean grocery bill. Round your answer to the nearest cent.
101)
A)
$53.61
B)
$52.33
C)
$64.33
D)
$80.42
Provide an appropriate response.
102)
Find the population standard deviation. Round to one decimal place as needed.
1, –1, 5, 7
102)
A)
10
B)
1.8
C)
3.2
D)
8.2
Find the median for the given sample data.
103)
The number of vehicles passing through a bank drive–up line during each 15–minute period was
recorded. The results are shown below.
22 24 22 25
25 22 27 24
32 28 28 26
21 28 22 17
12 24 24 24
103)
A)
28 vehicles
B)
23.85 vehicles
C)
24 vehicles
D)
25 vehicles
Construct and interpret a boxplot or a modified boxplot as specified.
104)
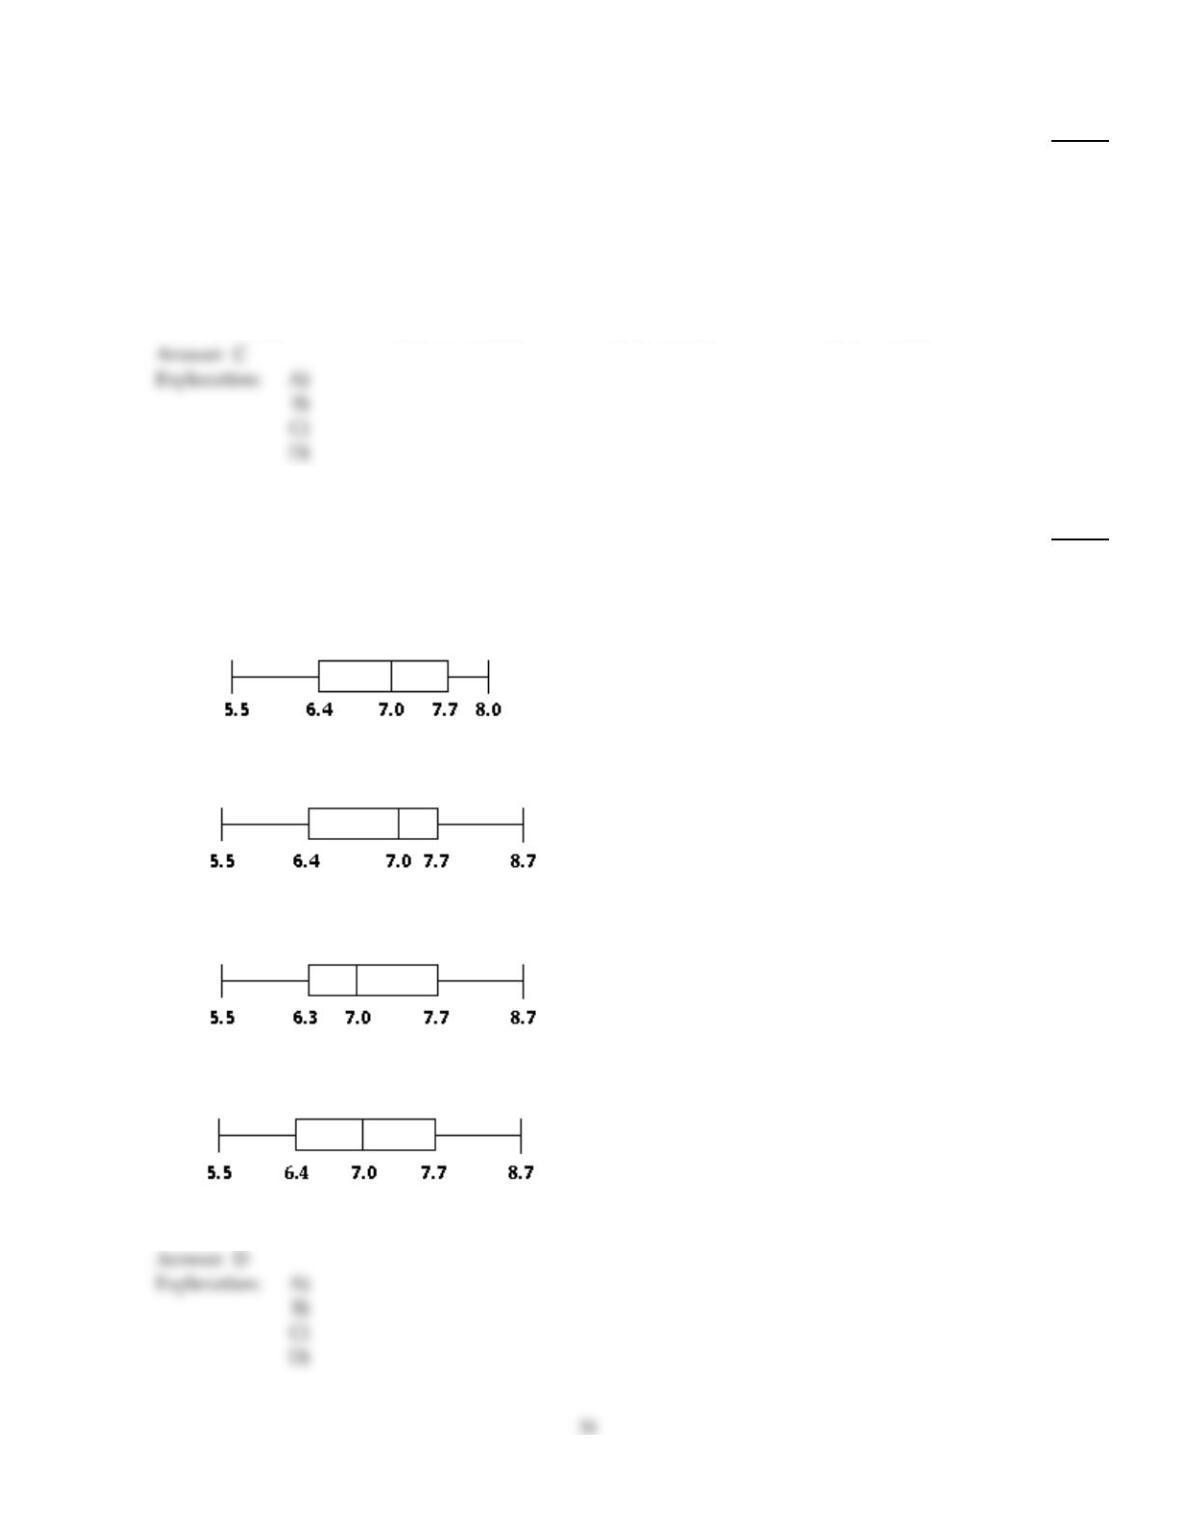
The weights (in pounds) of 30 newborn babies are listed below. Construct a boxplot for the data.
5.5 5.7 5.8 5.9 6.1 6.1 6.3 6.4 6.5 6.6
6.7 6.7 6.7 6.9 7.0 7.0 7.0 7.1 7.2 7.2
7.4 7.5 7.7 7.7 7.8 8.0 8.1 8.1 8.3 8.7
104)
A)
The data is slightly left–skewed.
B)
The data is left–skewed.
C)
The data is slightly right–skewed.
D)
The data is highly symmetrical. It is a uniform distribution.
Determine the quartile or interquartile range as specified.
105)
The normal annual precipitation (in inches) is given below for 21 different U.S. cities. Find the first
quartile, Q1.
39.1 16.2 25.4 18.3 27.1 27.8 30.6
15.6 42.6 18.3 13.9 19.2 32.3 10.6
14.1 33.6 12.6 35.0 22.3 11.9 51.7
105)
A)
14.475 in.
B)
14.1 in.
C)
15.6 in.
D)
14.85 in.
Solve the problem.
106)
A meteorological office keeps records of the annual precipitation in different cities. For one city, the
mean annual precipitation is 27.2 and the standard deviation of the annual precipitation amounts is
4.2. Let x represent the annual precipitation in that city. Determine the standardized version of x.
106)
A)
x =z –27.2
4.2
B)
z =x –27.2
4.2
C)
z =x –4.2
27.2
D)
z = – 27.2
4.2
107)
A sample of 52 books has a mean cost of $97.26 and a standard deviation of $4.10. Use this
information and the special cases of Chebychev’s rule to complete the statements below:
(i) At least 39 of the 52 books cost between ___________ and ___________;
(ii) At least ____________ of the 52 books cost between $84.96 and $109.56.
107)
A)
(i) $84.96, $109.56
(ii) 40
B)
(i) $93.16, $101.36
(ii) 47
C)
(i) $87.01, $107.51
(ii) 43
D)
(i) $89.06, $105.46
(ii) 47
108)
A variable x has the possible observations shown below.
Possible observations of x: –3 –1 0 1 1 2 4 4 5
Find the z–score corresponding to an observed value of x of –1.
Round the values of µ and to one decimal place. Round your final answer to two decimal places.
108)
A)
0.96
B)
–0.96
C)
–0.92
D)
2.57
Provide an appropriate response.
109)
The manager of a bank recorded the amount of time each customer spent waiting in line during
peak business hours one Monday. The frequency distribution below summarizes the results. Find
the standard deviation. Round your answer to one decimal place.
Waiting time
(minutes)
Number of
customer
0–under 4 14
4–under 8 14
8–under 12 12
12–under 16 8
16–under 20 0
20–under 24 2
109)
A)
4.9
B)
7.0
C)
5.1
D)
5.4
Find the range and standard deviation for each of the two samples, then compare the two sets of results.
110)
When investigating times required for drive–through service, the following results (in seconds)
were obtained.
Restaurant A 120 123 153 128 124 118 154 110
Restaurant B 115 126 147 156 118 110 145 137
110)
A)
Restaurant A: 46; 16.9
Restaurant B: 44; 16.2
Both measures indicate there is more variation in the data for restaurant A than the data for
restaurant B.
B)
Restaurant A: 44; 16.2
Restaurant B: 46; 16.9
Both measures indicate there is more variation in the data for restaurant B than the data for
restaurant A.
C)
Restaurant A: 46; 16.2
Restaurant B: 44; 16.9
It is inconclusive as to which data set has more variation.
D)
Restaurant A: 44; 16.1
Restaurant B: 46; 16.9
Both measures indicate there is more variation in the data for restaurant B than the data for
restaurant A.
Provide an appropriate response.
111)
Find the z–score corresponding to the given value and use the z–score to determine whether the
value is unusual. Consider a score to be unusual if it is at least three standard deviations above or
below the mean. Round to the z–score to two decimal places, if necessary.
A department store, on average, has daily sales of $28,622.76. The standard deviation of sales is $
1500. On Tuesday, the store sold $36,768.74 worth of goods.
111)
A)
5.70, not unusual
B)
5.74, unusual
C)
5.43, unusual
D)
4.34, not unusual
112)
Obtain the population standard deviation, , for the given data. Assume that the data represent
population data. Round your final answer to one more decimal place than that used for the
observations.
The normal annual precipitation (in inches) is given below for 8 different U.S. cities.
7.4 14.9 7.8 17.1
11.2 10.7 14.6 15.9
112)
A)
11.99 in.
B)
3.70 in.
C)
5.99 in.
D)
3.46 in.
Obtain the five–number summary for the given data.
113)
Here are the average mathematics achievement scores for ninth graders in 32 counties.
605 585 574 572 569 565 564 556
547 534 531 528 525 524 519 518
490 480 478 475 471 465 458 452
427 410 409 389 380 382 355 331
113)
A)
331, 427, 427, 547, 605
B)
331, 452, 504, 556, 605
C)
331, 427, 518, 547, 605
D)
331, 439.5, 504, 551.5, 605
Determine the quartile or interquartile range as specified.
114)
The test scores of 19 students are listed below. Find the third quartile, Q3.
36 45 49 53 55
56 59 61 62 65
68 73 74 78 82
86 90 92 97
114)
A)
79.00
B)
15
C)
82
D)
80.0
Find the median for the given sample data.
115)
4, 10, 18, 29, 33, 43, 50
115)
A)
27
B)
18
C)
33
D)
29
Use the empirical rule to solve the problem.
116)
The amount of Jen’s monthly phone bill has a roughly bell–shaped distribution with a mean of $70
and a standard deviation of $12. What percentage of her phone bills are between $34 and $106?
116)
A)
99.7%
B)
99.99%
C)
95%
D)
68%
Provide an appropriate response.
117)
Find the z–score corresponding to the given value and use the z–score to determine whether the
value is unusual. Consider a score to be unusual if it is at least three standard deviations above or
below the mean. Round the z–score to one decimal place, if necessary.
A weight of 240 pounds among a population having a mean weight of 168 pounds and a standard
deviation of 22.5 pounds.
117)
A)
3.2; unusual
B)
–3.2; not unusual
C)
3.2; not unusual
D)
72.0; unusual
118)
Find the z–score corresponding to the given value and use the z–score to determine whether the
value is unusual. Consider a score to be unusual if it is at least three standard deviations above or
below the mean. Round the z–score to one decimal place, if necessary.
A body temperature of 96.0° F given that human body temperatures have a mean of 98.20° F and a
standard deviation of 0.62°.
118)
A)
3.6; not unusual
B)
–3.6; not unusual
C)
–3.6; unusual
D)
–2.2; not usual
Find the sample standard deviation for the given data. Round your final answer to one more decimal place than that used
for the observations.
119)
To get the best deal on a CD player, Tom called eight appliance stores and asked the cost of a
specific model. The prices he was quoted are listed below:
$142 $205 $303 $429 $140 $384 $330 $209
119)
A)
$573,520.5
B)
$109.6
C)
$657,676.0
D)
$174.5
Find the mode(s) for the given sample data.
120)
The table shows the country represented by the winner of the 10,000 meter run in the Summer
Olympic Games in various years.
Year Country
1912 Finland
1920 Finland
1924 Finland
1928 Finland
1932 Poland
1936 Finland
1948 Czechoslovakia
1952 Czechoslovakia
1956 USSR
1960 USSR
1964 United States
1968 Kenya
1972 Finland
1976 Finland
1980 Ethiopia
1984 Italy
1988 Morocco
1992 Morocco
Find the mode of the country data.
120)
A)
Finland
B)
7
C)
Morocco
D)
1912
Solve the problem.
121)
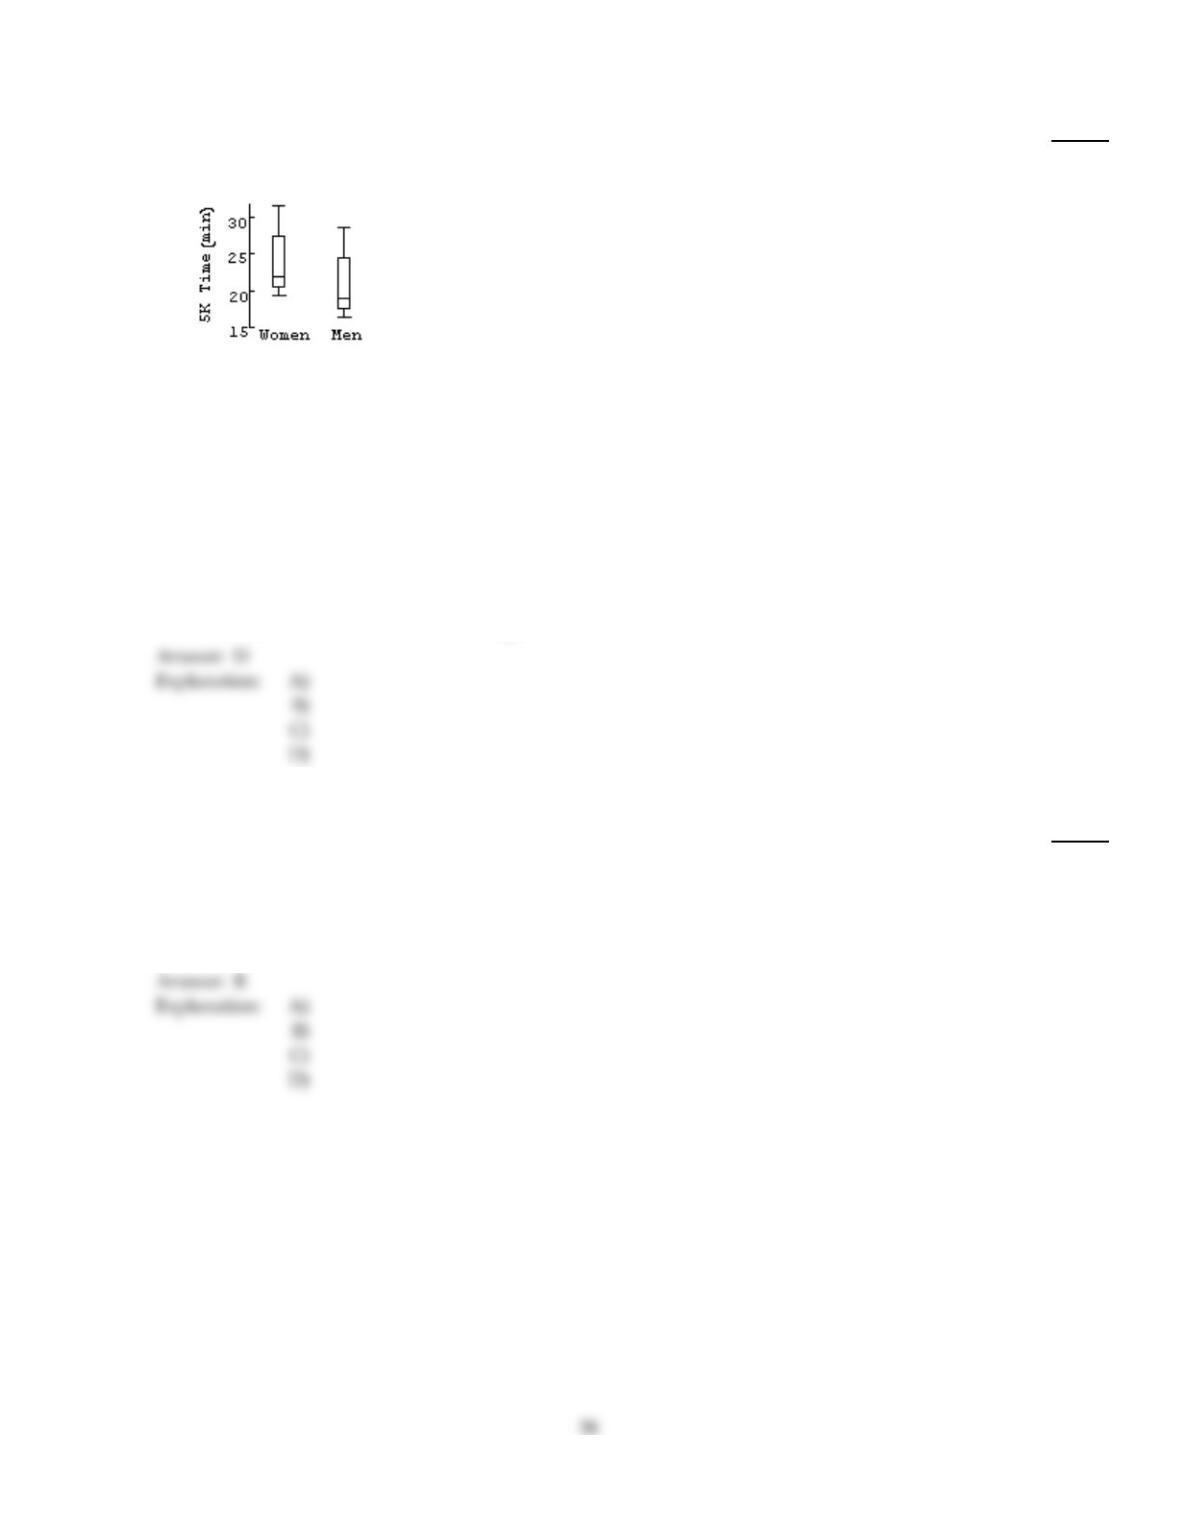
Do men and women run a 5 kilometer race at the same pace? Here are boxplots of the time (in
minutes) for a race recently run in Chicago. Write a brief report discussing what these data show.
121)
A)
Men appear to run about 10 minutes faster than women, but the two distributions have very
similar variation both in the middle 50% and for the entire distribution. Both distributions are
right–skewed.
B)
Men appear to run about 3 minutes faster than women, and the two distributions have
different IQR.
C)
On examination of the median values, women appear to run about 3 minutes faster than men,
but the two distributions have very similar variation both in the middle 50% and for the entire
distribution. Both distributions are right–skewed.
D)
On examination of the median values, men appear to run about 3 minutes faster than women,
but the two distributions have very similar variation both in the middle 50% and for the entire
distribution. Both distributions are right–skewed.
Find the median for the given sample data.
122)
A new business had the following monthly net gains:
$6691 $1705 $2037 $6965 $8912
$3961 $2214 $6431 $5163 $5362
122)
A)
$4944.10
B)
$5262.50
C)
$5493.44
D)
$5163.00
Provide an appropriate response.
123)
Obtain the population standard deviation, , for the given data. Assume that the data represent
population data. Round your final answer to one more decimal place than that used for the
observations.
The weekly salaries (in dollars) of seven government workers are listed below
892 613 906 906 842 465 942
123)
A)
$169.0
B)
$28,555.0
C)
$1137.1
D)
$182.5
Determine the quartile or interquartile range as specified.
124)
Find Q3.
1, 3, 6, 7, 10, 1, 3, 6, 7, 10
124)
A)
6
B)
7
C)
7.5
D)
10
Solve the problem.
125)
The ages of the members of a gym have a mean of 46 years and a standard deviation of 12 years.
What can you conclude from Chebyshev’s theorem about the percentage of gym members aged
between 24.4 and 67.6?
125)
A)
The percentage is at least 44.4%
B)
The percentage is at least 69.1%
C)
The percentage is at most 69.1%
D)
The percentage is approximately 44.4%
Provide an appropriate response.
126)
Find the z–score corresponding to the given value and use the z–score to determine whether the
value is unusual. Consider a score to be unusual if it is at least three standard deviations above or
below the mean. Round the z–score to one decimal place, if necessary.
A test score of 88.0 on a test having a mean of 70 and a standard deviation of 10.
126)
A)
1.8; not unusual
B)
18; unusual
C)
–1.8; not unusual
D)
1.8; unusual
Solve the problem. If necessary, round your answer to one more decimal place than that used for the observations.
127)
The amount of precipitation (in inches) in the month of January is given below for a number of
different U.S. cities. Find xi.
4.8 1.7 3.4 1.0 1.3
1.6 1.1 4.4 3.3 0.5
127)
A)
23.3
B)
23.1
C)
22.9
D)
23.6
Solve the problem.
128)
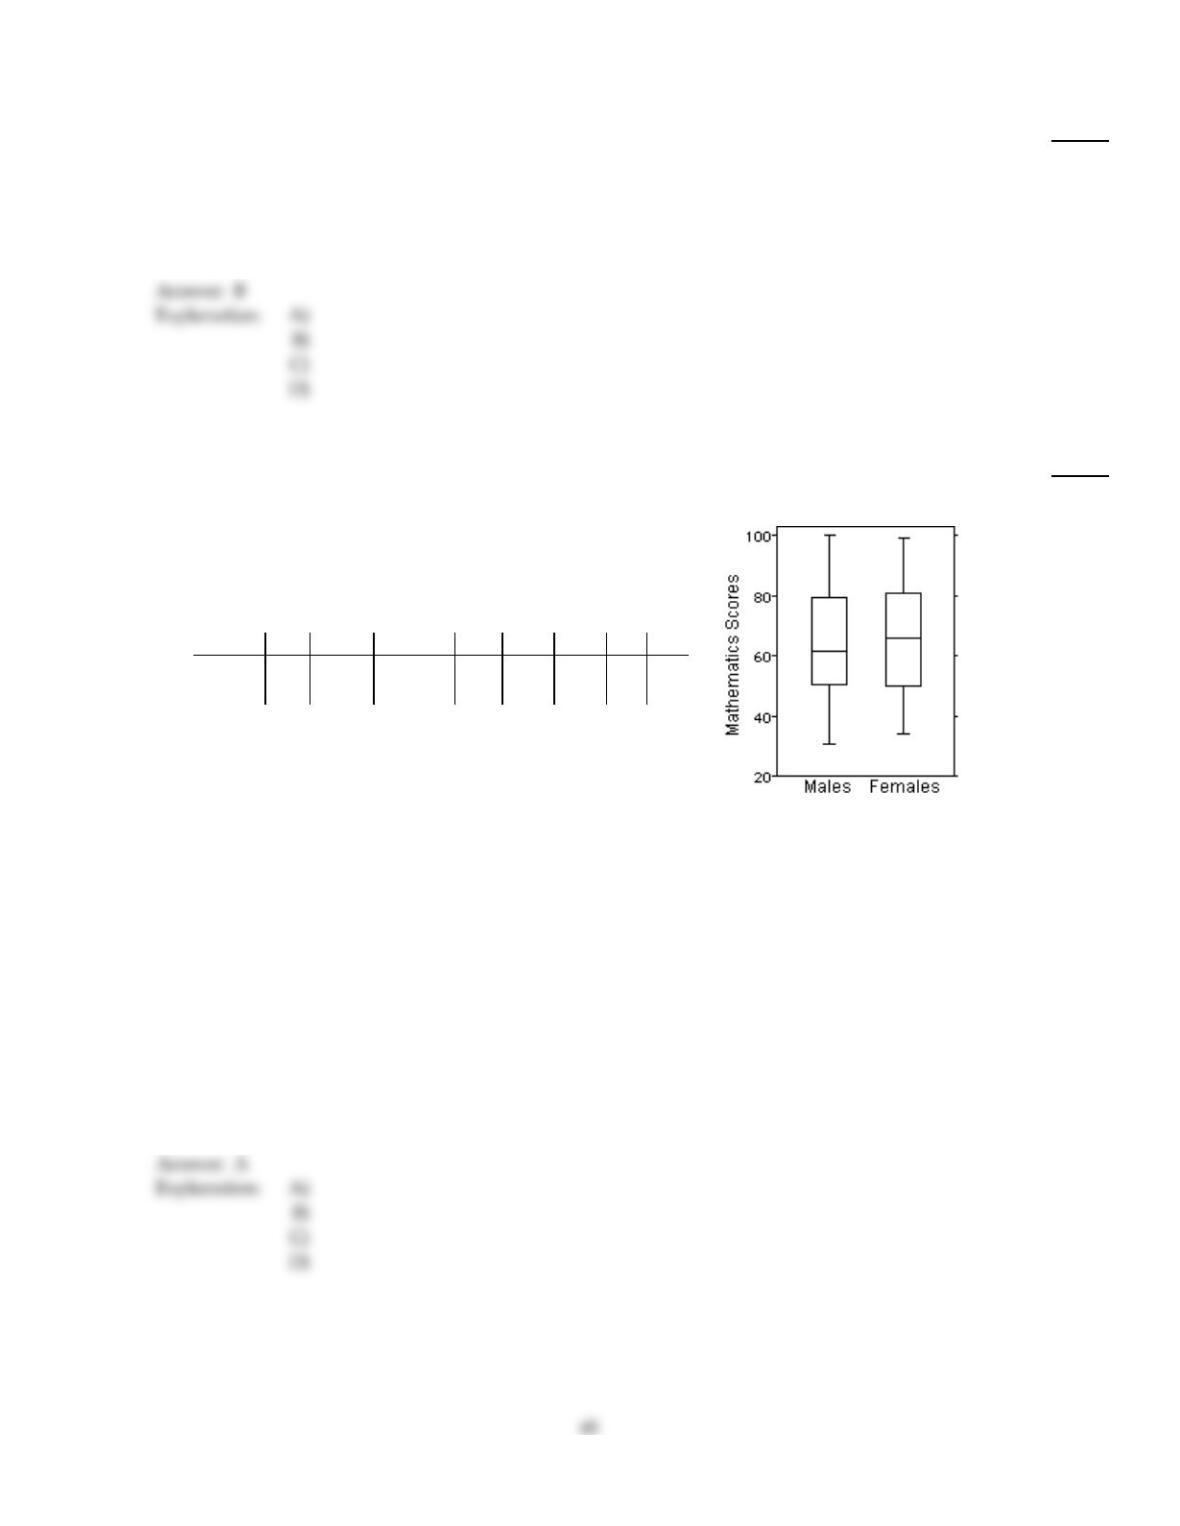
Here are the summary statistics for mathematics scores for one high–school graduating class, and
the parallel boxplots comparing the scores of male and female students. Write a brief report on
these results. Be sure to discuss center and variation.
n Mean Median SD Min Max Q1 Q3
Male 17 60 63 18.6 30 100 52 78
Female 18 65 66 17.7 36 98 50 80
128)
A)
Median score by females at 66 points is 3 points higher than that by males. The middle 50%
for both group is close with a IQR at 26 for the males and 30 for the females. The males have a
larger range from 30 to 100. The distribution is slightly right–skewed for the males and
symmetric for the females.
B)
Median score by females at 66 points is 3 points higher than that by males. The middle 50%
for both group is close with a IQR at 26 for the males and 30 for the females. The males have a
smaller range from 36 to 98. Both distributions are left–skewed.
C)
Median score by females at 66 points is 3 points higher than that by males. The middle 50%
for both group is close with a IQR at 26 for the males and 30 for the females. The males have a
larger range from 30 to 100. Both distributions are right–skewed.
D)
Median score by females at 66 points is 3 points higher than that by males. The middle 50%
for both group is close with a IQR at 30 for the males and 26 for the females. The males have a
smaller range from 36 to 98. The distribution is right–skewed for the males and symmetric for
the females.