Provide an appropriate response.
38)
Suppose that a group of professional athletes consists of 100 gymnasts and 100 basketball
players. What kind of distribution do you think the heights of the athletes would have?
Explain your thinking.
38)
39)
Suppose that you want to construct a graph to represent the following data.
Blood Type Frequency
O90
A84
B18
AB 8
If you are mostly interested in the number of people in each category as a percentage of the
total number of people, would a bar chart or a pie chart be more useful? Explain your
thinking.
39)
Construct the requested histogram.
40)
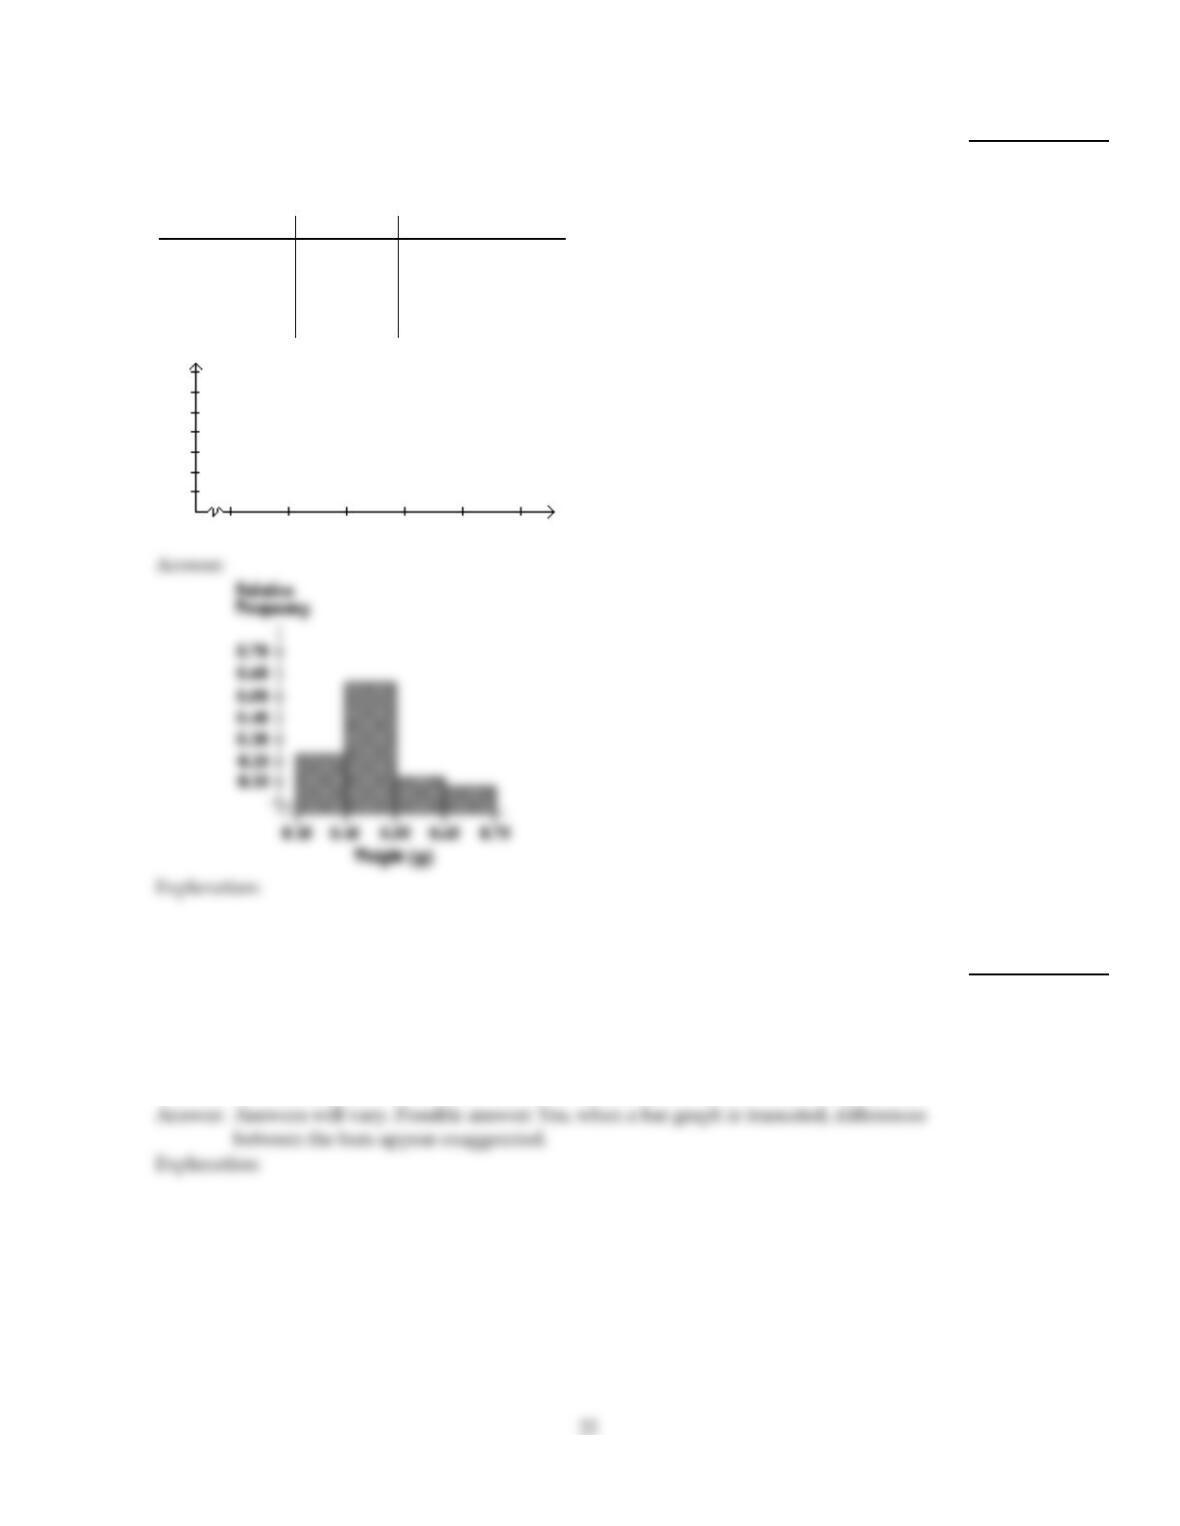
During the quality control process at a manufacturing plant, 142 finished items are
randomly selected and weighed. The results are summarized in the table below. Construct
a relative–frequency histogram corresponding to data below.
Weight (g) Frequency Relative frequency
0.35–under 0.45 32 0.225
0.45–under 0.55 82 0.577
0.55–under 0.65 17 0.120
0.65–under 0.75 11 0.077
40)
Provide an appropriate response.
41)
The mayor of one city has been conducting an anti–smoking campaign in high schools.
Each year local government researchers estimate the number of teenagers in the city who
smoke. The number of smokers has declined steadily in each of the past five years. The
mayor’s office constructs a bar graph showing the number of teenage smokers in each of
the past five years. If the mayor wished to exaggerate the success of his anti–smoking
campaign, would it be to his advantage to truncate the bar graph? Explain your thinking.
41)
42)
Suppose that you wish to construct a stem–and–leaf diagram for the data set below. What
would the stems be?
98 103 146 118 92 128 135 141 136
143 126 111 109 97 124 147 114 119
140 122 92 130 101 148 138 90 123
42)
43)
Hospital records show the age at death of patients who die while in the hospital. A
frequency histogram is constructed for the age at death of the people who have died at the
hospital in the past five years. Roughly what shape would you expect for the distribution?
Why?
43)
Use limit grouping to organize these data into a frequency distribution.
44)
Kevin asked some of his friends how many hours they had worked during the previous
week at their after–school jobs. The results are shown below.
5 6 5 4 5 5 9 8 5 3 8 6
6 8 5 6 8 5 6 8 6 8 8 4
Construct a frequency distribution. Use 4 classes, a class width of 2 hours, and a lower limit
of 3 for the first class.
Hours Frequency
44)
Provide an appropriate response.
45)
Maria constructed the frequency distribution shown below. The data represent the heights
of 60 randomly selected women.
Height Frequency
54–under 60 7
60–under 61 1
61–under 62 3
62–under 63 5
63–under 64 7
64–under 65 7
65–under 66 6
66–under 72 24
She concluded from her frequency distribution that the heights 66, 67, 68, 69, 70,
and 71 inches are the most common for women. What is wrong with her conclusion? How
is her frequency distribution misleading and how could the table be improved?
45)
46)
For a given data set, why might a researcher prefer to study organized data rather than the
original data? Can you think of any circumstances in which a researcher may prefer to use
the original data rather than organized data?
46)
47)
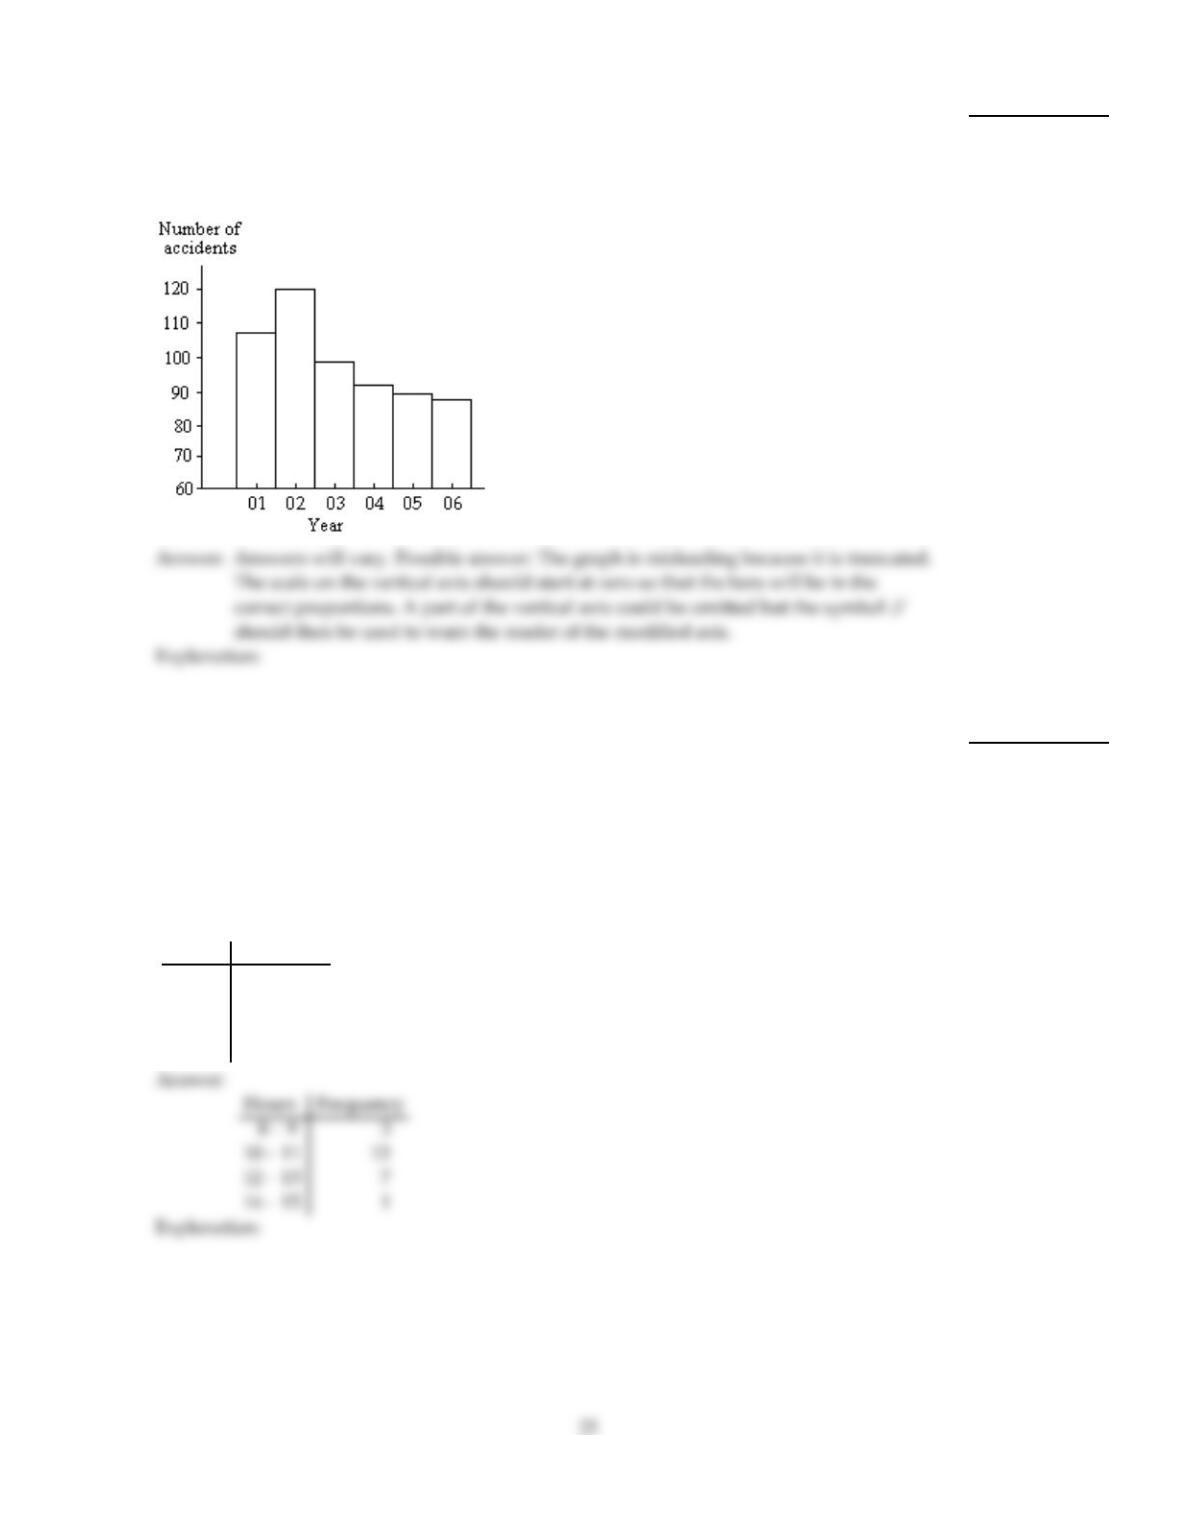
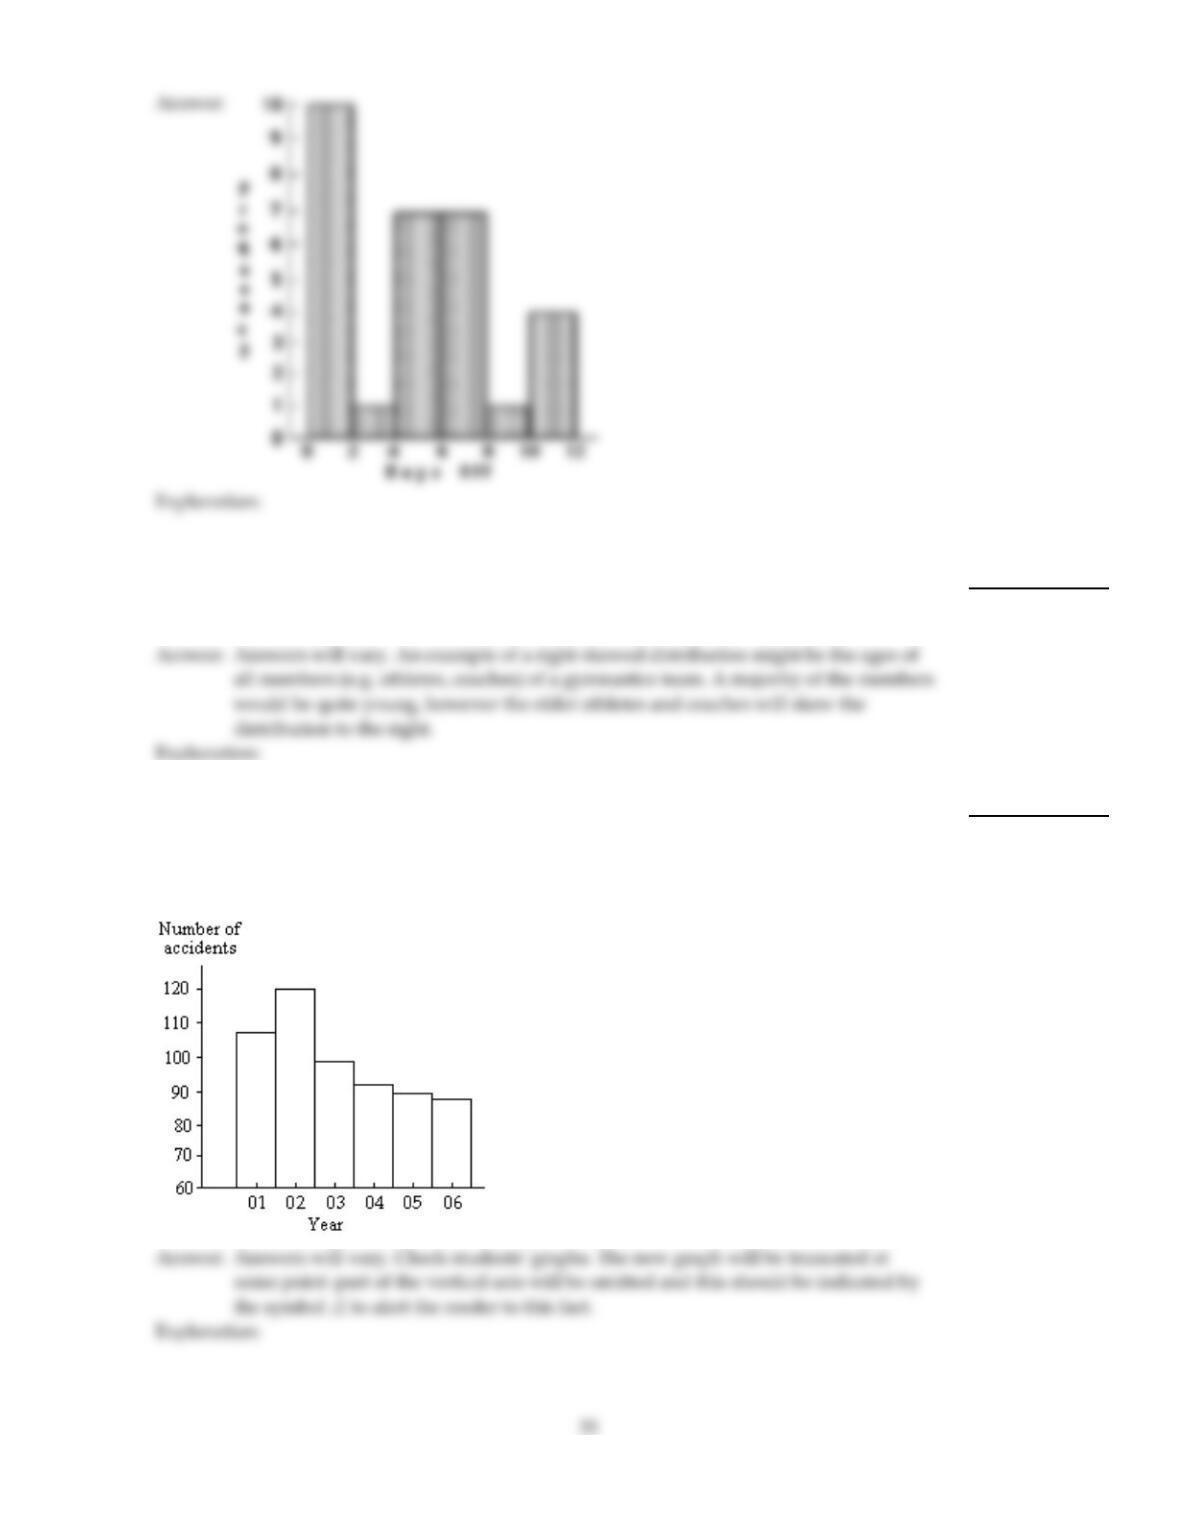
The bar graph below shows the number of car accidents occurring in one city in each of the
years 2001 through 2006. The number of accidents dropped in 2003 after a new speed limit
was imposed. Why is the graph misleading? How would you redesign the graph to be less
misleading?
47)
Use limit grouping to organize these data into a frequency distribution.
48)
Lori asked 24 students how many hours they had spent doing homework during the
previous week. The results are shown below.
10 11 10 810 10 14 12 10 912 11
11 12 10 11 12 10 11 12 11 12 12 8
Construct a frequency distribution. Use 4 classes, a class width of 2 hours, and a lower limit
of 8 for the first class.
Hours Frequency
48)
Provide an appropriate response.
49)
A population has a J–shaped distribution. Two different samples of size 12 are picked from
the population. Two different samples of size 1000 are then picked from the population.
Do you think that the distribution of the two samples of size 12 will have roughly the same
shape? Do you think that the distribution of the two samples of size 1000 will have roughly
the same shape? Explain your thinking.
49)
50)
The preschool children at Elmwood Elementary School were asked to name their favorite
color. The results are listed below. Construct a frequency distribution and a relative
frequency distribution.
yellow yellow green blue purple
purple purple yellow purple green
purple green blue blue blue
green purple blue purple red
50)
Construct the requested histogram.
51)
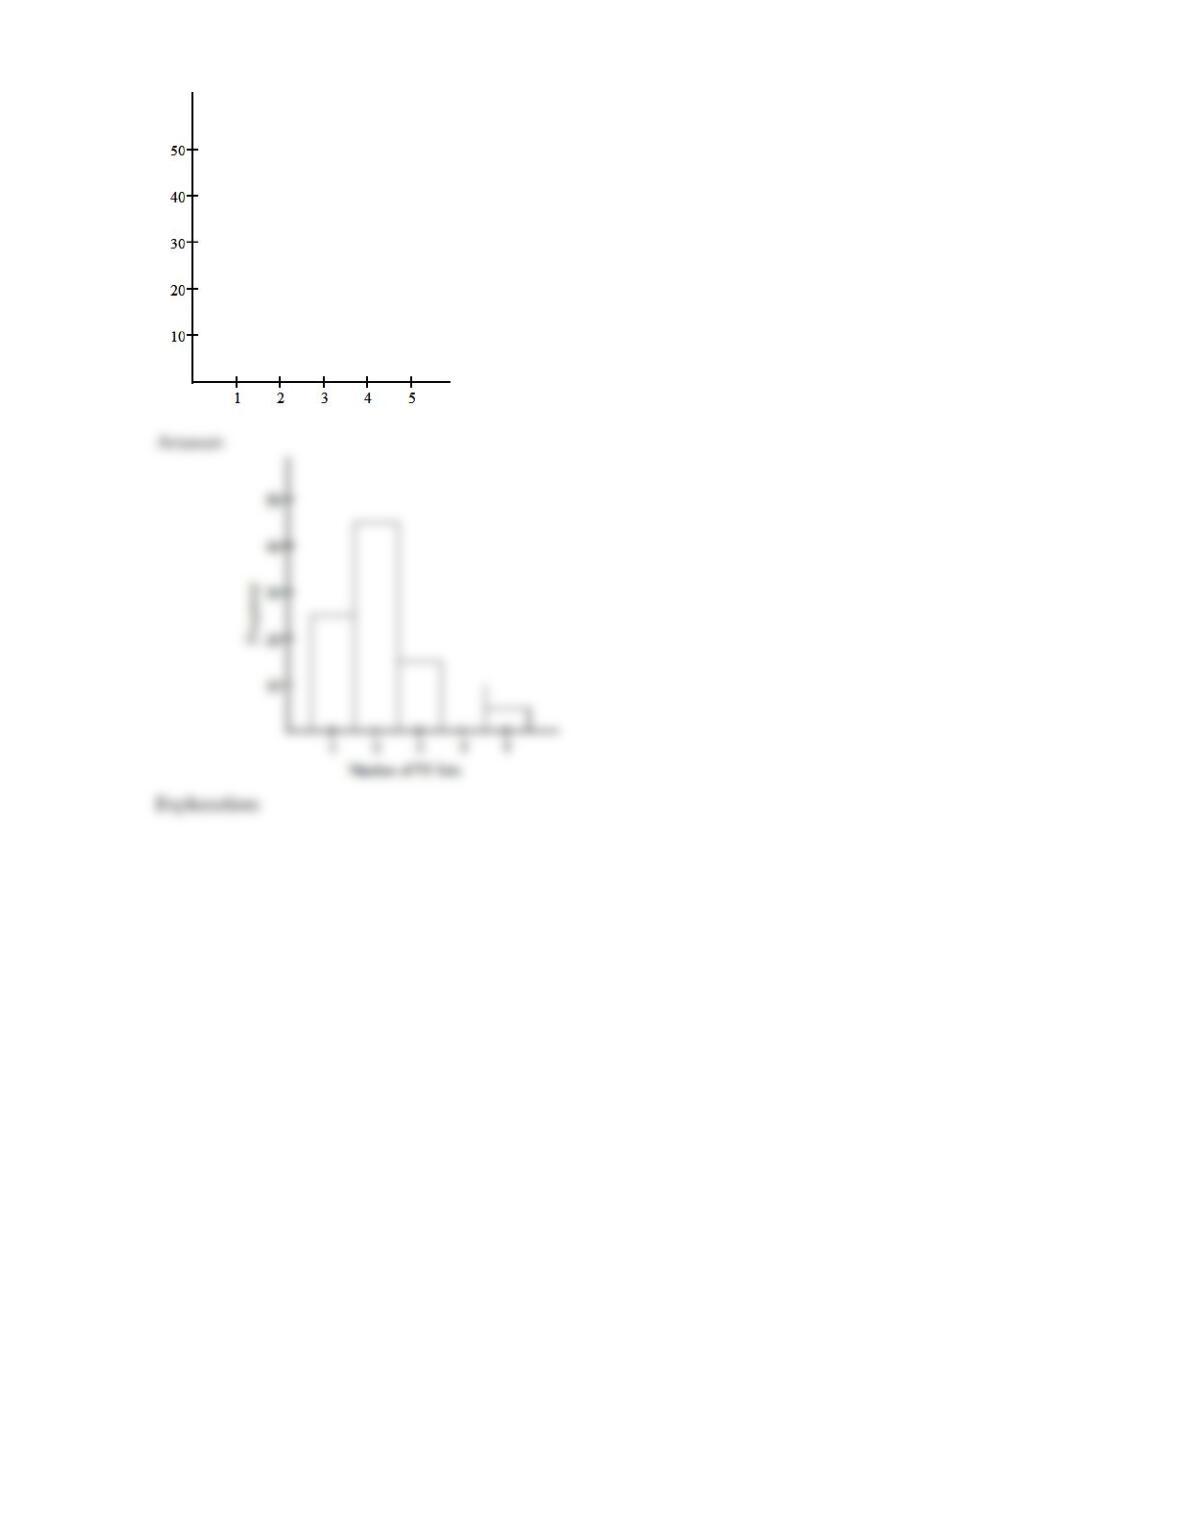
The table gives the frequency distribution for the data involving the number of television
sets per household for a sample of 100 U.S. households.
# of TVs Frequency
1 25
2 45
3 15
4 10
5 5
Construct a frequency histogram.
51)
26
27
Use cutpoint grouping to organize these data into a frequency distribution.
52)
The following figures represent Jennifer’s monthly charges for long distance telephone
calls for the past twelve months.
9.80 12.23 13.47 18.16
11.19 18.36 9.57 14.55
13.17 14.41 15.02 10.40
Construct a frequency distribution with 4 classes.
Charges Frequency
52)
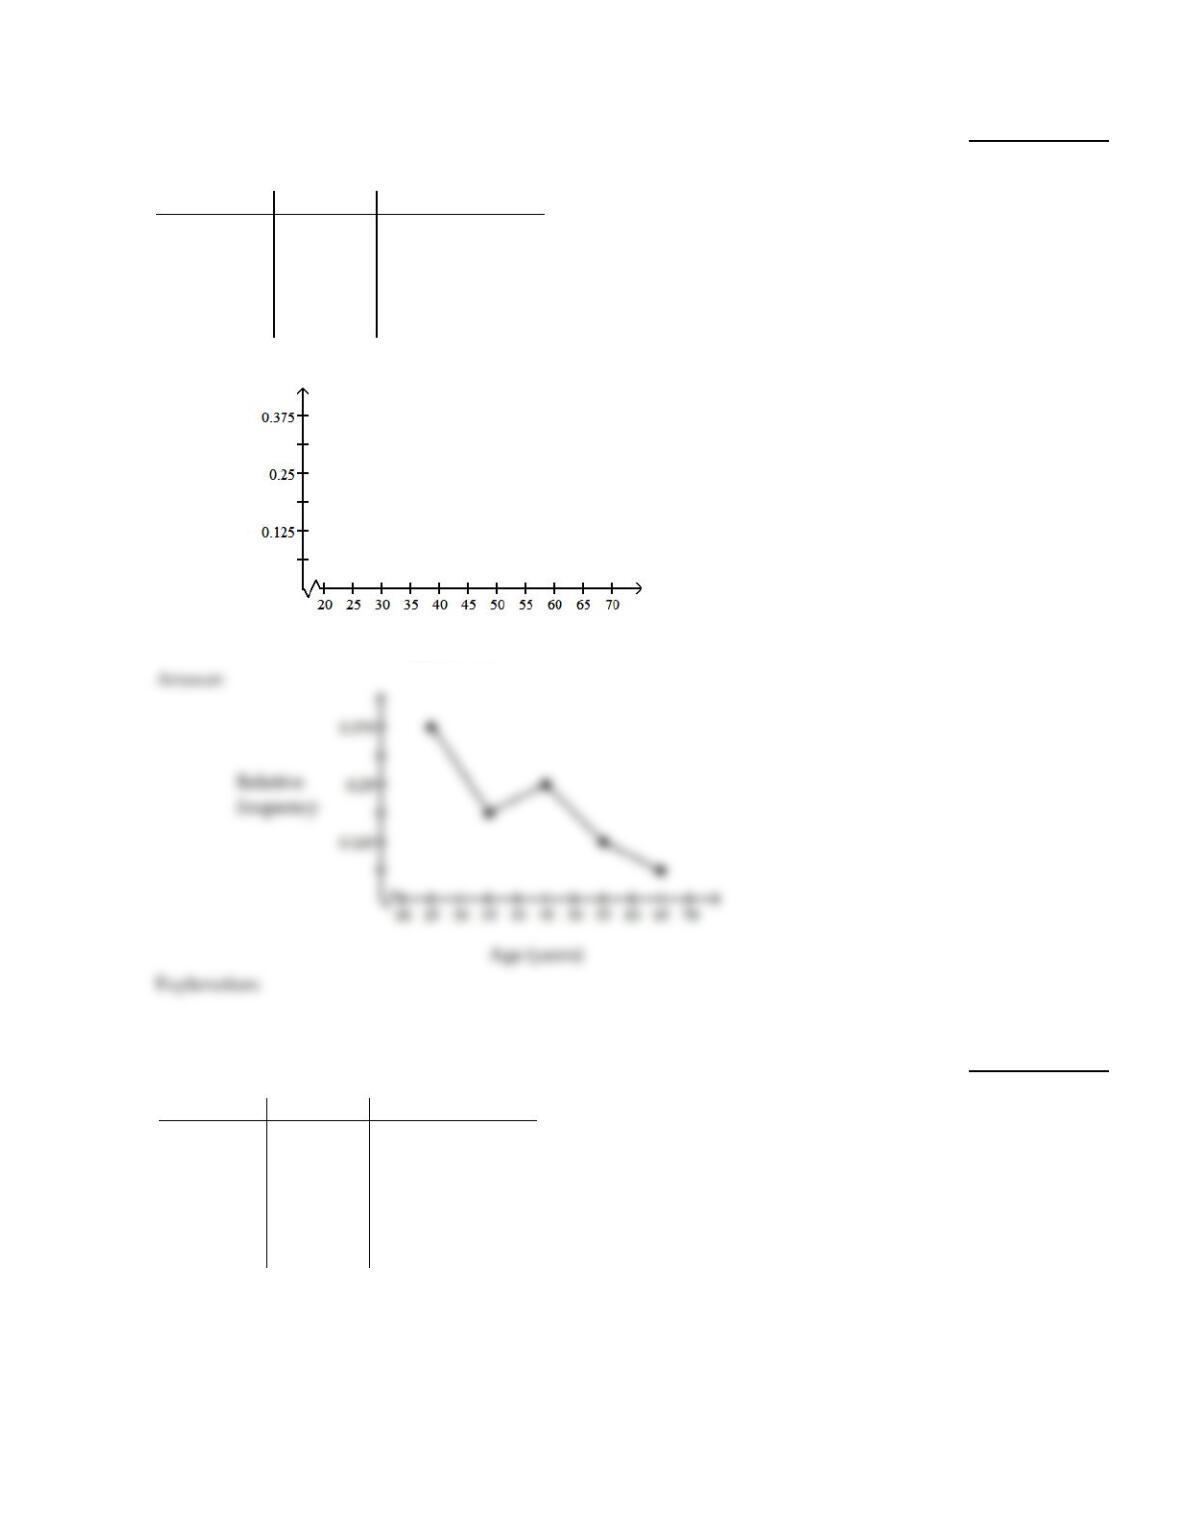
Construct a relative–frequency polygon for the given data.
53)
The table contains the frequency and relative–frequency distributions for the ages of the
employees in a particular company department.
Age (years) Frequency Relative frequency
20–under 30 60.375
30–under 40 30.1875
40–under 50 40.25
50–under 60 20.125
60–under 70 10.0625
Relative
frequency
Age (years)
53)
Construct the requested histogram.
54)
The table below shows the number of days off in a given year for 30 police detectives.
Days off Frequency Relative frequency
0–under 2 10 0.333
2–under 4 10.033
4–under 6 10.233
6–under 8 70.233
8–under 10 10.033
10–under 12 40.133
Construct a relative–frequency histogram.
54)
29
Provide an appropriate response.
55)
The results of a survey about a recent judicial appointment are given in the table below.
Construct a relative frequency distribution.
Response Frequency
Strongly Favor 20
Favor 24
Neutral 5
Oppose 9
Strongly Oppose 142
55)
Use limit grouping to organize these data into a frequency distribution.
56)
On a math test, the scores of 24 students were
99 75 78 65 78 78 99 88 78 65 83 75
75 83 78 75 83 78 75 88 75 83 88 65
Construct a frequency distribution. Use 4 classes beginning with a lower class limit of 60.
Score Frequency
56)
Provide an appropriate response.
57)
A table of random numbers is used to generate 100 random integers between 0 and 9. Do
you think that the distribution of the numbers will be roughly uniform? Why or why not?
In a second experiment, a table of random numbers is used to generate two random
integers between 0 and 9 and the sum of the two numbers is recorded. This procedure is
repeated 100 times. Do you think that the distribution of the sums will be roughly
uniform? Why or why not?
57)
58)
A random sample of federal income tax returns is selected from the 2006 returns and a
frequency histogram is constructed for the amount of federal income tax paid in 2006. The
classes used to construct the histogram are 0 3000, 3000 6000, 6000 9000, and so on.
What do you think the shape of the histogram will be? Explain your thinking.
58)
Construct the requested histogram.
59)
The table below shows the number of days off in a given year for 30 police detectives.
Days off Frequency
0–under 2 10
2–under 4 1
4–under 6 7
6–under 8 7
8–under 10 1
10–under 12 4
Construct a frequency histogram.
59)
Provide an appropriate response.
60)
The heights of adult women have a bell–shaped distribution. Give an example of a data set
whose distribution is likely to be right skewed. Explain why you think the distribution will
be skewed to the right.
60)
61)
The bar graph below shows the number of car accidents occurring in one city in each of the
years 2001 through 2006. The vertical axis is truncated and as a result the graph is
misleading. Construct an improved version of the graph which is less misleading. Use the
symbol // in your graph. Explain what the symbol // means.
61)
MULTIPLE CHOICE. Choose the one alternative that best completes the statement or answers the question.
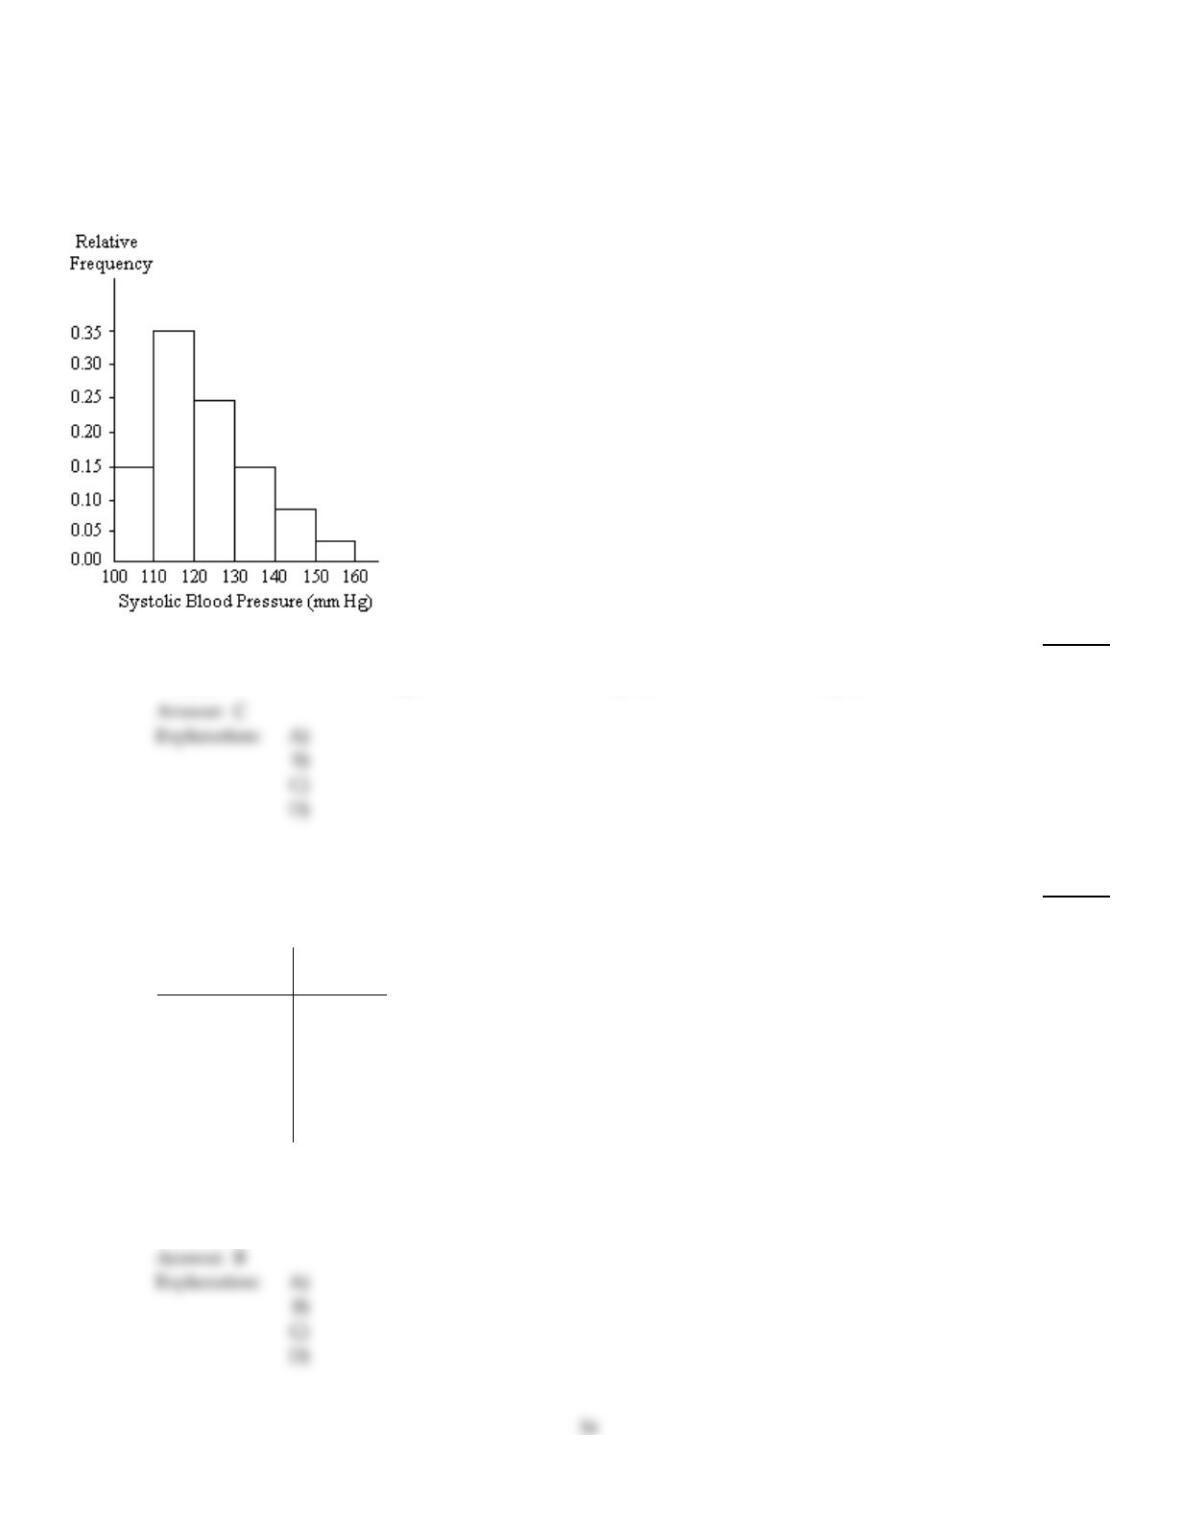
A nurse measured the blood pressure of each person who visited her clinic. Following is a relative–frequency histogram
for the systolic blood pressure readings for those people aged between 25 and 40. Use the histogram to answer the
question. The blood pressure readings were given to the nearest whole number.
62)
Given that 400 people were aged between 25 and 40, approximately how many had a systolic blood
pressure reading between 130 and 149 inclusive?
62)
A)
23
B)
9
C)
92
D)
60
Provide the requested table entry.
63)
The data in the following table represent heights of students at a highschool. Find the value of the
missing entry.
Height
(centimeters)
Relative
frequency
142–under 152 0.03
152–under 162 0.22
162–under 172 0.25
172–under 182 0.26
182–under 192
192–under 202 0.04
63)
A)
20%
B)
0.20
C)
0.16
D)
The value cannot be determined from the given data.
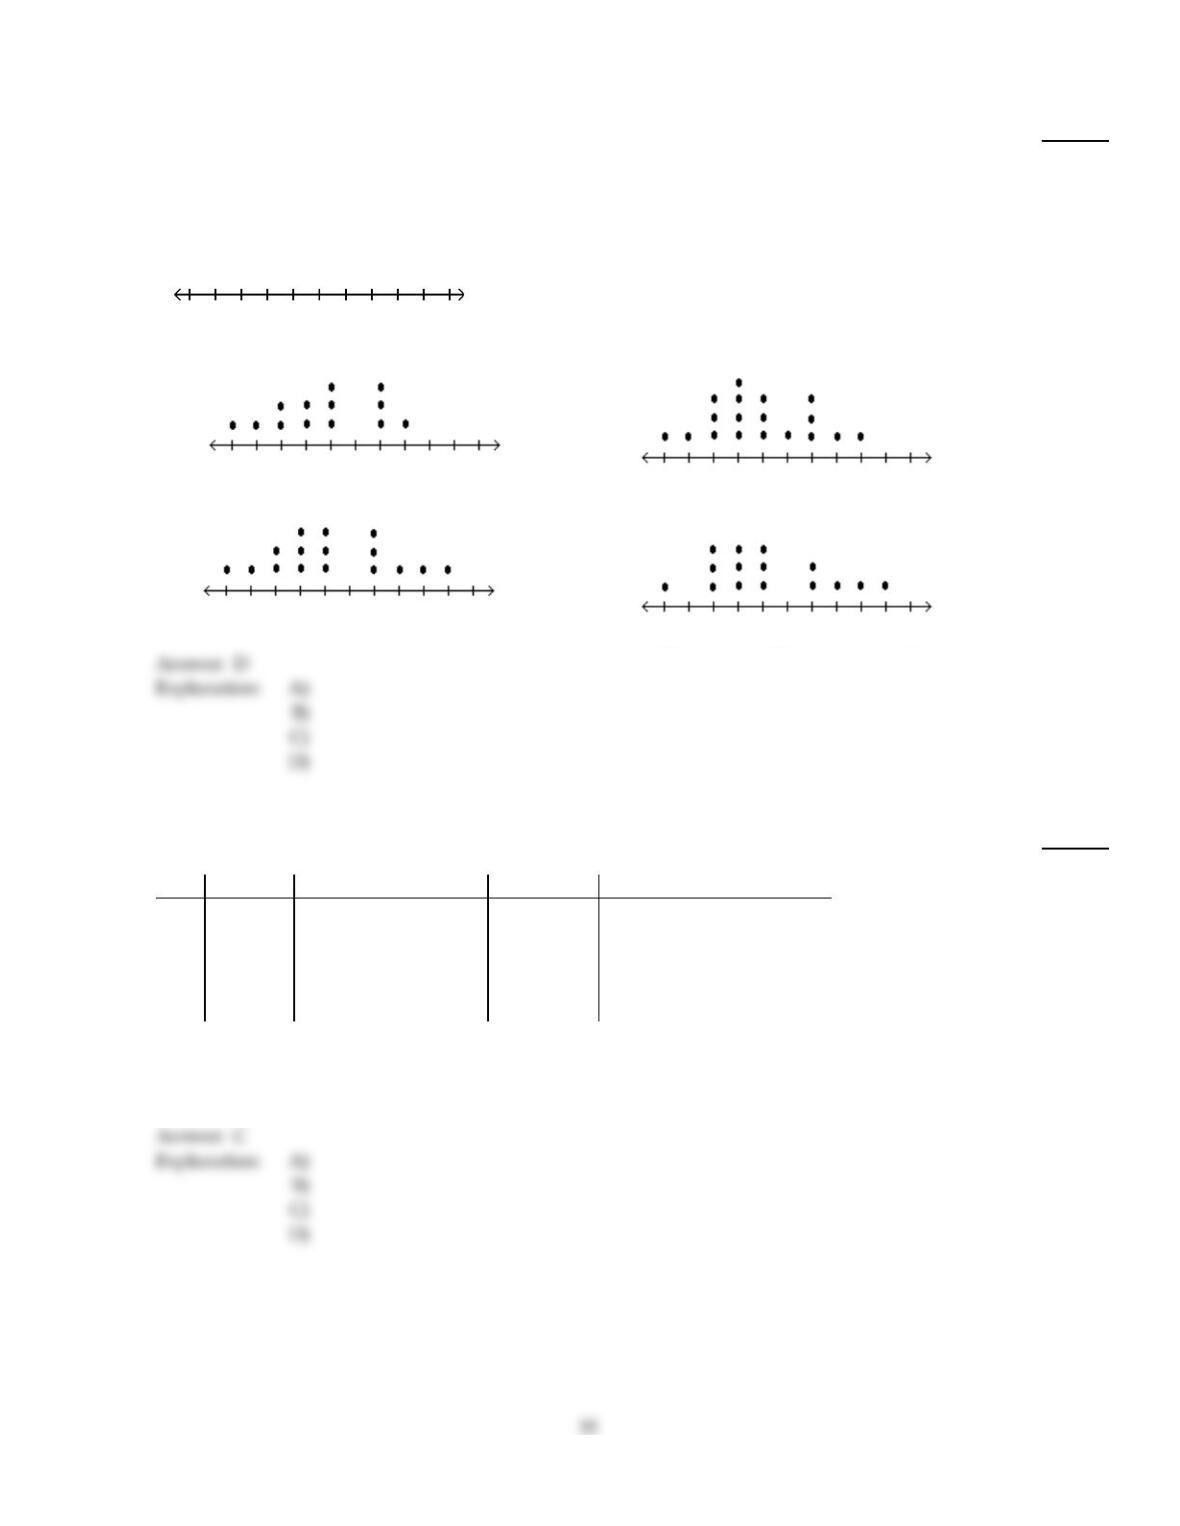
Construct a dotplot for the given data.
64)
The following data represent the number of cars passing through a toll booth during a certain time
period over a number of days.
38 39 37 37 44 38 41 38 39 35 42 39 43 37 41
35 40 45
64)
A)
35 40 45
B)
35 40 45
C)
35 40 45
D)
35 40 45
Identify the variable.
65)
The following table gives the top five movies at the box office this week.
Rank Last week Movie title Studio Box office sales ($ millions)
1N/A Pirate Adventure Movie Giant 35.2
2 2 Secret Agent Files G.M.G. 19.5
3 1 Epic Super Hero Team 21st Century 14.3
4 5 Reptile Ride Movie Giant 10.1
5 4 Must Love Cats Dreamboat 9.9
Identify the variable under consideration in the third column?
65)
A)
Epic Super Hero Team
B)
rank
C)
movie title
D)
studio name
Explanation:
Explanation:
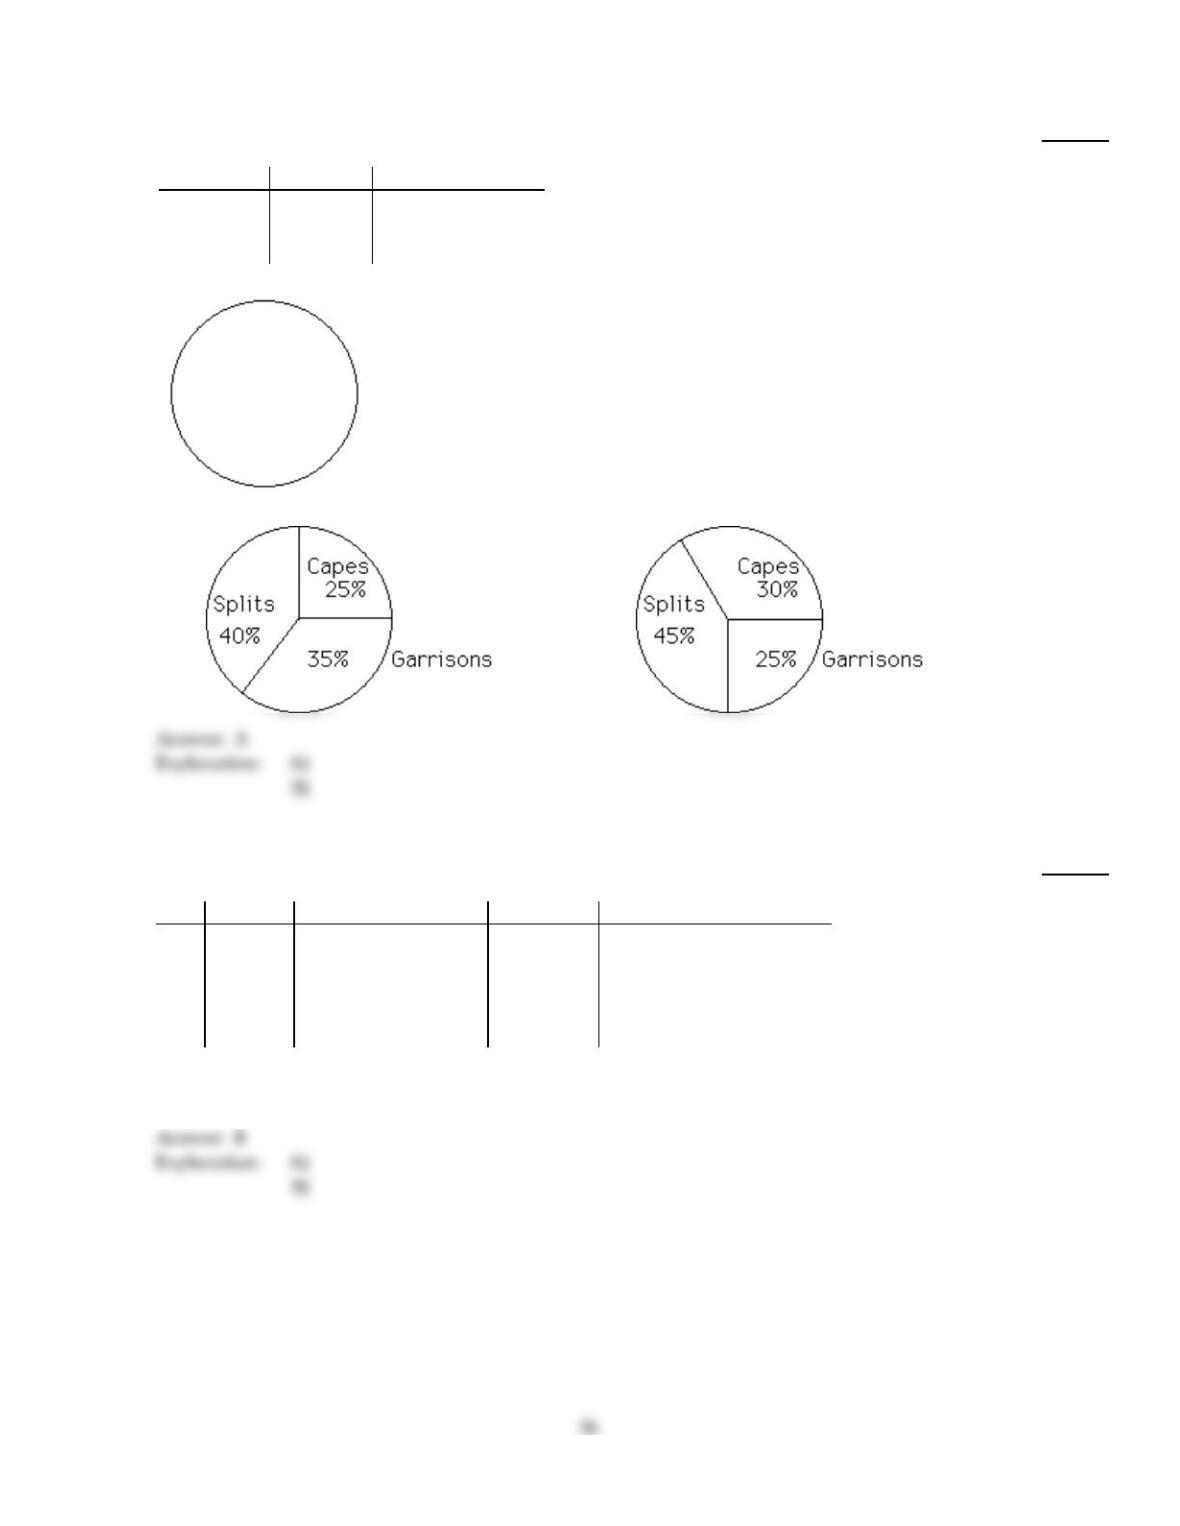
Construct a pie chart representing the given data set.
66)
The following data give the distribution of the types of houses in a town containing 35,000 houses.
House Type Frequency Relative Frequency
Cape 8750 0.25
Garrison 14,000 0.35
Split 12,250 0.40
66)
A)
B)
Classify the data as either qualitative or quantitative.
67)
The following table gives the top five movies at the box office this week.
Rank Last week Movie title Studio Box office sales ($ millions)
1N/A Pirate Adventure Movie Giant 35.2
2 2 Secret Agent Files G.M.G. 19.5
3 1 Epic Super Hero Team 21st Century 14.3
4 5 Reptile Ride Movie Giant 10.1
5 4 Must Love Cats Dreamboat 9.9
What kind of data is provided by the information in the first column?
67)
A)
Qualitative
B)
Quantitative
Identify the variable.
68)
The following table shows the average weight of offensive linemen for each given football team.
Team Average weight (pounds)
Gators 303.52
Lakers 326.78
Eagles 290.61
Pioneers 321.96
Lions 297.35
Mustangs 302.49
Rams 345.88
Buffalos 329.24
Identify the variable under consideration in the first column?
68)
A)
team name
B)
pounds
C)
Gators
D)
average weight of offensive linemen
Classify the data as either discrete or continuous.
69)
The following table shows the heights of the five tallest mountains in North America.
Mountain Height (ft) Rank
McKinley 20,320 1
Logan 19,850 2
Citlaltepec 18,700 3
St. Elias 18,008 4
Popocatepetl 17,930 5
What kind of data is given in the third column of the table?
69)
A)
Discrete
B)
Continuous
A graphical display of a data set is given. State whether the distribution is (roughly) symmetric, right skewed, or left
skewed.
70)
A stem–and–leaf diagram is given below for the annual precipitation in one U.S. city for 28
consecutive years. Precipitation data are in inches.
0
1
2
3
4
5
6
7
9
1 4 2
0 2 0 3
0 1 4 7 2 8 3 2
1 3 4 8 7
1 7 4 8
3 6
1
70)
A)
Left skewed
B)
Symmetric
C)
Right skewed
A nurse measured the blood pressure of each person who visited her clinic. Following is a relative–frequency histogram
for the systolic blood pressure readings for those people aged between 25 and 40. Use the histogram to answer the
question. The blood pressure readings were given to the nearest whole number.
71)
Approximately what percentage of the people aged 25–40 had a systolic blood pressure reading
less than 120?
71)
A)
35%
B)
50%
C)
5%
D)
3.5%
Complete the contingency table and use it to solve the problem.
72)
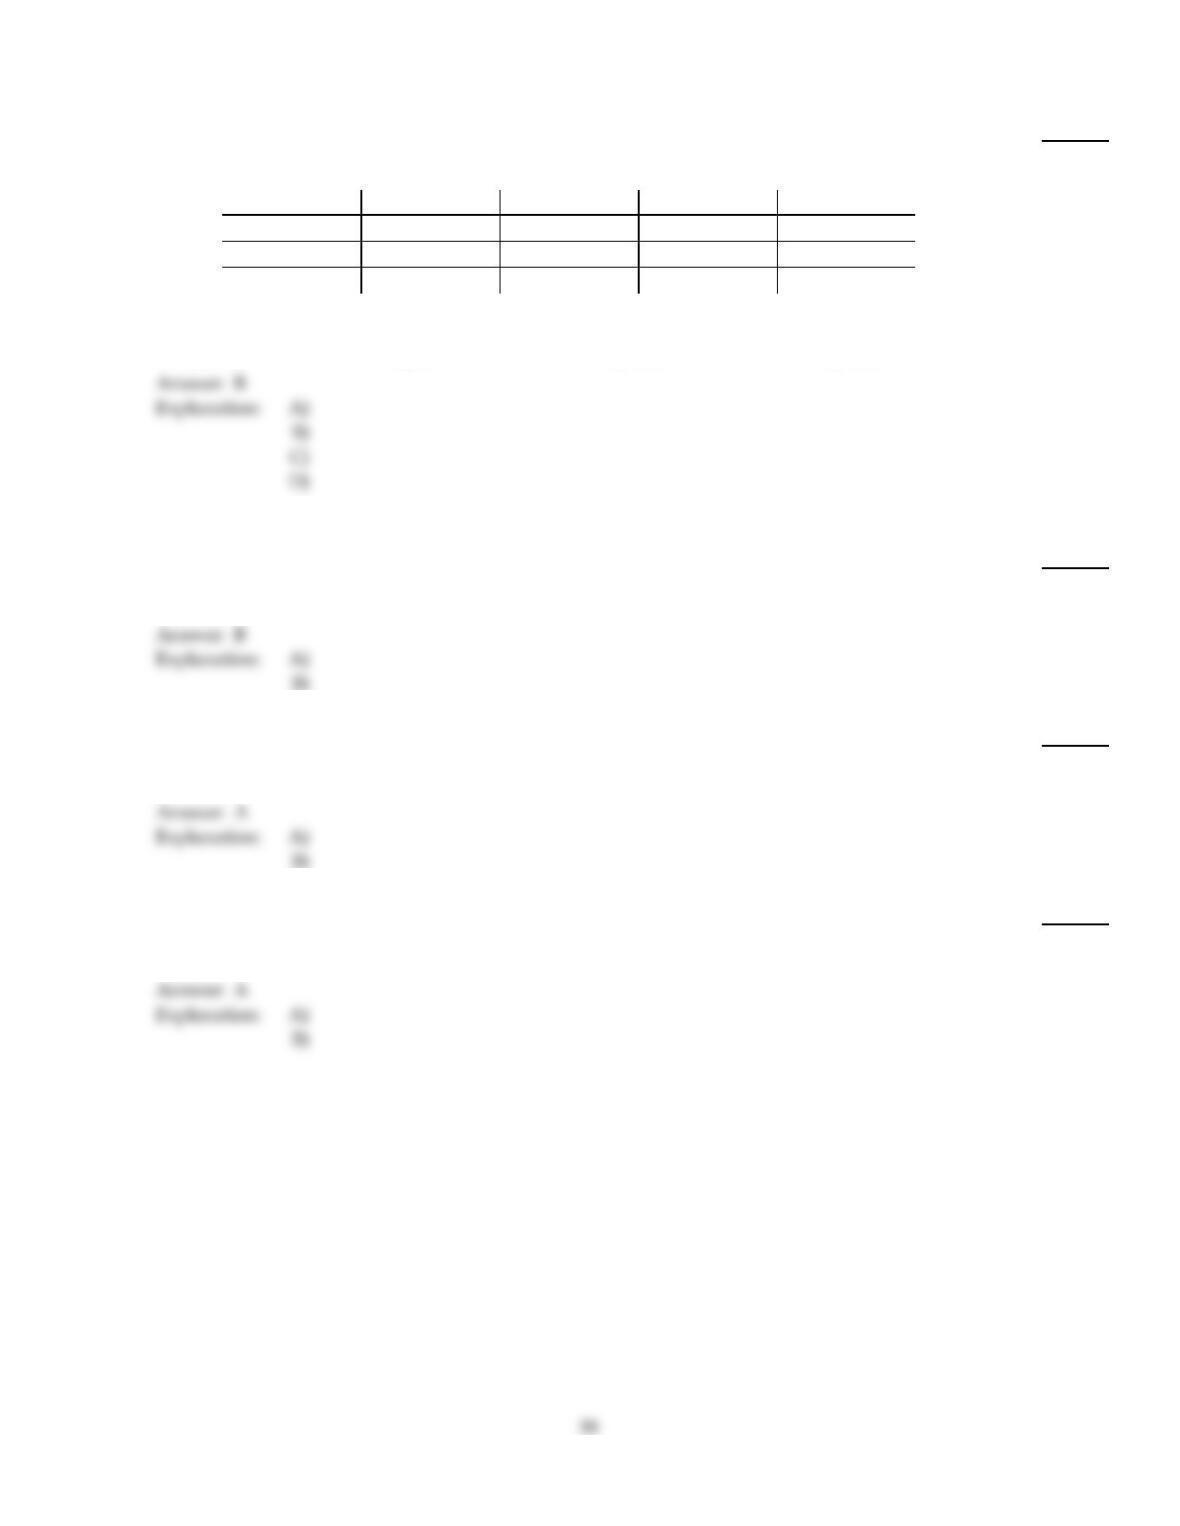
The partially filled contingency table gives the relative frequencies of the data on age (in years) and
sex from the residents of a retirement home.
Age (yrs)
60–69 70–79 Over 79 Total
Male 0.21 0.1 0.09
Female 0.2 0.1 0.3
Total 1
What percentage of residents are in the age group 60–69?
72)
A)
39%
B)
41%
C)
42.5%
D)
44%
Classify the data as either discrete or continuous.
73)
The average speed of cars passing a busy intersection between 4:30 P.M. and 6:30 P.M. on a Friday
is 32.3 mi/h.
73)
A)
Discrete
B)
Continuous
74)
The number of cars passing a busy intersection between 4:30 P.M. and 6:30 P.M. on a Monday is
2,200.
74)
A)
Discrete
B)
Continuous
75)
What type of data is provided by the statement “Helen finished in 7th place in the ice dancing
competition”?
75)
A)
Discrete
B)
Continuous
A graphical display of a data set is given. Identify the overall shape of the distribution as (roughly) bell–shaped,
triangular, uniform, reverse J–shaped, J–shaped, right skewed, left skewed, bimodal, or multimodal.
76)
A stem–and–leaf diagram is given below for the annual precipitation in one U.S. city for 28
consecutive years. Precipitation data are in inches.
0
1
2
3
4
5
6
7
9
1 4 2
0 2 0 3
0 1 4 7 2 8 3 2
1 3 4 8 7
1 7 4 8
3 6
1
76)
A)
Left skewed
B)
Right skewed
C)
Triangular
D)
Bell–shaped