Exam
Name___________________________________
MULTIPLE CHOICE. Choose the one alternative that best completes the statement or answers the question.
Provide an appropriate response.
1)
In the correlation test for normality, the null hypothesis is rejected if the linear correlation
coefficient between the sample data and their normal scores is:
1)
A)
too close to 1.
B)
too much smaller than 1.
C)
too much bigger than 1.
D)
too far from 1.
2)
In a study of the relationship between weight and height, a sample regression equation is obtained,
in which height is used as the predictor variable. This sample regression equation is then used to
make inferences. Which of the following statements is true?
2)
A)
A 95% confidence interval for the mean weight of all subjects of height 65 inches will be the
same width as a 95% prediction interval for the weight of an individual of height 65 inches.
B)
A 95% confidence interval for the mean weight of all subjects of height 65 inches will be wider
than a 95% prediction interval for the weight of an individual of height 65 inches.
C)
A 95% confidence interval for the mean weight of all subjects of height 65 inches will be
narrower than a 95% prediction interval for the weight of an individual of height 65 inches.
3)
In the context of regression analysis, which of the following, roughly speaking , does the standard
error of the estimate give an indication of?
3)
A)
How much the slope of the sample regression line differs from the slope of the population
regression line.
B)
How much, on average, the values of the response variable differ from their mean.
C)
How much, on average, the predicted values of the response variable differ from the observed
values of the response variable.
D)
How much, on average, the values of the predictor variable differ from their mean.
4)
The correlation test for normality involves computing the linear correlation coefficient between
which of the following pairs?
4)
A)
The predictor variable and the response variable
B)
The sample data and the population data
C)
The values of the response variable and their normal scores
D)
The sample data and their normal scores
SHORT ANSWER. Write the word or phrase that best completes each statement or answers the question.
Decide, at the given significance level, whether the data provide sufficient evidence to conclude that x is useful for
predicting y.
5)
^
Ten students in a graduate program were randomly selected. Their grade point averages
(GPAs) when they entered the program were between 3.5 and 4.0. The following data
consist of the students’ GPAs (x) on entering the program and their current GPAs (y).
x 3.5 3.8 3.6 3.6 3.5 3.9 4.0 3.9 3.5 3.7
y 3.6 3.7 3.9 3.6 3.9 3.8 3.7 3.9 3.8 4.0 y= 3.67 + 0.0313x
The standard error of the estimate is approximately 0.14521. At the 10% level of
significance, do the data provide sufficient evidence to conclude that the slope of the
population regression line is not 0 and hence that entering GPA is useful as a predictor of
current GPA?
5)
6)
^
The sample data below are the typing speeds (in words per minute) and reading speeds (in
words per minute) of nine randomly selected secretaries. Here, x denotes typing speed,
and y denotes reading
speed.
x 60 56 52 63 70 58 44 79 62
y 370 551 528 348 645 454 503 618 500 y= 290.2 + 3.502x
The standard error of the estimate is approximately 100.33479. At the 10% level of
significance, do the data provide sufficient evidence to conclude that the slope of the
population regression line is not 0 and hence that typing speed is useful as a predictor of
reading speed?
6)
7)
^
Applicants for a particular job, which involves extensive travel in Spanish speaking
countries, must take a proficiency test in Spanish. The sample data below were obtained in
a study of the relationship between the numbers of years applicants have studied Spanish
(x) and their score on the test (y).
x 3 4 4 2 5 3 4 5 3 2
y 57 78 72 58 89 63 73 84 75 48 y= 31.55 + 10.90x
The standard error of the estimate is approximately 5.651. At the 5% level of significance,
do the data provide sufficient evidence to conclude that the slope of the population
regression line is not 0 and hence that number of years of study is useful as a predictor of
score on the test?
7)
Paired sample data is given. Discuss what it would mean for Assumptions 1–3 for regression inferences to be satisfied by
the variables under consideration.
8)
A social scientist is interested in the relationship between age and income in adults aged
20–60. A random sample of eight adults yields the following data, where x denotes age in
years and y denotes annual income in thousands of dollars.
x27 55 48 25 31 44 57 35
y 18.9 48.3 27.6 33.2 19.6 65.0 55.6 20.1
8)
Provide an appropriate response.
9)
When testing to determine if correlation is significant, we use the hypotheses H0: = 0.
Ha: 0. Suppose the conclusion is to reject the null hypothesis. What does that tell us
about the linear regression equation?
9)
Perform the required correlation test for normality.
10)
The heights (in inches) of a random sample of students from one college are as follows.
67 61 65 70 66
60 66 68 62 64
At the 1% significance level, do the data provide sufficient evidence to conclude that
heights of students at this college are not normally distributed?
10)
Decide, at the given significance level, whether the data provide sufficient evidence to conclude that x is useful for
predicting y.
11)
^
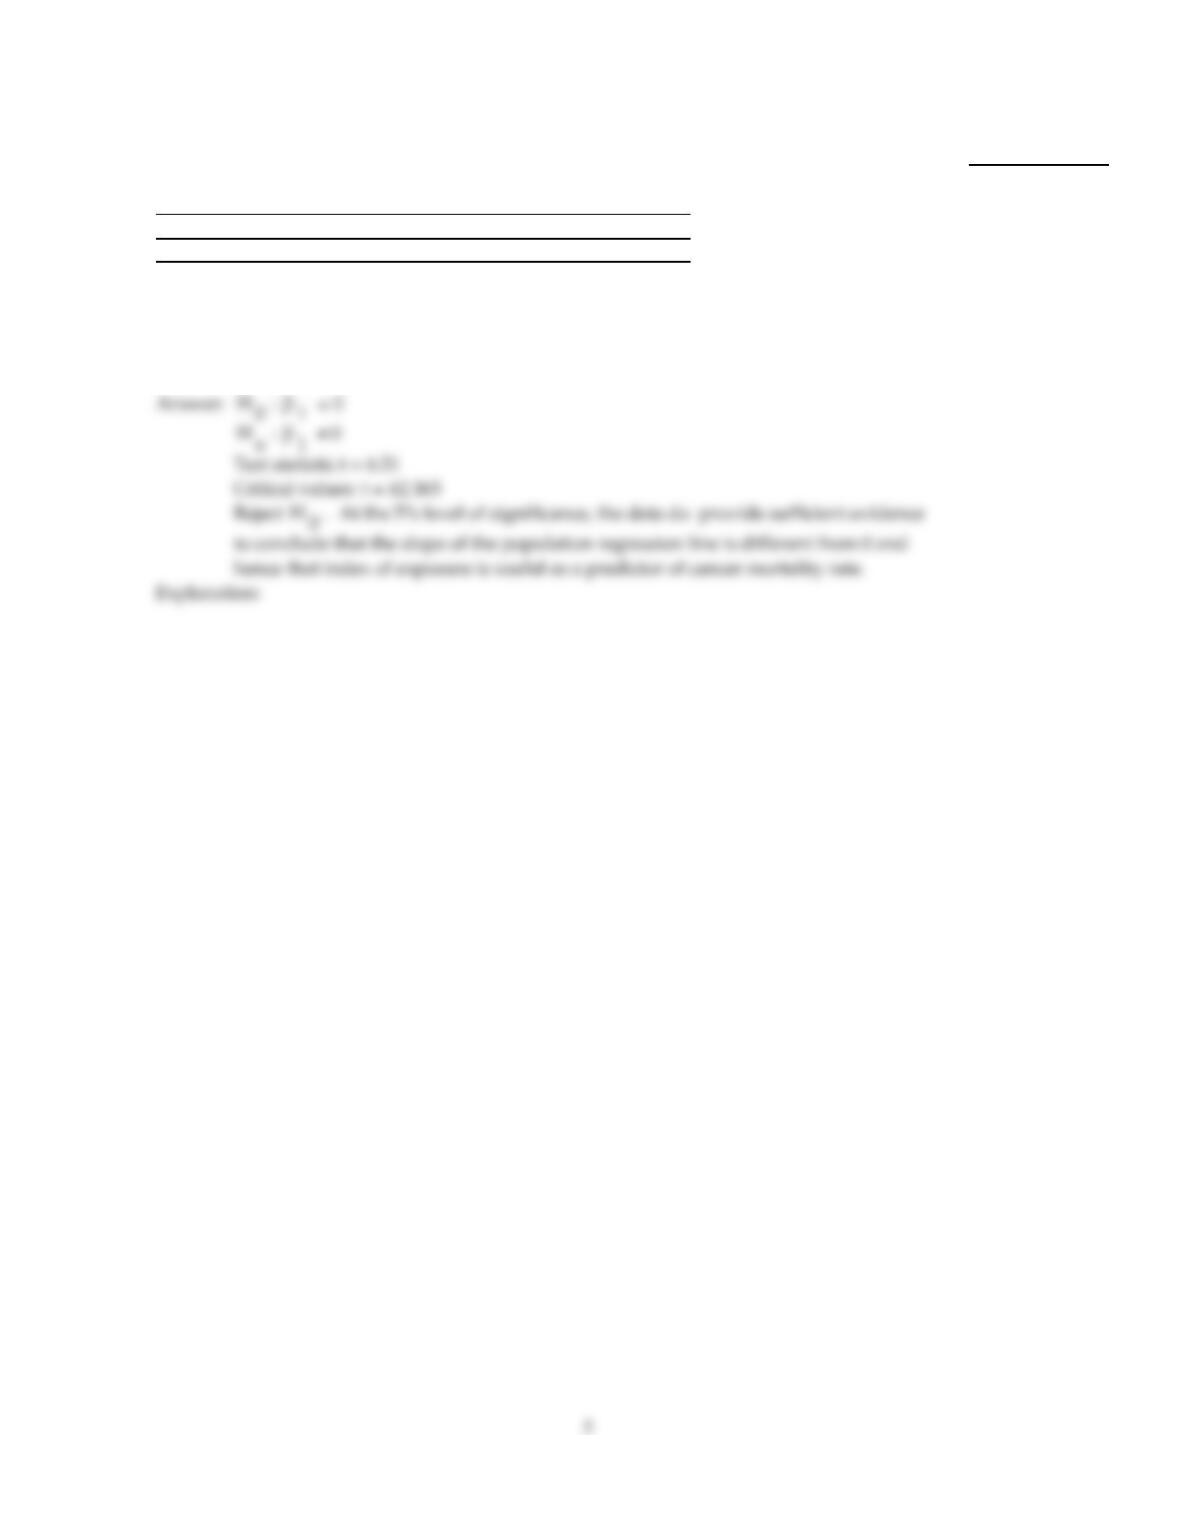
The sample data below are the index of exposure (x) to radioactive waste for nine different
Oregon counties and cancer mortality rate (y) (deaths per 100,000).
x 2.49 2.57 3.41 1.25 1.62 3.83 11.64 6.41 8.34
y 147.1 130.1 129.9 113.5 137.5 162.3 207.5 177.9 210.3 y= 114.72 + 9.23x
The standard error of the estimate is approximately 14.0099. At the 5% level of
significance, do the data provide sufficient evidence to conclude that the slope of the
population regression line is not 0 and hence that index of exposure is useful as a predictor
of cancer mortality rate?
11)
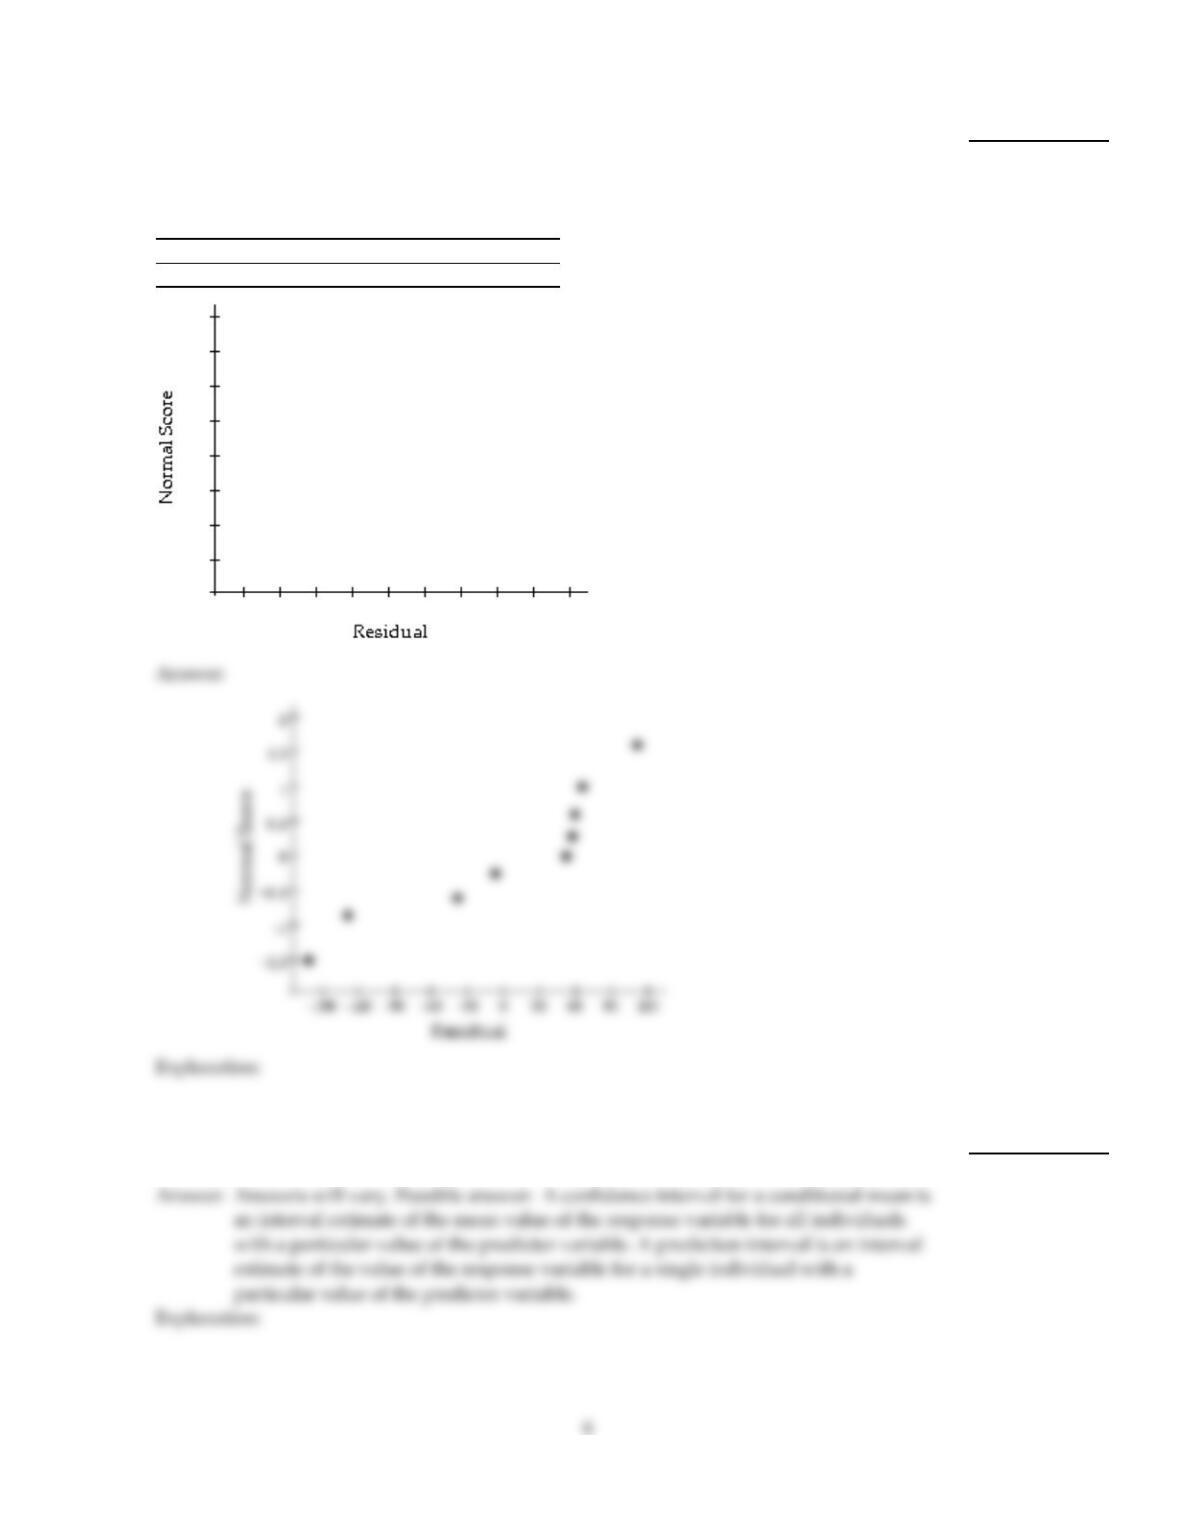
Construct a normal probability plot of the residuals for the given regression data.
12)
^
The sample data below are the typing speeds (in words per minute) and reading speeds
(in words per minute) of nine randomly selected secretaries. Here, x denotes typing speed,
and y denotes reading
speed.
x 60 56 52 63 70 58 44 79 62
y 370 551 528 348 645 454 503 618 500 y= 290.2 + 3.502x
12)
Provide an appropriate response.
13)
In the context of regression, explain the difference between a confidence interval for a
conditional mean and a prediction interval.
13)
Decide, at the given significance level, whether the data provide sufficient evidence to conclude that x is useful for
predicting y.
14)
^
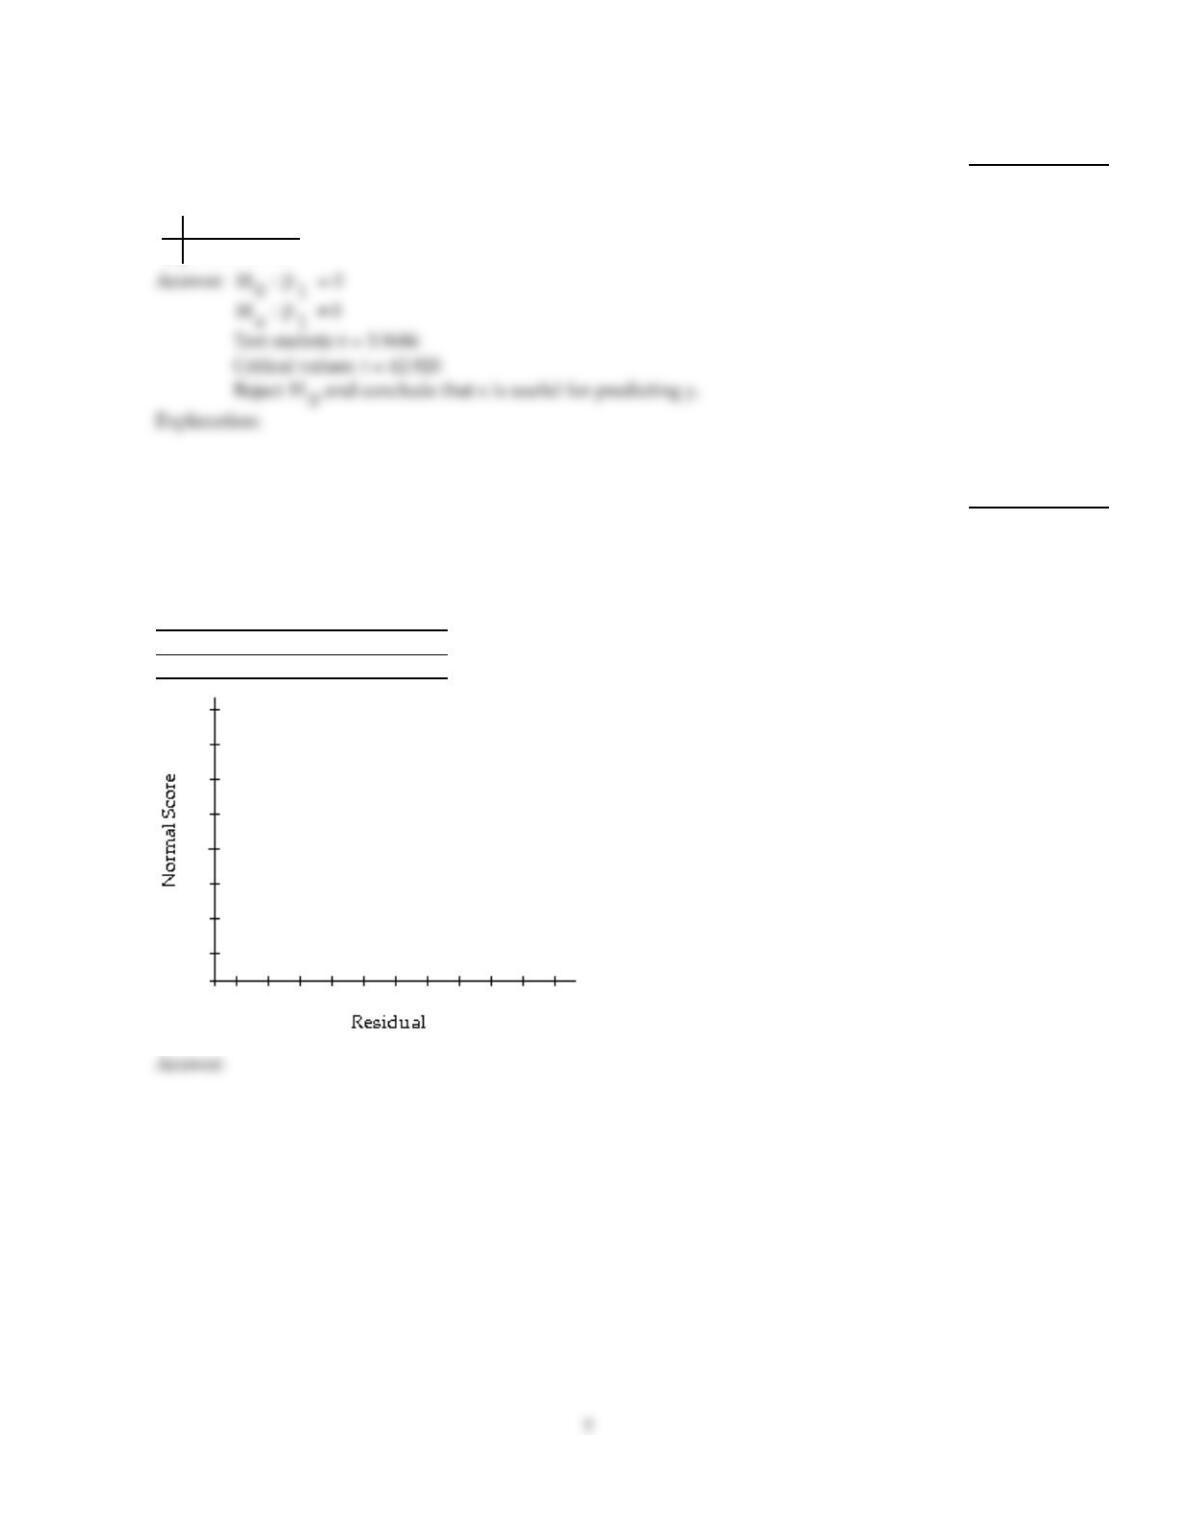
Decide, at the 10% significance level, whether the data provide sufficient evidence to
conclude that x is a useful predictor of y.
x 2 4 5 6
y 7 11 13 20 y= 3x
14)
Construct a normal probability plot of the residuals for the given regression data.
15)
^
A grass seed company conducts a study to determine the relationship between the density
of seeds planted (in pounds per 500 sq ft) and the quality of the resulting lawn. Eight
similar plots of land are selected and each is planted with a particular density of seed. One
month later the quality of each lawn is rated on a scale of 0 to 100. The sample data are
given below, where x denotes seed density, and y denotes lawn quality.
x 1 1 2 3 3 3 4 5
y 30 40 40 40 50 65 50 50 y= 33.14 + 4.54x
15)
Decide, at the given significance level, whether the data provide sufficient evidence to conclude that x is useful for
predicting y.
16)
^
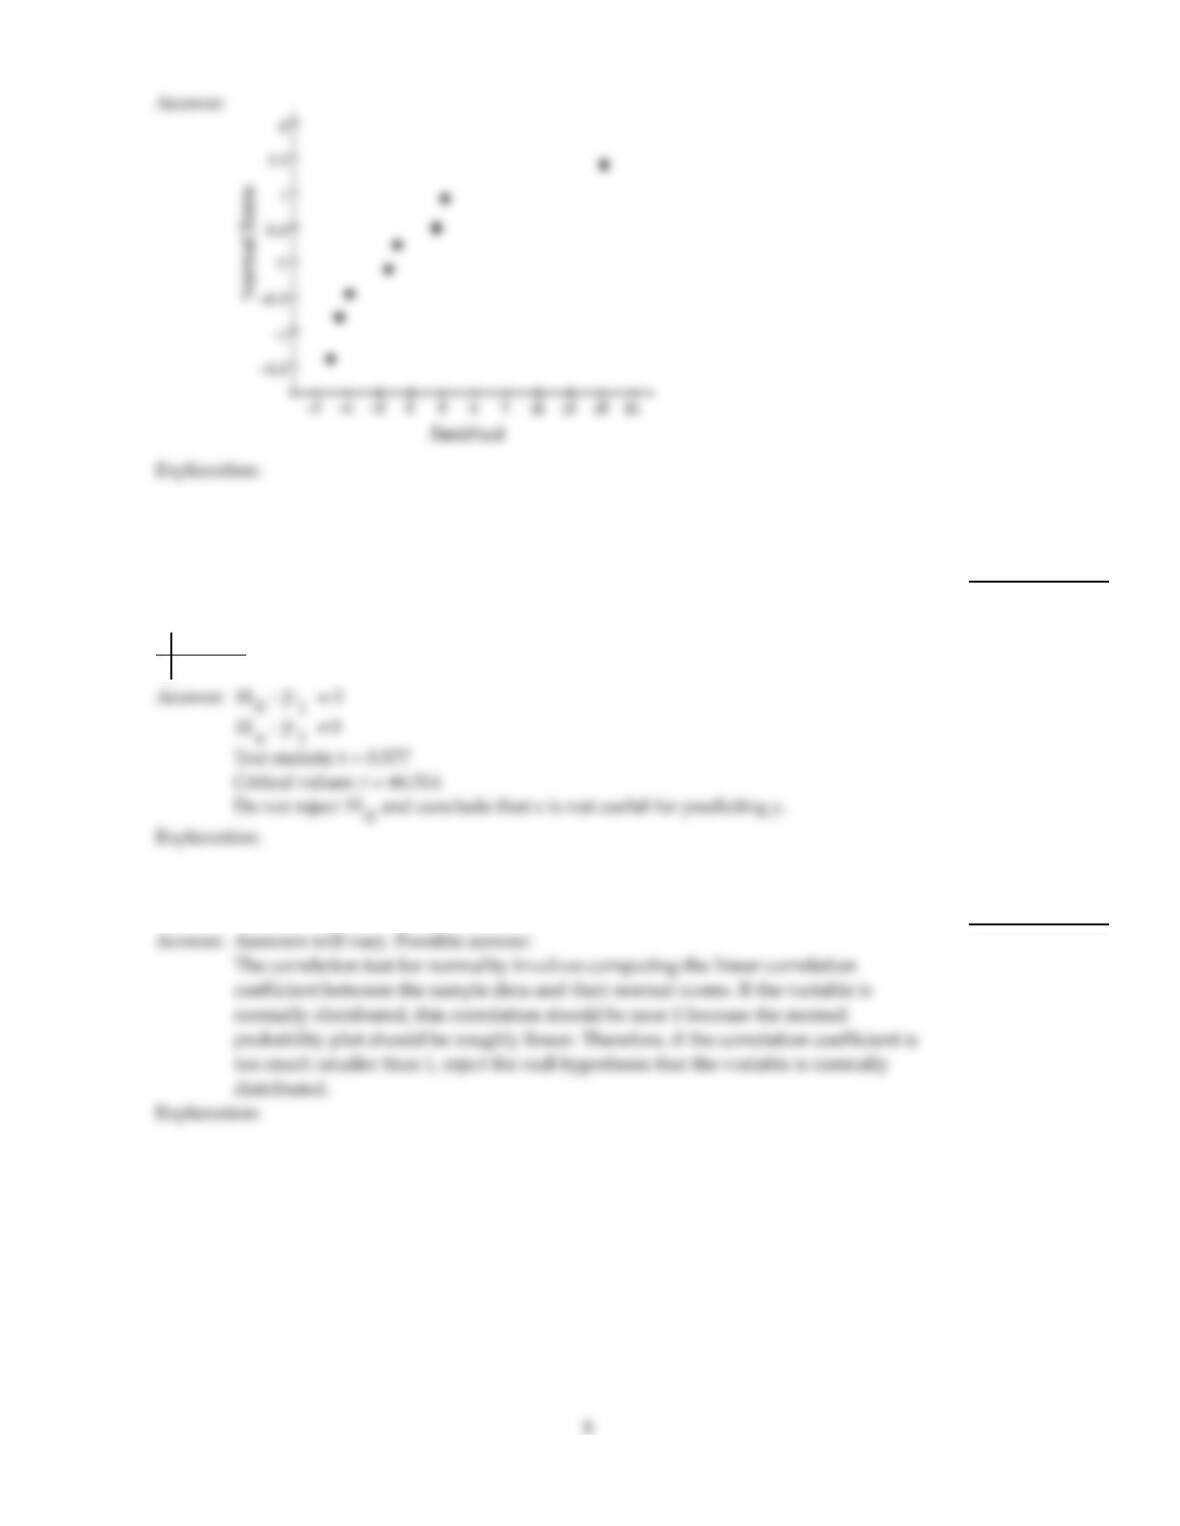
Decide, at the 10% significance level, whether the data provide sufficient evidence to
conclude that x is a useful predictor of y.
x 3 2 4
y 8 4 6 y= 3 + x
16)
Provide an appropriate response.
17)
Explain the rationale behind the correlation test for normality.
17)
Perform the required correlation test for normality.
18)
The data below represent the weekly salaries (in dollars) of ten employees selected
randomly from a particular company.
450 1035 500 1050 460
1125 480 1256 560 1470
At the 10% significance level, do the data provide sufficient evidence to conclude that
weekly salaries of employees at this company are not normally distributed?
18)
Perform the required correlation test. You may presume that the assumptions for regression inferences are met.
19)
A set of sample data consisting of 19 pairs of x and y values yields a sample linear
correlation coefficient of –0.555. At the 1% significance level, do the data provide sufficient
evidence to conclude that x and y are negatively linearly correlated?
19)
20)
A grass seed company conducts a study to determine the relationship between the density
of seeds planted (in pounds per 500 sq ft) and the quality of the resulting lawn. Eight
similar plots of land are selected and each is planted with a particular density of seed. One
month later the quality of each lawn is rated on a scale of 0 to 100. The sample data are
given below, where x denotes seed density, and y denotes lawn quality.
x 1 1 2 3 3 3 4 5
y 30 40 40 40 50 65 50 50
The sample linear correlation coefficient is r = 0.600. At the 1% significance level, do the
data provide sufficient evidence to conclude that seed density and lawn quality are
positively linearly correlated?
20)
Construct a normal probability plot of the residuals for the given regression data.
21)
^
x 0 1 5 3 3
y 7 5 –4 0 1 y= 7.105 – 2.211x
21)
Provide an appropriate response.
22)
Describe two different methods for assessing from a set of sample data whether the
variable under consideration is normally distributed.
22)
Construct a normal probability plot of the residuals for the given regression data.
23)
^
Applicants for a particular job, which involves extensive travel in Spanish speaking
countries, must take a proficiency test in Spanish. The sample data below were obtained in
a study of the relationship between the numbers of years applicants have studied Spanish
(x) and their score on the test (y).
x 3 4 4 2 5 3 4 5 3 2
y 57 78 72 58 89 63 73 84 75 48 y= 31.55 + 10.90x
23)
Perform the required correlation test. You may presume that the assumptions for regression inferences are met.
24)
A set of sample data consisting of 16 pairs of x and y values yields a sample linear
correlation coefficient of –0.293. At the 2.5% significance level, do the data provide
sufficient evidence to conclude that x and y are negatively linearly correlated?
24)
Provide an appropriate response.
25)
^
The sample data below are the index of exposure (x) to radioactive waste for nine different
Oregon counties and cancer mortality rate (y) (deaths per 100,000).
x 2.49 2.57 3.41 1.25 1.62 3.83 11.64 6.41 8.34
y 147.1 130.1 129.9 113.5 137.5 162.3 207.5 177.9 210.3 y= 114.72 + 9.23x
A 99% confidence interval for the slope of the population regression line that relates cancer
mortality rate to index of exposure is 4.26 to 14.20. Provide an interpretation of this
confidence interval.
25)
Paired sample data is given. Discuss what it would mean for Assumptions 1–3 for regression inferences to be satisfied by
the variables under consideration.
26)
A physiologist is interested in the relationship between age and blood pressure in adults in
the U.S. A random sample of eight adults yields the following data, where x denotes age in
years and y denotes systolic blood pressure in mm Hg.
x27 55 48 75 31 44 67 35
y 118 133 127 143 120 126 133 116
26)
12
Perform the required correlation test. You may presume that the assumptions for regression inferences are met.
27)
The sample data below are the index of exposure (x) to radioactive waste for nine different
Oregon counties and cancer mortality rate (y) (deaths per 100,000).
x 2.49 2.57 3.41 1.25 1.62 3.83 11.64 6.41 8.34
y 147.1 130.1 129.9 113.5 137.5 162.3 207.5 177.9 210.3
The sample linear correlation coefficient is r = 0.926. At the 5% significance level, do the
data provide sufficient evidence to conclude that index of exposure and cancer mortality
rate are linearly correlated?
27)
Provide an appropriate response.
28)
The graph below is a residual plot for a set of regression data. Does the graph suggest
violation of one or more of the assumptions for regression inferences? Explain your
answer.
28)
Perform the required correlation test. You may presume that the assumptions for regression inferences are met.
29)
A set of sample data consisting of 23 pairs of x and y values yields a sample linear
correlation coefficient of 0.844. At the 1% significance level, do the data provide sufficient
evidence to conclude that x and y are linearly correlated?
29)
Decide, at the given significance level, whether the data provide sufficient evidence to conclude that x is useful for
predicting y.
30)
^
Decide, at the 10% significance level, whether the data provide sufficient evidence to
conclude that x is a useful predictor of y.
x 0 1 5 3 3
y 7 5 –4 0 1 y= 7.105 – 2.211x
30)
Paired sample data is given. Discuss what it would mean for Assumptions 1–3 for regression inferences to be satisfied by
the variables under consideration.
31)
A social scientist is interested in the relationship between years of education and income in
adults in the U.S. A random sample of nine working adults yields the following data,
where x denotes years of education completed and y denotes annual income in thousands
of dollars.
x10 11 17 15 14 12 11 11 15
y 20.5 17.4 54.8 44.2 33.9 66.2 19.3 34.5 32.8
31)
14
Perform the required correlation test. You may presume that the assumptions for regression inferences are met.
32)
Decide, at the 10% significance level, whether the data provide sufficient evidence to reject
the null hypothesis in favor of the alternative hypothesis.
x 3 2 4
y 8 4 6 Ha: > 0
32)
Provide an appropriate response.
33)
^
Applicants for a particular job, which involves extensive travel in Spanish speaking
countries, must take a proficiency test in Spanish. The sample data below were obtained in
a study of the relationship between the numbers of years applicants have studied Spanish
(x) and their score on the test (y).
x 3 4 4 2 5 3 4 5 3 2
y 57 78 72 58 89 63 73 84 75 48 y= 31.55 + 10.90x
A 99% confidence interval for the slope of the population regression line that relates test
score to number of years of study is 5.05 to 16.75. Provide an interpretation of this
confidence interval.
33)
Construct a residual plot for the given data.
34)
^
x 3 2 4
y 8 4 6 y= 3 + x
34)
Perform the required correlation test. You may presume that the assumptions for regression inferences are met.
35)
Applicants for a particular job, which involves extensive travel in Spanish speaking
countries, must take a proficiency test in Spanish. The sample data below were obtained in
a study of the relationship between the numbers of years applicants have studied Spanish
(x) and their score on the test (y).
x 3 4 4 2 5 3 4 5 3 2
y 57 78 72 58 89 63 73 84 75 48
The sample linear correlation coefficient is r = 0.911. At the 5% significance level, do the
data provide sufficient evidence to conclude that number of years of study and test score
are positively linearly correlated?
35)
Perform the required correlation test for normality.
36)
At one bank, twelve customers were selected at random as they entered the bank and asked
to record how long they spent waiting in line. The times (in minutes) were as follows.
6.9 3.0 5.1 1.5 2.7 7.0
6.8 2.4 6.2 1.2 3.8 4.2
At the 5% significance level, do the data provide sufficient evidence to conclude that
waiting times of customers at this bank are not normally distributed?
36)
16
Perform the required correlation test. You may presume that the assumptions for regression inferences are met.
37)
Decide, at the 10% significance level, whether the data provide sufficient evidence to reject
the null hypothesis in favor of the alternative hypothesis.
x 0 1 5 3 3
y 7 5 –4 0 1 Ha: 0
37)
Provide an appropriate response.
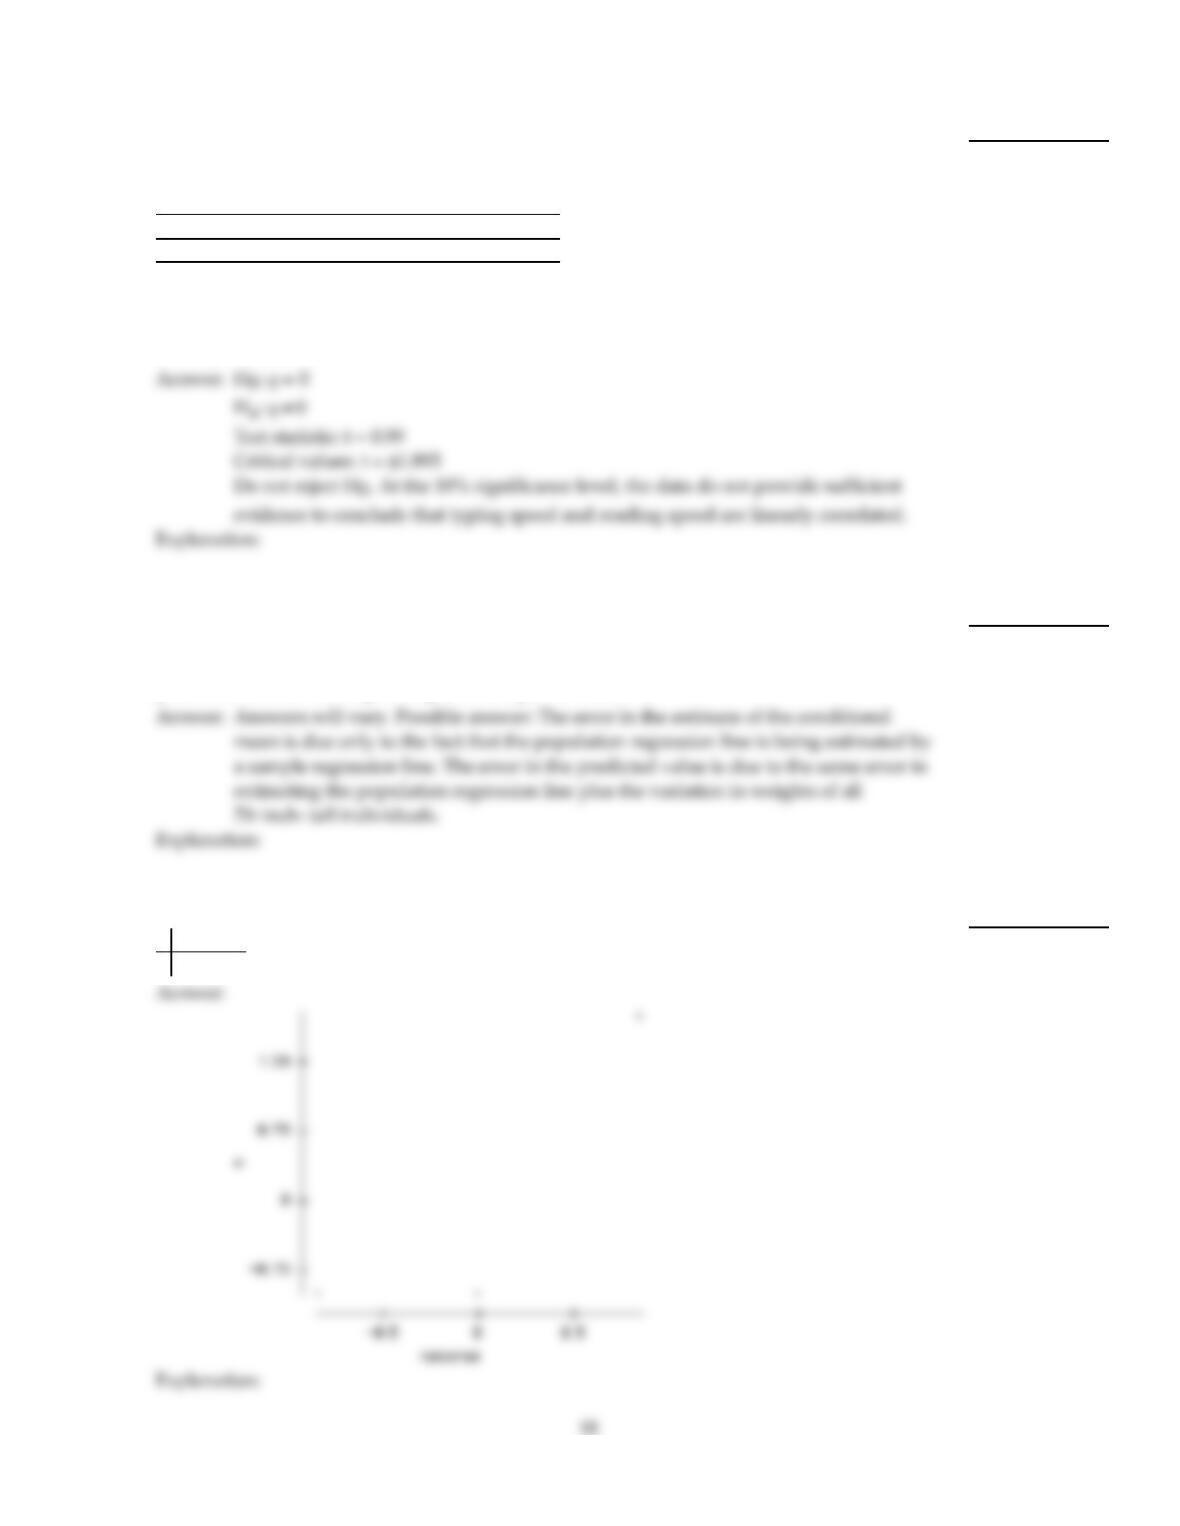
38)
The graph below is a normal probability plot for the residuals for a set of regression data.
Does the graph suggest violation of one or more of the assumptions for regression
inferences? Explain your answer.
38)
17
Perform the required correlation test. You may presume that the assumptions for regression inferences are met.
39)
The sample data below are the typing speeds (in words per minute) and reading speeds (in
words per minute) of nine randomly selected secretaries. Here, x denotes typing speed,
and y denotes reading speed.
x 60 56 52 63 70 58 44 79 62
y 370 551 528 348 645 454 503 618 500
The sample linear correlation coefficient is r = 0.352. At the 10% significance level, do the
data provide sufficient evidence to conclude that typing speed and reading speed are
linearly correlated?
39)
Provide an appropriate response.
40)
In a study of the relationship between height and weight, a sample regression equation is
obtained in which height is used as the predictor variable. Explain why a confidence
interval for a conditional mean corresponding to the height 70 inches is narrower than a
prediction interval corresponding to the height 70 inches.
40)
Construct a normal probability plot of the residuals for the given regression data.
41)
^
x 3 2 4
y 8 4 6 y= 3 + x
41)
42)
^
x 2 4 5 6
y 7 11 13 20 y= 3x
42)
Provide an appropriate response.
43)
Is it possible for a sample linear correlation coefficient, r, to be close to 0 even though the
population correlation coefficient, , is close to 1? Explain your answer.
43)
Perform the required correlation test for normality.
44)
Twelve students were selected at random from a college class and were asked how many
hours they had studied for a particular test. The results are as follows.
2.1 3.6 8.4 6.6 6.0 4.8
11.5 7.1 12.0 5.9 8.0 4.2
At the 5% significance level, do the data provide sufficient evidence to conclude that study
times of students in this class are not normally distributed?
44)
Paired sample data is given. Discuss what it would mean for Assumptions 1–3 for regression inferences to be satisfied by
the variables under consideration.
45)
A researcher is interested in the relationship between height and foot length for female
adults. A random sample of nine women yields the following data, where x denotes height
in inches and y denotes foot length in inches.
x61 64 60 64 67 65 62 69 62
y 8.9 9.4 9.0 9.2 10.0 9.7 9.1 10.3 9.5
45)
Construct a residual plot for the given data.
46)
^
The sample data below are the typing speeds (in words per minute) and reading speeds
(in words per minute) of nine randomly selected secretaries. Here, x denotes typing speed,
and y denotes reading
speed.
x 60 56 52 63 70 58 44 79 62
y 370 551 528 348 645 454 503 618 500 y= 290.2 + 3.502x
46)