Exam
Name___________________________________
MULTIPLE CHOICE. Choose the one alternative that best completes the statement or answers the question.
Provide an appropriate response.
1)
The mean annual income for adult women in one city is $28,520 and the standard deviation of the
incomes is $5,190. The distribution of incomes is skewed to the right. For samples of size 30, which
of the following statements best describes the sampling distribution of the mean?
1)
A)
x is normally distributed.
B)
Nothing can be said about the distribution of x.
C)
The distribution of x is skewed to the right.
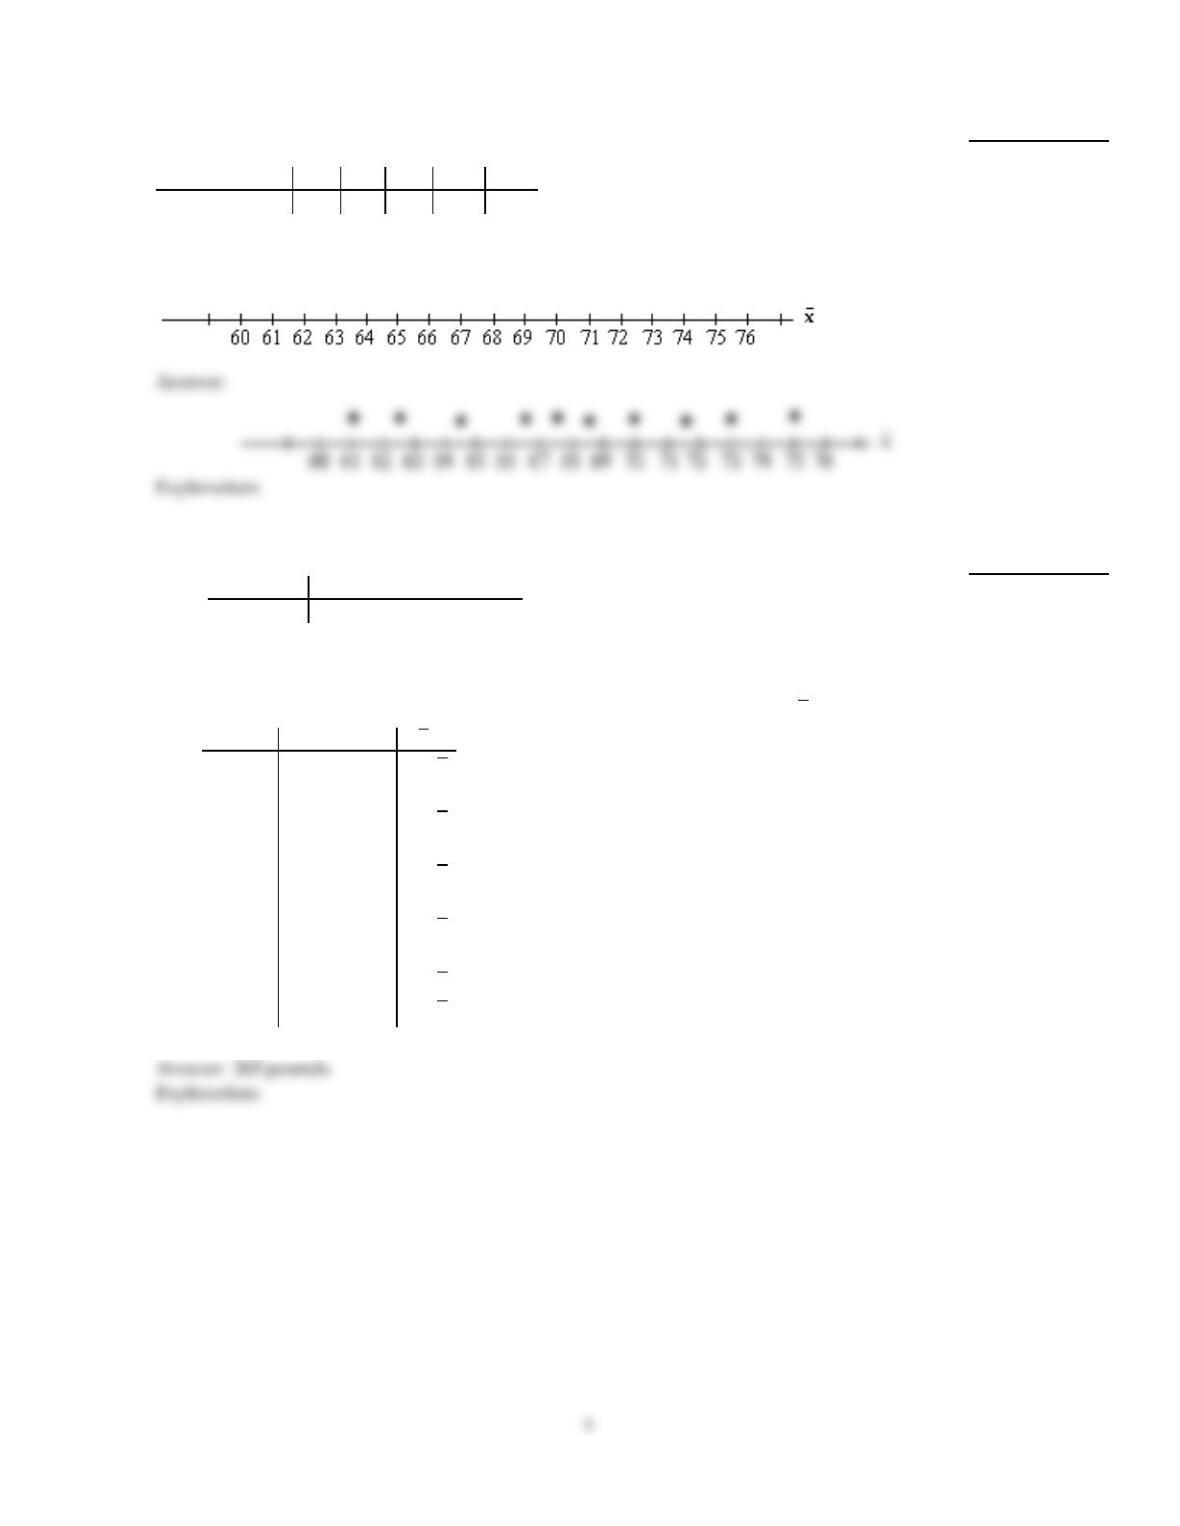
D)
x is approximately normally distributed.
2)
Let x represent the number which shows up when a balanced die is rolled. Then x is a random
variable with a uniform distribution. Let x denote the mean of the numbers obtained when the die
is rolled 3 times. Which of the following statements concerning the sampling distribution of the
mean, x , is true?
2)
A)
x is normally distributed.
B)
x is approximately normally distributed.
C)
x has a uniform distribution.
D)
None of the above statements is true.
3)
For the population of one town, the number of siblings is a random variable whose relative
frequency histogram has a reverse J–shape. Let x denote the mean number of siblings for a random
sample of size 30. For samples of size 30, which of the following statements concerning the
sampling distribution of the mean is true?
3)
A)
x is normally distributed.
B)
x is approximately normally distributed.
C)
The distribution of x has a reverse J–shape.
D)
None of the above statements is true.
4)
The heights of adult women in the U.S are normally distributed. Let x denote the mean height for a
random sample of 4 women. For samples of size 4, which of the following statements concerning
the sampling distribution of the mean is true?
4)
A)
x is approximately normally distributed.
B)
x has a uniform distribution.
C)
x is normally distributed.
D)
None of the above statements is true.
5)
For the population of one town, the number of siblings is a random variable whose relative
frequency histogram has a reverse J–shape. Let x denote the mean number of siblings for a random
sample of size 3. For samples of size 3, which of the following statements concerning the sampling
distribution of the mean is true?
5)
A)
x is approximately normally distributed.
B)
x is normally distributed.
C)
The distribution of x has a reverse J–shape.
D)
None of the above statements is true.
6)
Let x represent the number which shows up when a balanced die is rolled. Then x is a random
variable with a uniform distribution. Let x denote the mean of the numbers obtained when the die
is rolled 32 times. For samples of size 32, which of the following statements concerning the
sampling distribution of the mean is true?
6)
A)
The distribution of x is uniform.
B)
x is approximately normally distributed.
C)
x is normally distributed.
D)
None of the above statements is true.
7)
Which of the following is not synonymous with the sampling distribution of the sample mean?
7)
A)
Distribution of the variable x
B)
Distribution of a variable in a sample of a given size for a given x
C)
Distribution of x
D)
Distribution of all possible sample means from samples of a given size
SHORT ANSWER. Write the word or phrase that best completes each statement or answers the question.
8)
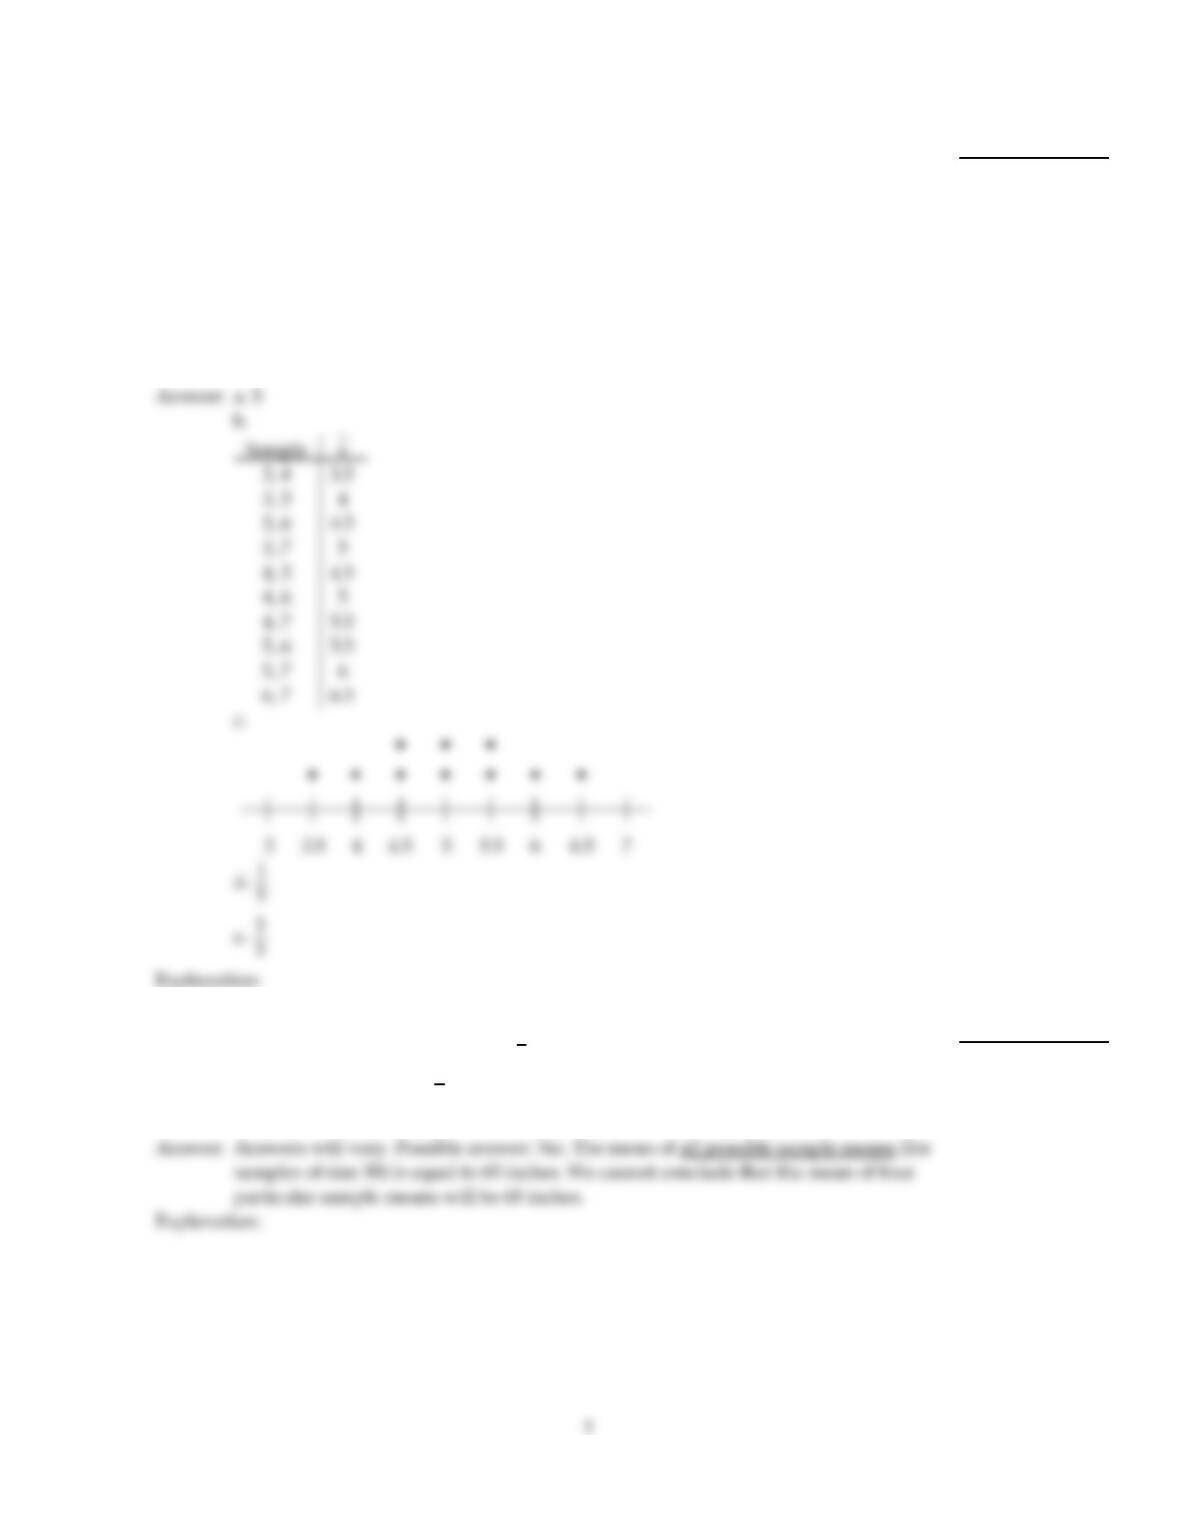
Population data: 3, 4, 5, 6, 7.
a. Find the mean, µ, of the variable.
b. Use the population data below to construct a table giving the sample means of sample
size n = 2.
c. Draw a dotplot for the sampling distribution of the sample mean.
d. Find the probability that the sample mean will equal the population mean.
e. Find the probability that the sampling error made in estimating the population mean by
the sampling mean will be 0.5 or less (in magnitude), that is, that the absolute value of the
difference between the sample mean and the population mean is at most 0.5.
8)
9)
The mean height for a population of people is 65 inches. Suppose that you pick a sample of
50 people and determine the sample mean, x. You then repeat this procedure three more
times. You learned in class that µx
=µ. Can you conclude that the mean of the four
sample means will be equal to the population mean of 65 inches? Why or why not?
9)
Solve the problem.
10)
The weights of five players on a football team are shown below.
Player A B C D E
Weight (lb) 290 310 250 255 220
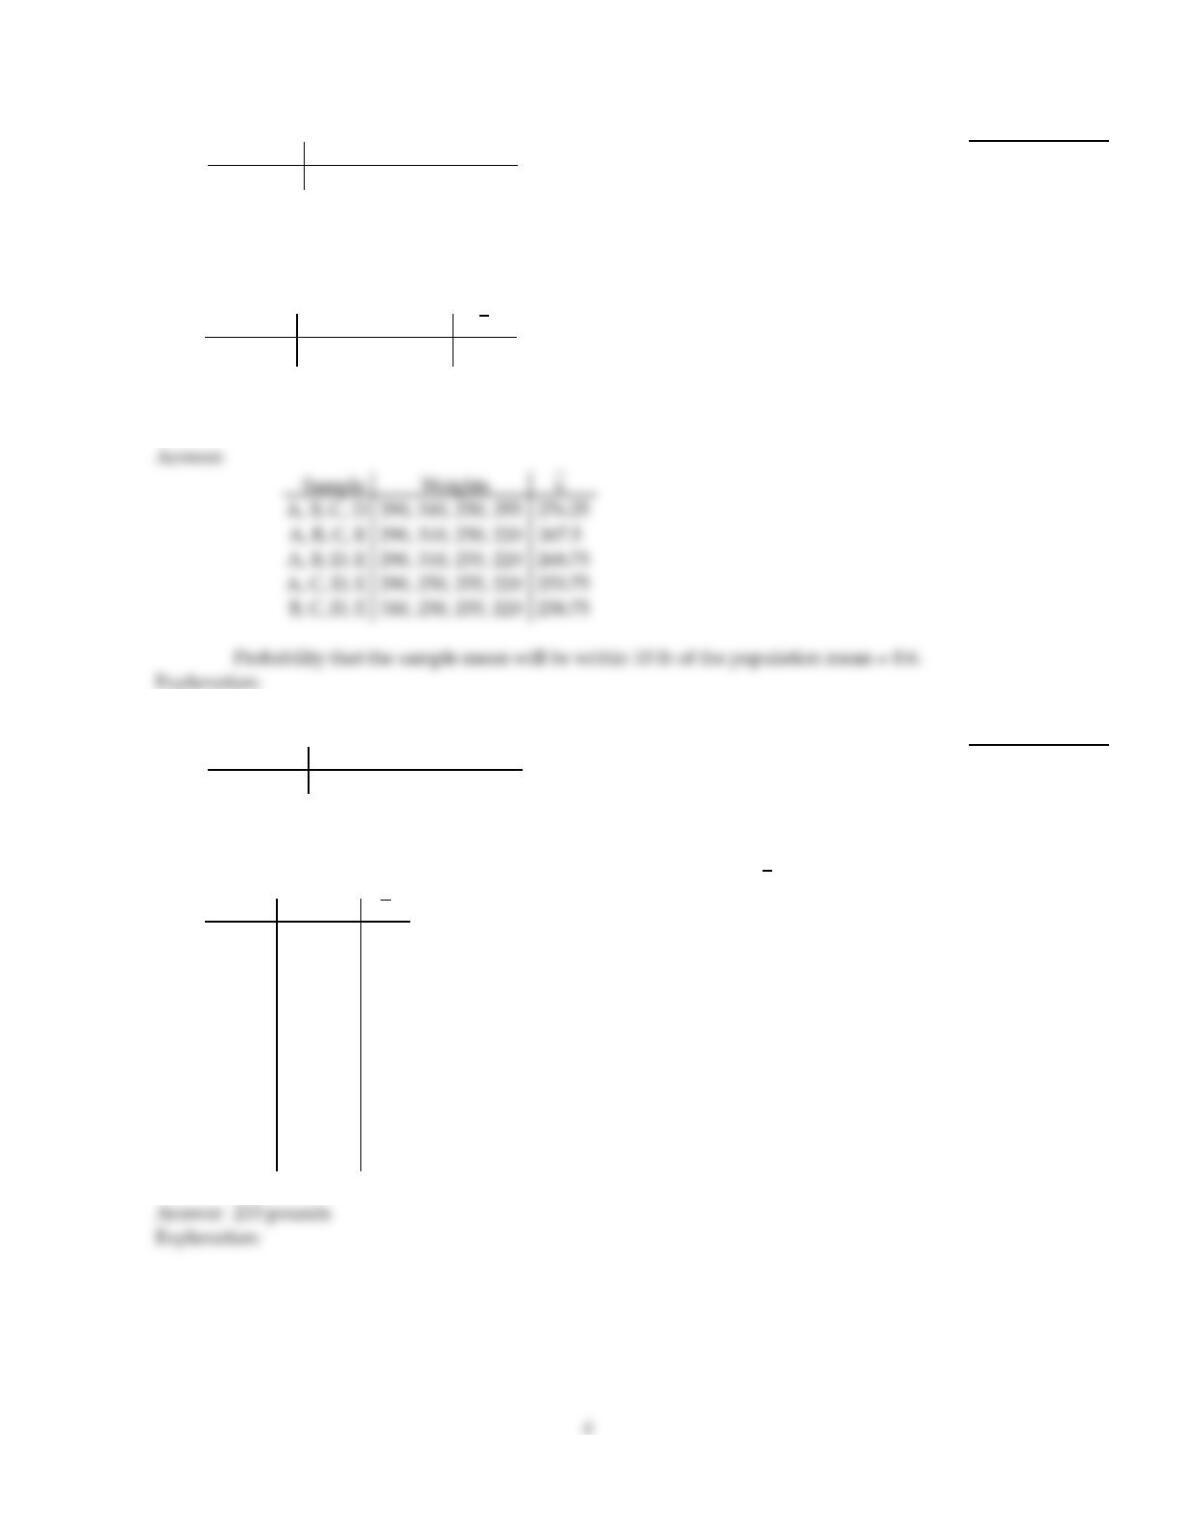
Consider these players to be a population of interest. The mean weight, µ, for the
population is 265 pounds. Construct a table that shows all of the possible samples of size
four. For each of the possible samples, list the players in the sample, their weights, and the
sample mean. The first line of the table is shown below.
Sample Weights x
A, B, C, D 290, 310, 250, 255 276.25
Use your table to find the probability that, for a random sample of size four, the sample
mean will be within 10 lb of the population mean.
10)
11)
The weights of five players on a football team are shown below.
Player A B C D E
Weight (lb) 220 200 210 255 280
Consider these players to be a population of interest. The table below shows all of the
possible samples of size two. For each sample, the players in the sample, their weights, and
the sample mean are listed. Use the table to find the mean of the variable x.
Sample Weights x
A, B
A, C
A, D
A, E
B, C
B, D
B, E
C, D
C, E
D, E
220, 200
220, 210
220, 255
220, 280
200, 210
200, 255
200, 280
210, 255
210, 280
255, 280
210
215
237.5
250
205
227.5
240
232.5
245
267.5
11)
12)
The weights of five players on a football team are shown below.
Player A B C D E
Weight (lb) 290 310 250 255 220
Consider these players to be a population of interest. The mean weight, µ, for the
population is 265 pounds. Construct a table that shows all of the possible samples of size
three. For each of the possible samples, list the players in the sample, their weights, and the
sample mean. The first line of the table is shown below.
Sample Weights x
A, B, C 290, 310, 250 283.3
Use your table to find the probability that, for a random sample of size three, the sample
mean will be within 15 lb of the population mean.
12)
13)
The ages of six members on a board of directors of a nonprofit organization are shown
below.
Member A B C D E F
Age 32 52 43 64 41 50
Consider these board members to be a population of interest. The table below shows all of
the possible samples of size four. For each sample, the people in the sample, their ages, and
the sample mean are listed. Use the table to find the mean of the variable x.
Sample Ages x
A, B, C, D
A, B, C, E
A, B, C, F
A, B, D, E
A, B, D, F
A, B, E, F
A, C, D, E
A, C, D, F
A, C, E, F
A, D, E, F
B, C, D, E
B, C, D, F
B, C, E, F
B, D, E, F
C, D, E, F
32, 52, 43, 64
32, 52, 43, 41
32, 52, 43, 50
32, 52, 64, 41
32, 52, 64, 50
32, 52, 41, 50
32, 43, 64, 41
32, 43, 64, 50
32, 43, 41, 50
32, 64, 41, 50
52, 43, 64, 41
52, 43, 64, 50
52, 43, 41, 50
52, 64, 41, 50
43, 64, 41, 50
47.75
42
44.25
47.25
49.5
43.75
45
47.25
41.5
46.75
50
52.25
46.5
51.75
49.5
13)
14)
The weights of five players on a football team are shown below.
Player A B C D E
Weight (lb) 290 310 250 255 220
Consider these players to be a population of interest. The table below shows all of the
possible samples of size four. For each sample, the players in the sample, their weights, and
the sample mean are listed. Use the table to find the mean of the variable x.
Sample Weights x
A, B, C, D
A, B, C, E
A, B, D, E
A, C, D, E
B, C, D, E
290, 310, 250, 255
290, 310, 250, 220
290, 310, 255, 220
290, 250, 255, 220
310, 250, 255, 220
276.25
267.5
268.75
253.75
258.75
14)
Draw the specified dotplot.
15)
The heights (in inches) of 5 players on a basketball team are given in the table.
Player A B C D E
Height (inches) 65 78 72 68 57
Draw a dotplot for the sampling distribution of the sample mean for samples of size 2.
15)
Solve the problem.
16)
The weights of five players on a football team are shown below.
Player A B C D E
Weight (lb) 290 310 250 255 220
Consider these players to be a population of interest. The table below shows all of the
possible samples of size three. For each sample, the players in the sample, their weights,
and the sample mean are listed. Use the table to find the mean of the variable x.
Sample Weights x
A, B, C 290, 310,250 283.3
A, B, D 290, 310, 255 285
A, B, E 290, 310 220 273.3
A, C, D 290, 250, 255 265
A, C, E 290, 250, 220 253.3
A, D, E 290, 255, 220 255
B, C, D 310, 250, 255 271.6
B, C, E 310, 250, 220 260
B, D, E 310, 255, 220 261.6
C, D, E 250, 255, 220 241.6
16)
Provide an appropriate response.
17)
A population of people has a mean height of 65 inches. Andrew picks a person at random
from the population and records his or her height. He repeats this procedure 49 times
more. Bob picks a sample of 30 people at random from the population and records the
mean height of the sample. He repeats this procedure 49 times more. Which set of numbers
(those recorded by Andrew or those recorded by Bob) do you think will have more
variability? Explain your reasoning.
17)
Solve the problem.
18)
The ages of six members on a board of directors of a nonprofit organization are shown
below.
Member A B C D E F
Age 48 62 49 67 57 38
Consider these board members to be a population of interest. The table below shows all of
the possible samples of size two. For each sample, the people in the sample, their ages, and
the sample mean are listed. Use the table to find the mean of the variable x.
Sample Ages x
A, B
A, C
A, D
A, E
A, F
B, C
B, D
B, E
B, F
C, D
C, E
C, F
D, E
D, F
E, F
48, 62
48, 49
48, 67
48, 57
48, 38
62, 49
62, 67
62, 57
62, 38
49, 67
49, 57
49, 38
67, 57
67, 38
57, 38
55
48.5
57.5
52.5
43
55.5
64.5
59.5
50
58
53
43.5
62
52.5
47.5
18)
Provide an appropriate response.
19)
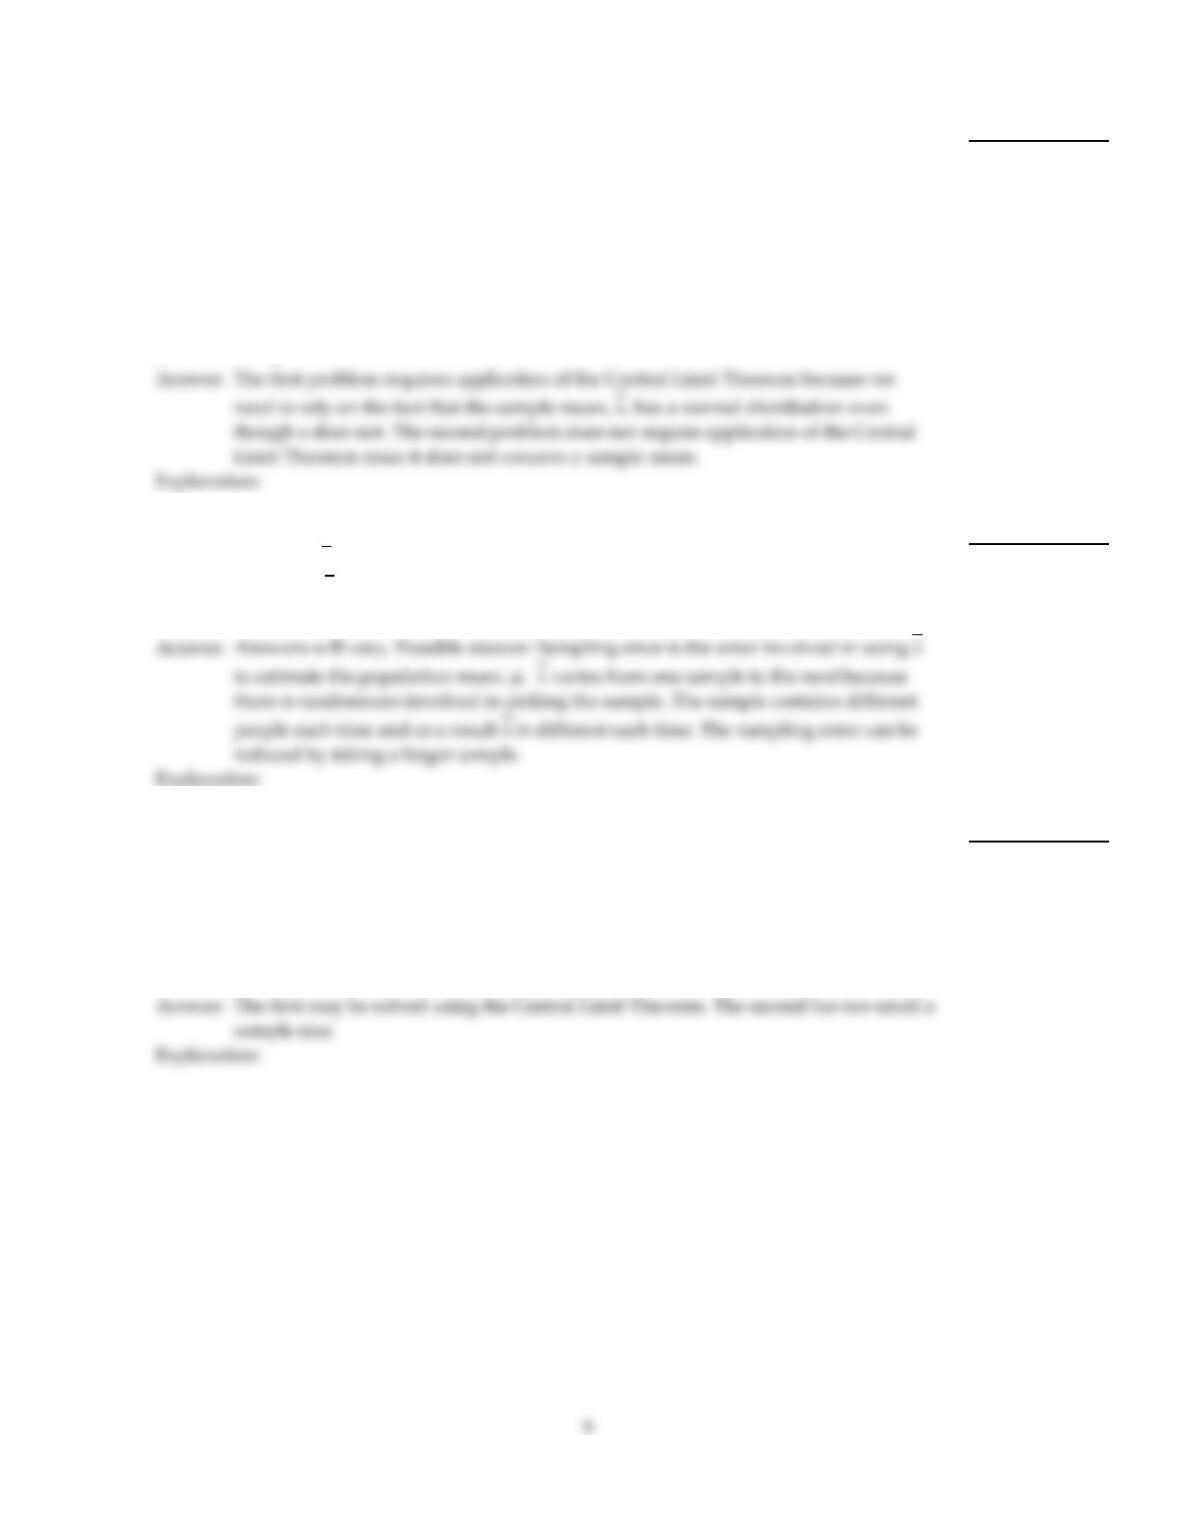
Consider the following two problems.
(a) A random–number generator yields numbers in a uniform distribution between 0 and
1 with a mean of 0.5 and a standard deviation of 0.289. You wish to find the probability
that the mean of a sample of 50 random numbers is greater than 0.6.
(b) Scores on an aptitude test are normally distributed with a mean of 82 and a standard
deviation of 11. You wish to find the probability that the score for a randomly selected
person is greater than 90.
Which of these two problems requires application of the Central Limit Theorem? Explain
your reasoning.
19)
20)
Suppose that µ represents the mean height for a population of people. Suppose that you
use a sample mean, x, to estimate µ. Explain what is meant by sampling error in this
situation. Why does x vary from one sample to the next? How can you reduce the likely
sampling error?
20)
21)
The typical computer random–number generator yields numbers in a uniform distribution
between 0 and 1, with a mean of 0.500 and a standard deviation of 0.289. Consider the
following two problems, which appear at a glance to be very similar. One can be solved
using the Central Limit Theorem. Which one and why?
(a) Suppose a sample of size 50 is randomly generated. Find the probability that the mean
is below 0.300. (b) Suppose a sample of size 15 is randomly generated. Find the probability
that the mean is below 0.300.
21)
Draw the specified dotplot.
22)
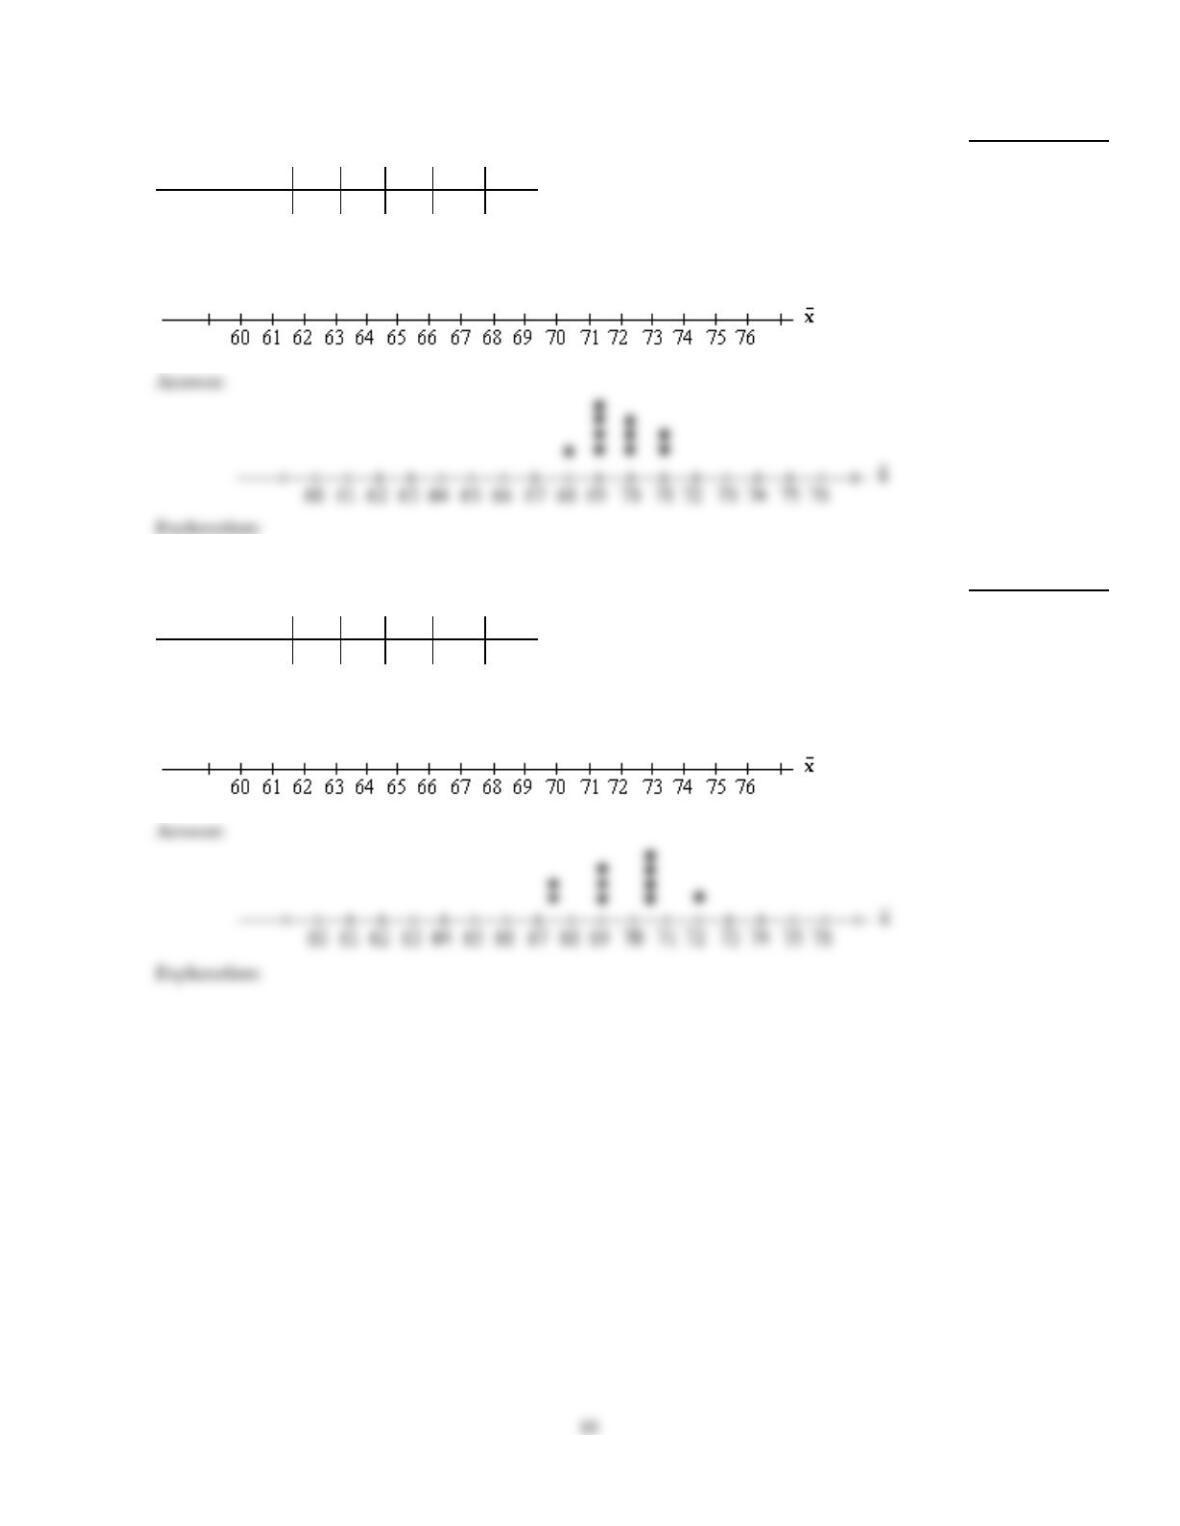
The heights (in inches) of 5 players on a basketball team are given in the table.
Player A B C D E
Height (inches) 66 69 72 69 72
Draw a dotplot for the sampling distribution of the sample mean for samples of size 3.
22)
23)
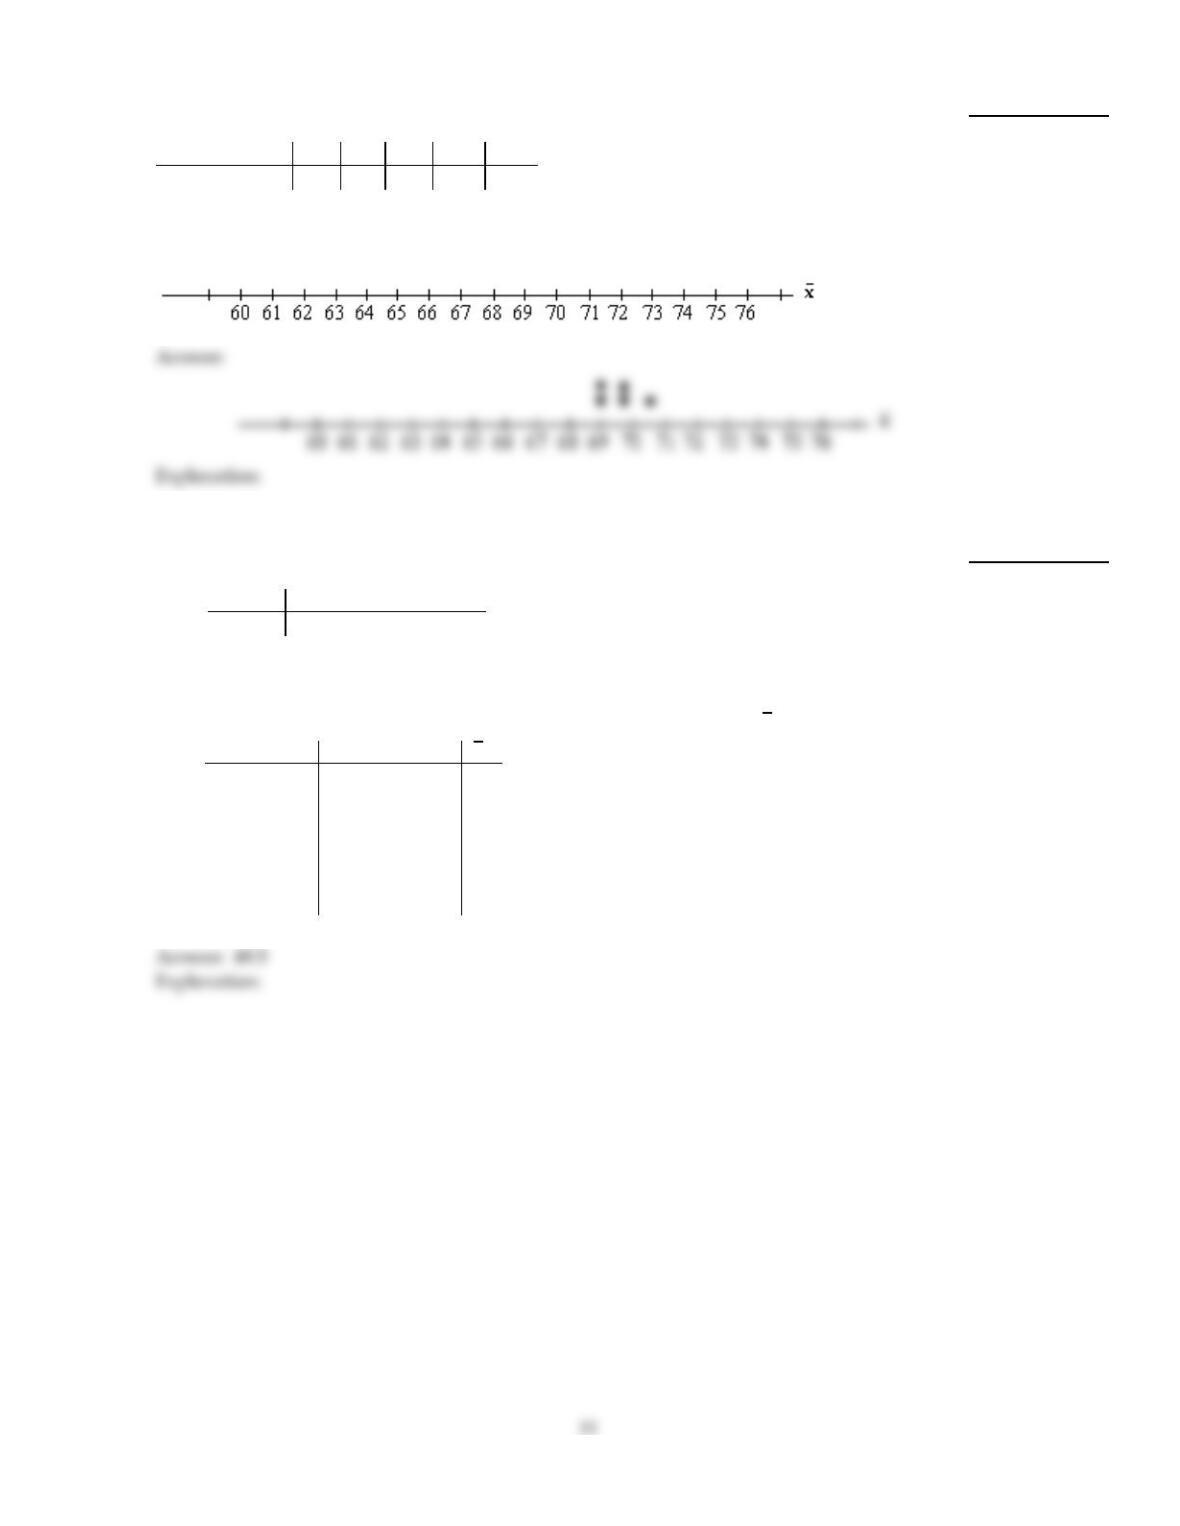
The heights (in inches) of 5 players on a basketball team are given in the table.
Player A B C D E
Height (inches) 66 69 72 69 72
Draw a dotplot for the sampling distribution of the sample mean for samples of size 2.
23)
24)
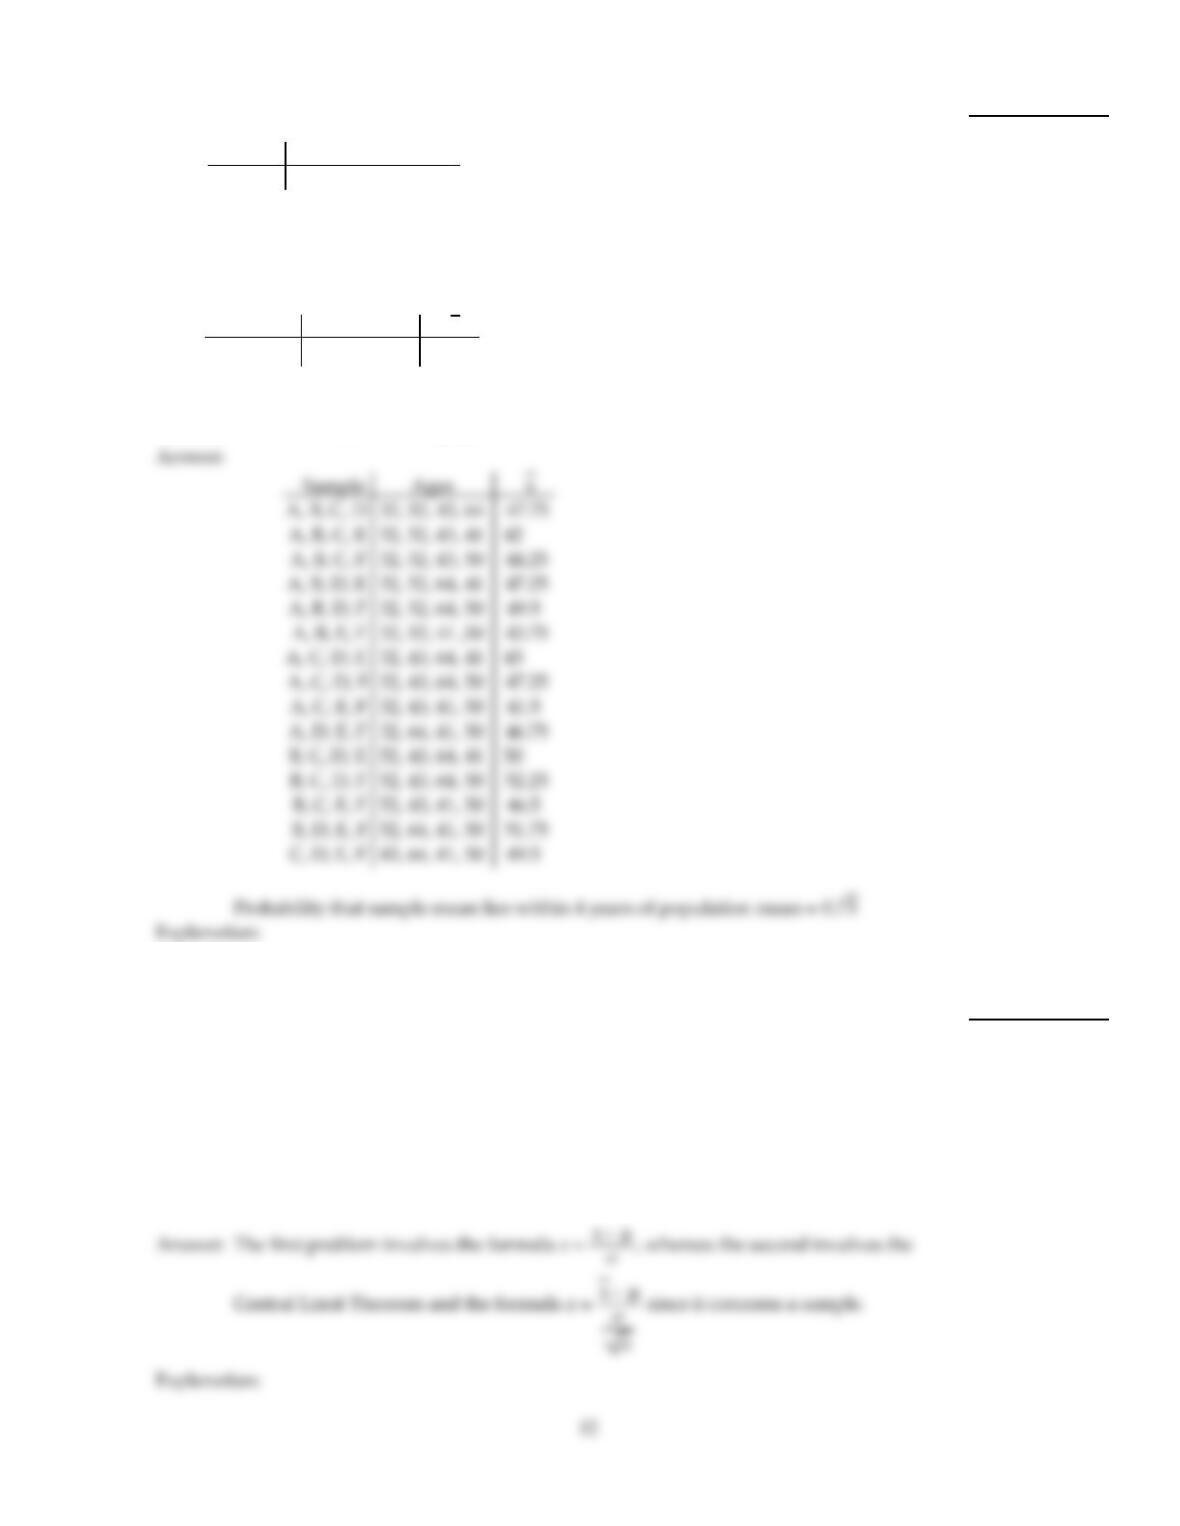
The heights (in inches) of 5 players on a basketball team are given in the table.
Player A B C D E
Height (inches) 66 69 72 69 72
Draw a dotplot for the sampling distribution of the sample mean for samples of size 4.
24)
Solve the problem.
25)
The ages of six members on a board of directors of a nonprofit organization are shown
below.
Member A B C D E F
Age 57 60 61 34 30 55
Consider these board members to be a population of interest. The table below shows all of
the possible samples of size five. For each sample, the people in the sample, their ages, and
the sample mean are listed. Use the table to find the mean of the variable x.
Sample Ages x
A, B, C, D, E
A, B, C, D, F
A, B, C, E, F
A, B, D, E, F
A, C, D, E, F
B, C, D, E, F
57, 60, 61, 34, 30
57, 60, 61, 34, 55
57, 60, 61, 30, 55
57, 60, 34, 30, 55
57, 61, 34, 30, 55
60, 61, 34, 30, 55
48.4
53.4
52.6
47.2
47.4
48
25)
26)
The ages of six members of a board of directors of a nonprofit organization are shown
below.
Member A B C D E F
Age 32 52 43 64 41 50
Consider these board members to be a population of interest. The mean age, µ, for the
population is 47. Construct a table that shows all of the possible samples of size four. For
each of the possible samples, list the people in the sample, their ages, and the sample mean.
The first line of the table is shown below.
Sample Ages x
A, B, C, D 32, 52, 43, 64 47.75
Use your table to find the probability that, for a random sample of size four, the sample
mean will be within 4 years of the population mean.
26)
Provide an appropriate response.
27)
SAT verbal scores are normally distributed with a mean of 430 and a standard deviation of
120 (based on data from the College Board ATP). Consider the following two problems,
which appear at a glance to be very similar. Which one requires the application of the
Central Limit Theorem, and in what way does the solution process differ between the two
problems?
(a) If a student is randomly selected, what is the probability that his or her score is above
500?
(b) If a sample of 35 students is selected randomly, what is the probability that the sample
mean will be above 500?
27)
28)
Do you agree with Tony‘s reasoning below? Explain why you do or do not agree. Refer to
the Central Limit Theorem in your explanation.
Tony: “When a balanced die is rolled, each of the numbers 1, 2, 3, 4, 5, and 6 has an equal
chance of showing up. So, if I roll the die 50 times and find the mean of the 50 numbers,
the mean has the same chance of falling between 1 and 2 as it has of falling between 3 and
4.”
28)
29)
Population data: 1, 2, 5, 6.
a. Find the mean, µ, of the variable.
b. Use the population data below to construct a table giving the sample means of sample
size n = 3.
c. Draw a dotplot for the sampling distribution of the sample mean.
d. Find the probability that the sample mean will equal the population mean.
e. Find the probability that the sampling error made in estimating the population mean by
the sampling mean will be 0.5 or less (in magnitude), that is, that the absolute value of the
difference between the sample mean and the population mean is at most 0.5.
29)
Solve the problem.
30)
The ages of six members of a board of directors of a nonprofit organization are shown
below.
Member A B C D E F
Age 32 52 43 64 41 50
Consider these board members to be a population of interest. The mean age, µ, for the
population is 47. Construct a table that shows all of the possible samples of size five. For
each of the possible samples, list the people in the sample, their ages, and the sample mean.
The first line of the table is shown below.
Sample Ages x
A, B, C, D, E 32, 52, 43, 64, 41 46.4
Use your table to find the probability that, for a random sample of size five, the sample
mean will be within 2 years of the population mean.
30)
31)
The ages of six members of a board of directors of a nonprofit organization are shown
below.
Member A B C D E F
Age 32 52 43 64 41 50
Consider these board members to be a population of interest. The mean age, µ, for the
population is 47. Construct a table that shows all of the possible samples of size two. For
each of the possible samples, list the people in the sample, their ages, and the sample mean.
The first line of the table is shown below.
Sample Ages x
A, B 32, 52 42
Use your table to find the probability that, for a random sample of size two, the sample
mean will equal the population mean.
31)
Draw the specified dotplot.
32)
The heights (in inches) of 5 players on a basketball team are given in the table.
Player A B C D E
Height (inches) 65 78 72 68 57
Draw a dotplot for the sampling distribution of the sample mean for samples of size 4.
32)
Solve the problem.
33)
The weights of five players on a football team are shown below.
Player A B C D E
Weight (lb) 290 310 250 255 220
Consider these players to be a population of interest. The mean weight, µ, for the
population is 265 pounds. Construct a table that shows all of the possible samples of size
two. For each of the possible samples, list the players in the sample, their weights, and the
sample mean. The first line of the table is shown below.
Sample Weights x
A, B 290, 310 300
Use your table to find the probability that, for a random sample of size two, the sample
mean will equal the population mean.
33)
MULTIPLE CHOICE. Choose the one alternative that best completes the statement or answers the question.
Use the given table to determine the mean, µx, of the variable x for the given sample size.
34)
Sample x
2, 3, 63.7
2, 3, 7 4
2, 6, 7 5
3, 6, 75.3
34)
A)
5
B)
6
C)
4.5
D)
4
35)
Sample x
3, 43.5
3, 5 4
3, 64.5
3, 7 5
4, 54.5
4, 6 5
4, 75.5
5, 65.5
5, 7 6
6, 76.5
35)
A)
5.5
B)
5
C)
6
D)
4.5
Find the indicated probability or percentage for the sampling error.
36)
Scores on a biology final exam are normally distributed with a mean of 220 and a standard
deviation of 16. Determine the percentage of samples of size 4 that will have mean scores within 12
points of the population mean score of 220.
36)
A)
13.36%
B)
38.30%
C)
86.64%
D)
93.32%
37)
Scores on a chemistry final exam are normally distributed with a mean of 280 and a standard
deviation of 50. Determine the percentage of samples of size 4 that will have mean scores within 35
points of the population mean score of 280.
37)
A)
99.48%
B)
83.84%
C)
91.92%
D)
51.60%
17