Solve the problem.
57)
Frequency data were reported for the ages of full–time employees at a company. The age
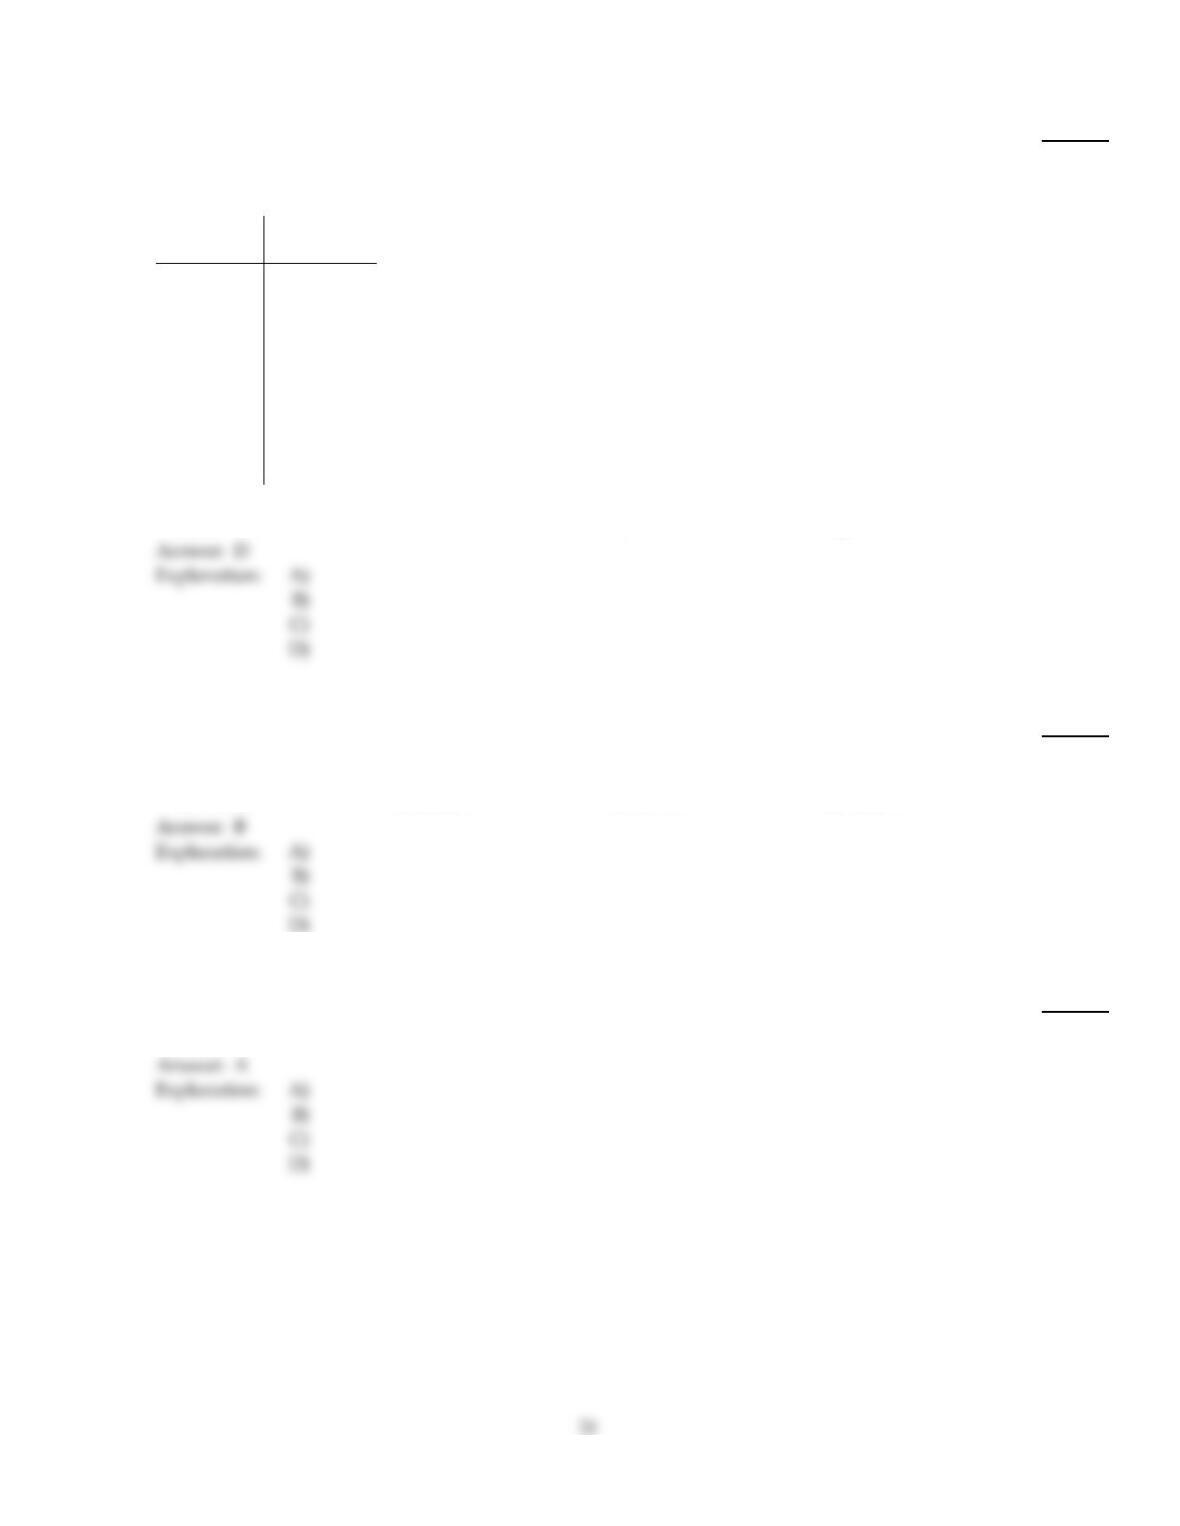
distribution is given in the table. Obtain a relative–frequency histogram of these data and
determine whether the ages are approximately normally distributed.
Age
(yrs)
Frequency
20–under 25 5
25–under 30 60
30–under 35 443
35–under 40 340
40–under 45 231
45–under 50 75
50–under 55 87
55–under 60 35
60–under 65 15
57)
A)
Yes. The distribution is bell–shaped.
B)
No. The distribution is left–skewed.
C)
No. The distribution is uniform.
D)
No. The distribution is right–skewed.
Use the empirical rule to solve the problem.
58)
The lifetimes of lightbulbs of a particular type are normally distributed with a mean of 370 hours
and a standard deviation of 10 hours. What percentage of the bulbs have lifetimes that lie within 1
standard deviation to either side of the mean?
58)
A)
95.44%
B)
68.26%
C)
31.74%
D)
84.13%
Use a table of areas for the standard normal curve to find the required z–score.
59)
Find z0.45 .
59)
A)
0.13
B)
0.3264
C)
–0.13
D)
0.6736
Solve the problem.
60)
Data were reported for household size (number of people in household) in a small community. The
size distribution is given in the table. Obtain a relative–frequency histogram for these data and
determine whether the household sizes are approximately normally distributed.
Size
(# of people)
Frequency
1–under 2 4
2–under 3 0
3–under 4 2
4–under 5 10
5–under 6 32
6–under 7 28
7–under 8 8
8–under 9 4
60)
A)
No. The distribution is left–skewed.
B)
Yes. The distribution is bell–shaped.
C)
No. The distribution has outliers.
D)
No. The distribution is right–skewed.
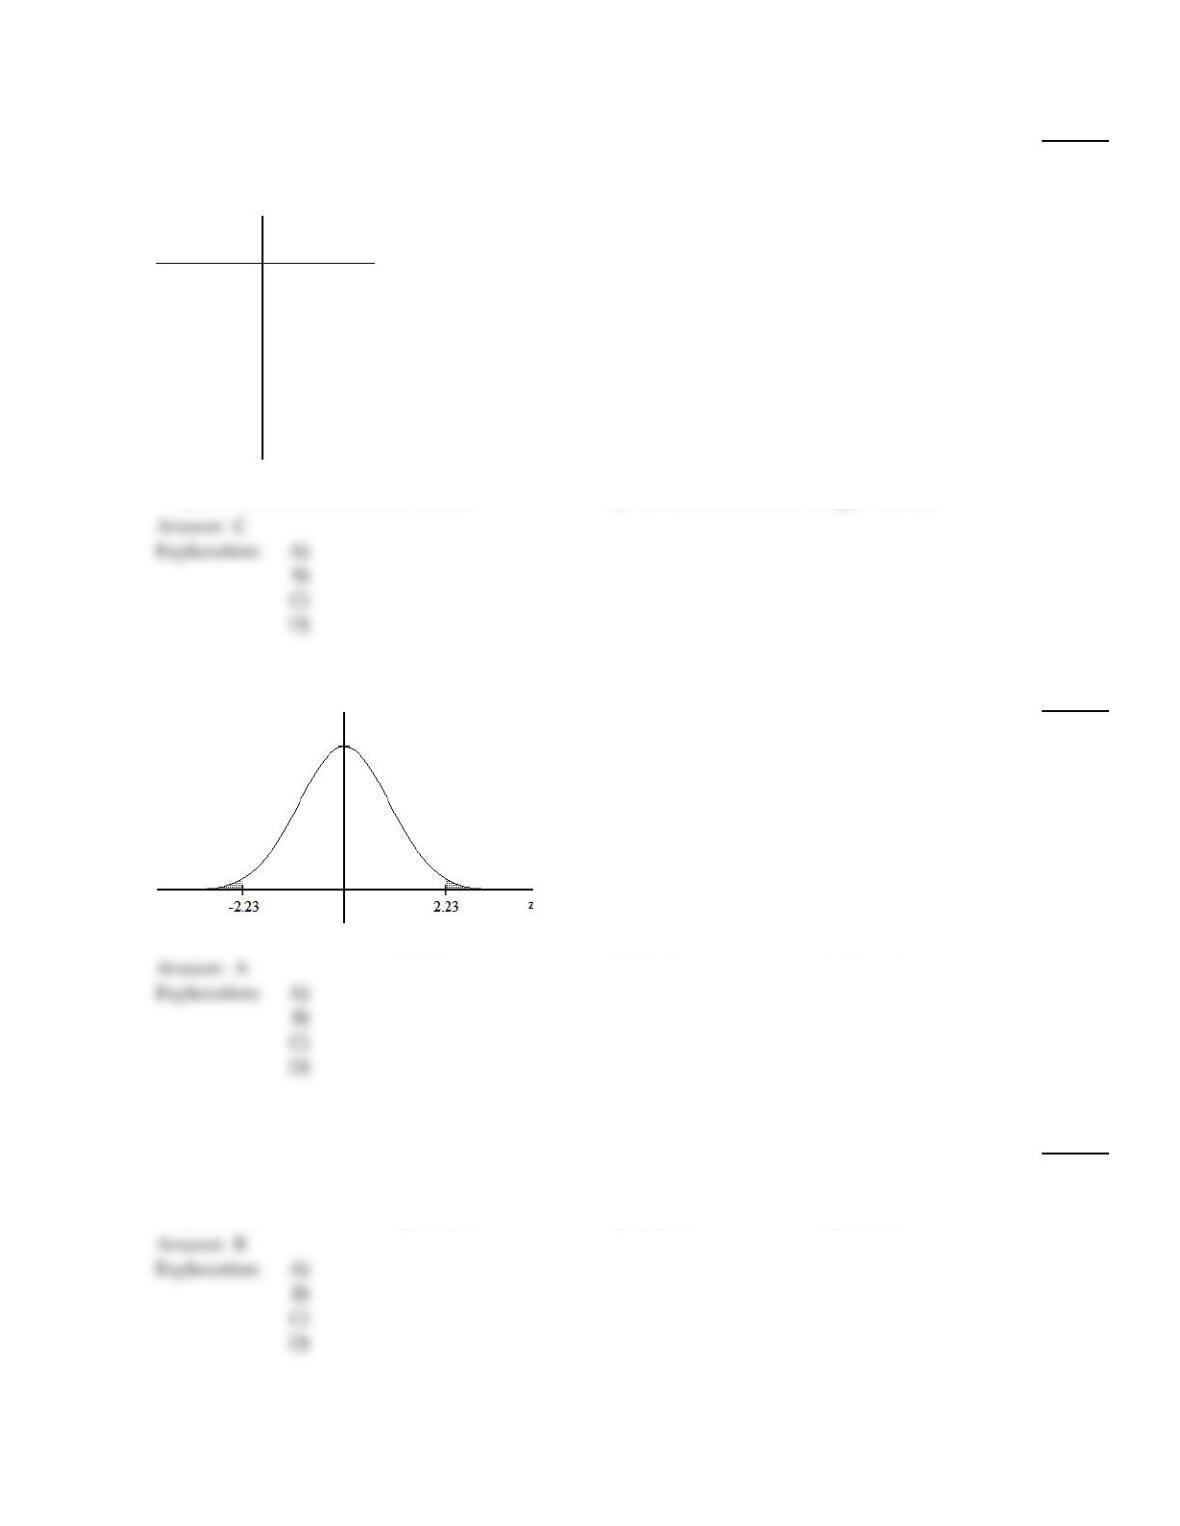
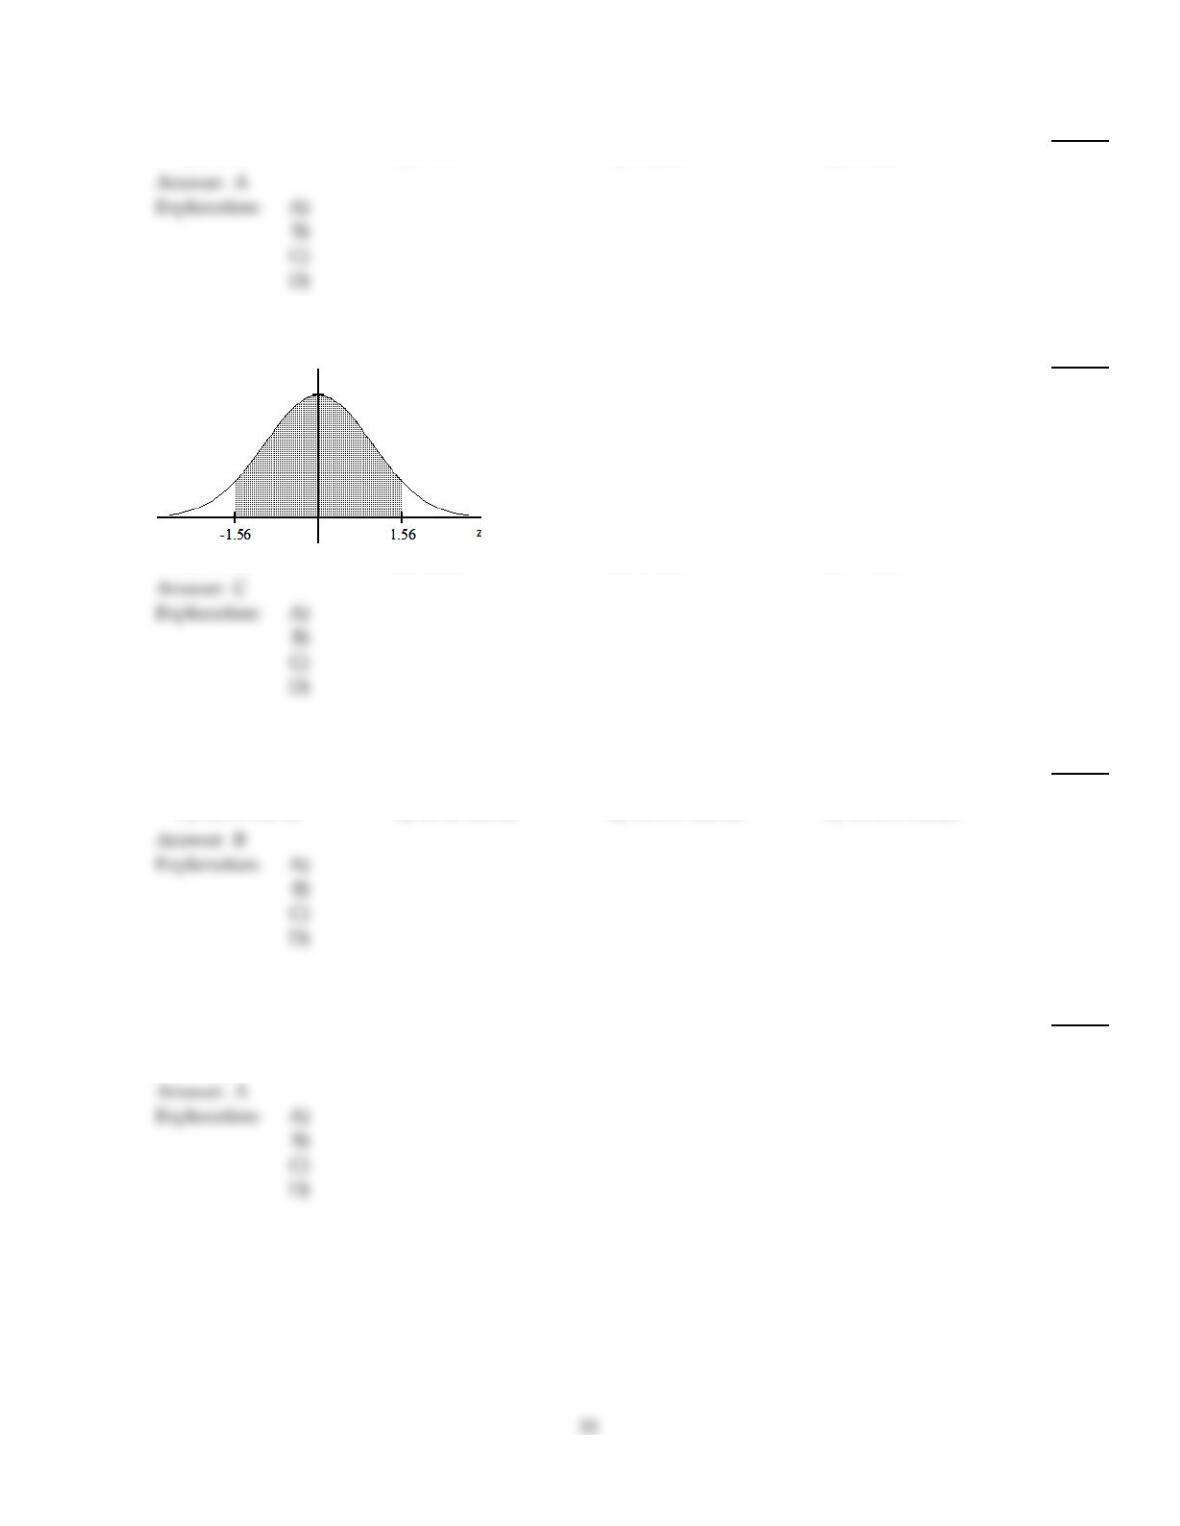
Use a table of areas to obtain the shaded area under the standard normal curve.
61)
61)
A)
0.0258
B)
0.9871
C)
0.0129
D)
0.9742
Use the empirical rule to solve the problem.
62)
The lifetimes of lightbulbs of a particular type are normally distributed with a mean of 400 hours
and a standard deviation of 10 hours. What percentage of the bulbs have lifetimes that lie within 2
standard deviations to either side of the mean?
62)
A)
97.72%
B)
95.44%
C)
68.26%
D)
99.74%
22
Estimate the indicated probability by using the normal distribution as an approximation to the binomial distribution.
63)
A certain question on a test is answered correctly by 22% of the respondents. Estimate the
probability that among the next 150 responses there will be at most 40 correct answers.
63)
A)
0.9306
B)
0.8997
C)
0.1003
D)
0.0694
Solve the problem.
64)
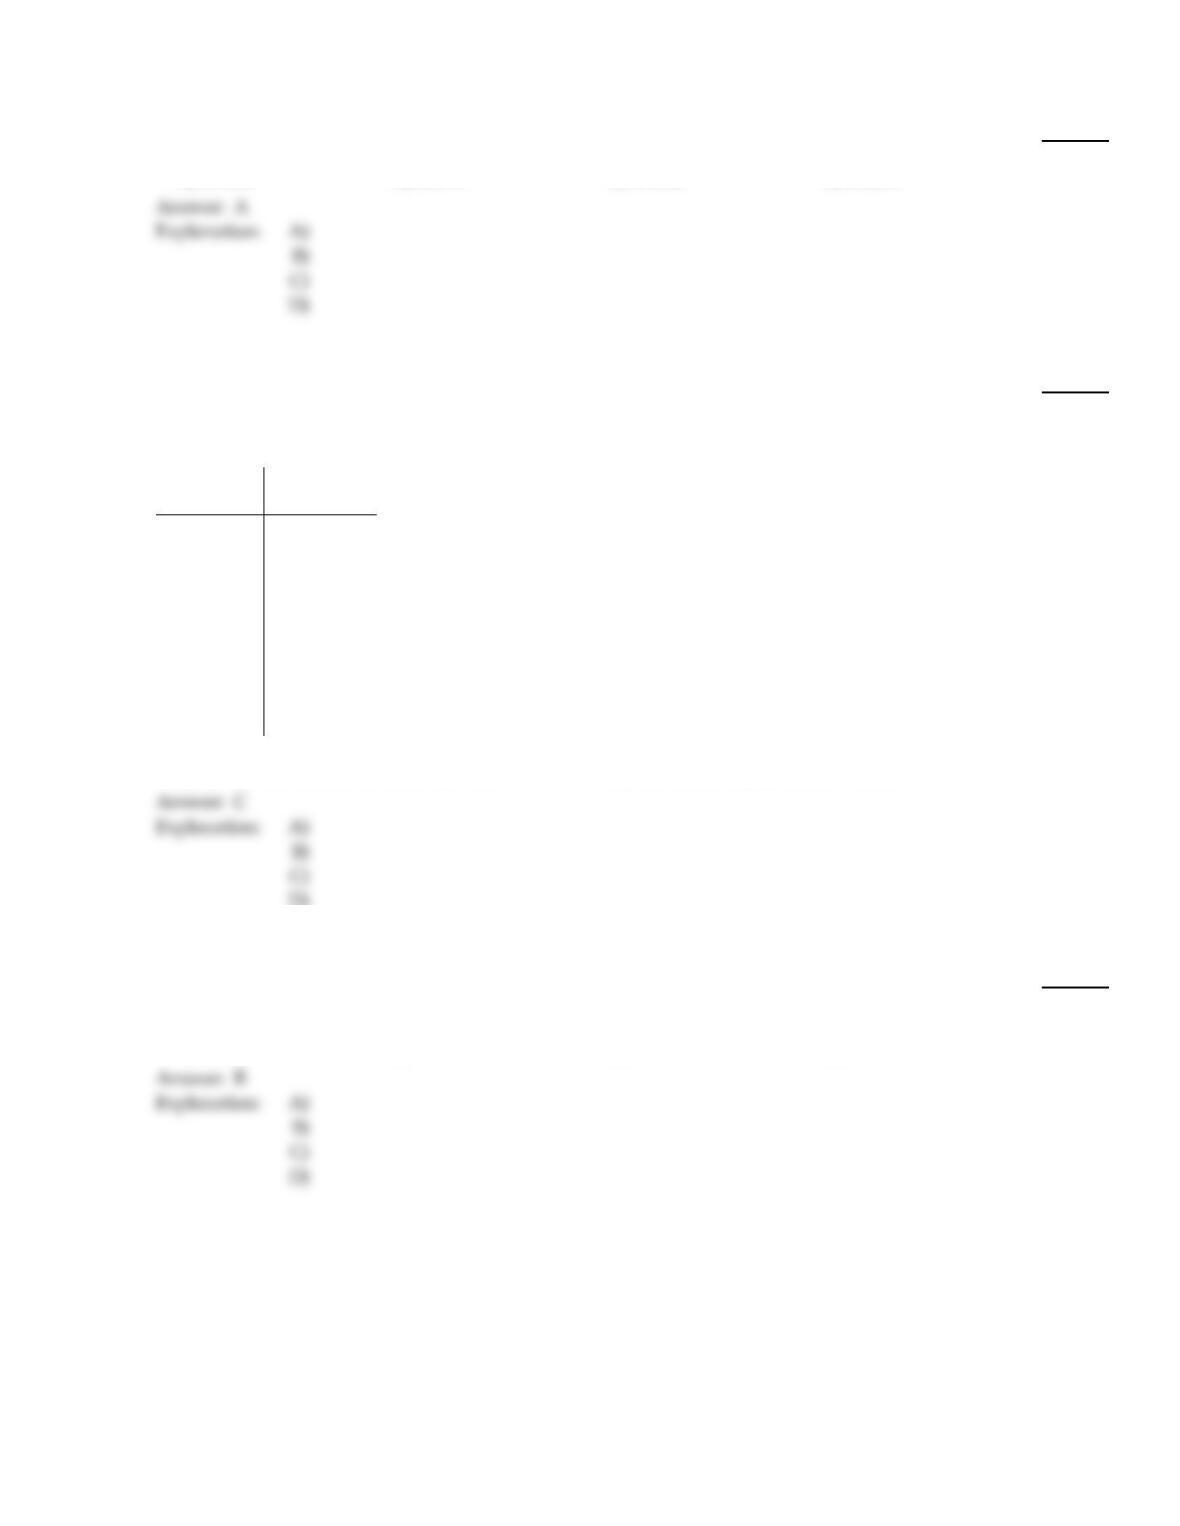
Frequency data were reported for the ages of full–time employees at a company. The age
distribution is given in the table. Obtain a relative–frequency histogram of these data and
determine whether the ages are approximately normally distributed.
Age
(yrs)
Frequency
25–under 30 20
30–under 35 65
35–under 40 60
40–under 45 112
45–under 50 266
50–under 55 300
55–under 60 385
60–under 65 200
65–under 70 36
64)
A)
Yes. The distribution is bell–shaped.
B)
No. The distribution is right–skewed.
C)
No. The distribution is left–skewed.
D)
No. The distribution is uniform.
D)
Use the empirical rule to solve the problem.
65)
The systolic blood pressure of 18–year–old women is normally distributed with a mean of 120
mmHg and a standard deviation of 12 mmHg. What percentage of 18–year–old women have a
systolic blood pressure that lies within 3 standard deviations to either side of the mean?
65)
A)
68.26%
B)
99.74%
C)
95.44%
D)
99.99%
D)
23
D)
Estimate the indicated probability by using the normal distribution as an approximation to the binomial distribution.
66)
Estimate the probability that in 200 rolls of a balanced die, the number of sixes is between 36 and 45
inclusive.
66)
A)
0.2639
B)
0.2914
C)
0.3239
D)
0.3305
Fill in the blanks by standardizing the normally distributed variable.
67)
The amount of time that customers wait in line during peak hours at one bank is normally
distributed with a mean of 12 minutes and a standard deviation of 2 minutes. The percentage of
time that the waiting time is less than 13 minutes is equal to the area under the standard normal
curve that lies to the ___ of ___.
67)
A)
right, 0.92
B)
left, 0.5
C)
right, 0.5
D)
left, –0.5
68)
Dave drives to work each morning at about the same time. His commute time is normally
distributed with a mean of 54 minutes and a standard deviation of 7 minutes. The percentage of
time that his commute time lies between 40 and 75 minutes is equal to the area under the standard
normal curve between ___ and ___.
68)
A)
–1.5, 3.5
B)
0, 1
C)
–2, 3
D)
–2.5, 2.5
Provide an appropriate response.
69)
Which of the variables below do you think will be roughly normally distributed?
a. Weights of 10 year old boys
b. Incomes of 40 year old adults
c. The numbers that show up when you roll a balanced die
d. The amount of coffee which a filling machine puts into “4 ounce jars”
69)
A)
a, b, c, d
B)
a only
C)
a and d
D)
a, b, d
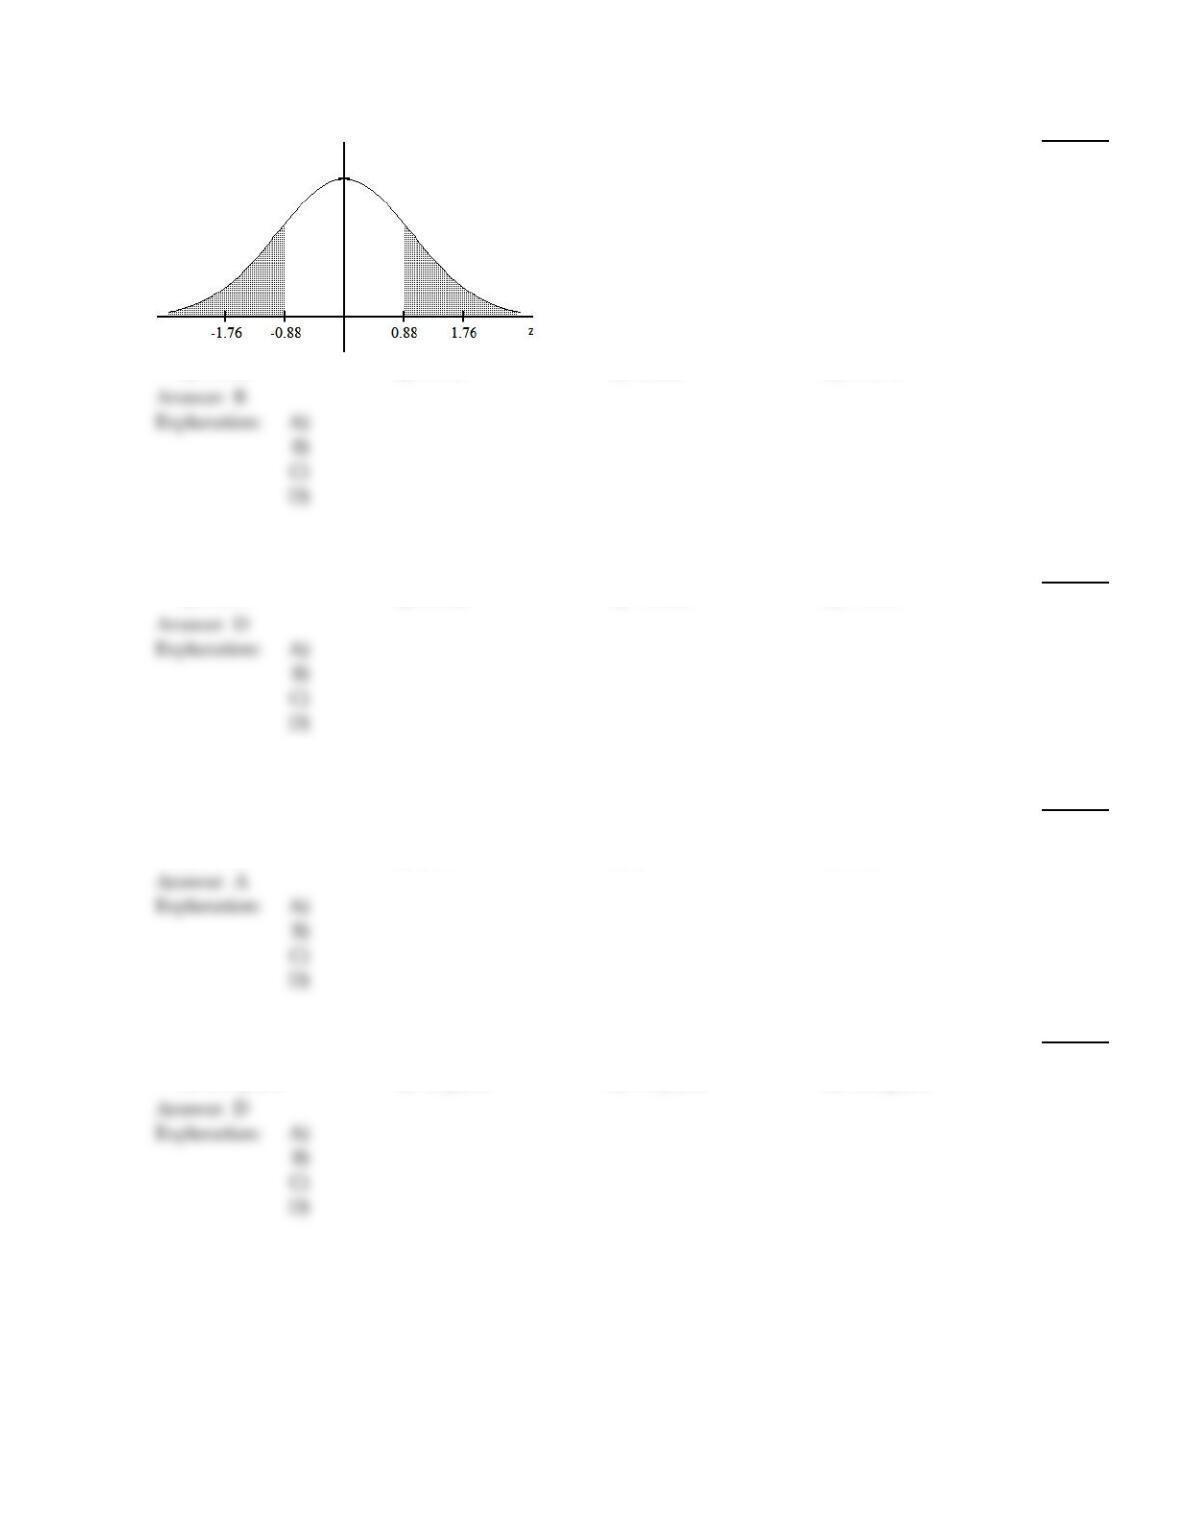
Use a table of areas to obtain the shaded area under the standard normal curve.
70)
70)
A)
0.8106
B)
0.3788
C)
0.6212
D)
0.1894
Use a table of areas to find the specified area under the standard normal curve.
71)
The area that lies to the right of –1.82
71)
A)
0.4656
B)
0.0344
C)
–0.0344
D)
0.9656
Find the specified percentile, quartile, or decile.
72)
At one college, GPAs are normally distributed with a mean of 2.6 and a standard deviation of 0.6.
Find the third quartile, Q3.
72)
A)
3.002
B)
2.198
C)
2.9
D)
3.05
73)
Suppose that replacement times for washing machines are normally distributed with a mean of 8.8
years and a standard deviation of 2 years. Find the 82nd percentile.
73)
A)
10.1 years
B)
9.2 years
C)
7.0 years
D)
10.6 years
25
74)
The lifetimes of lightbulbs of a particular type are normally distributed with a mean of 201 hours
and a standard deviation of 11 hours. Find the first quartile, Q1.
74)
A)
198.25
B)
203.75
C)
193.63
D)
208.37
D)
Use a table of areas for the standard normal curve to find the required z–score.
75)
Find the z–score for having area 0.09 to its right under the standard normal curve, that is, find
z0.09
75)
A)
1.34
B)
1.26
C)
1.45
D)
1.39
D)
76)
Find the z–score for which the area under the standard normal curve to its left is 0.40
76)
A)
–0.57
B)
0.25
C)
0.57
D)
–0.25
D)
Find the indicated probability or percentage for the normally distributed variable.
77)
The incomes of trainees at a local mill are normally distributed with a mean of $1,100 and a
standard deviation $150. What percentage of trainees earn less than $900 a month?
77)
A)
40.82%
B)
90.82%
C)
35.31%
D)
9.18%
D)
Estimate the indicated probability by using the normal distribution as an approximation to the binomial distribution.
78)
In one county, the conviction rate for speeding is 85%. Estimate the probability that of the next 100
speeding summonses issued, there will be at least 90 convictions.
78)
A)
0.3962
B)
0.8962
C)
0.0420
D)
0.1038
D)
Provide an appropriate response.
79)
True or false, the standard deviation of a normally distributed variable can be any real number.
79)
A)
True
B)
False
Find the specified percentile, quartile, or decile.
80)
The amount of Jen’s monthly phone bill is normally distributed with a mean of $70 and a standard
deviation of $11. Find the first quartile, Q1.
80)
A)
$64.5
B)
$77.37
C)
$72.75
D)
$62.63
Estimate the indicated probability by using the normal distribution as an approximation to the binomial distribution.
81)
Estimate the probability of getting exactly 43 boys in 90 births.
81)
A)
0.0764
B)
0.0729
C)
0.0159
D)
0.1628
Use the empirical rule to solve the problem.
82)
At one college, GPAs are normally distributed with a mean of 3 and a standard deviation of 0.4.
What percentage of students at the college have a GPA between 2.6 and 3.4?
82)
A)
95.44%
B)
99.74%
C)
84.13%
D)
68.26%
Find the specified percentile, quartile, or decile.
83)
Scores on an English test are normally distributed with a mean of 33.1 and a standard deviation of
7. Find the 41st percentile.
83)
A)
37.2
B)
29.0
C)
31.5
D)
34.7
27
Provide an appropriate response. Assume that the variable under consideration has a density curve.
84)
The area under the density curve that lies to the right of 15 is 0.545. What percentage of all possible
observations of the variable are at most 15?
84)
A)
45.5%
B)
79.5%
C)
54.5%
D)
20.5%
Find the indicated probability or percentage for the normally distributed variable.
85)
The diameters of bolts produced by a certain machine are normally distributed with a mean of 0.30
inches and a standard deviation of 0.01 inches. What percentage of bolts will have a diameter
greater than 0.32 inches?
85)
A)
37.45%
B)
2.28%
C)
97.72%
D)
47.72%
Solve the problem.
86)
Frequency data were reported for the ages of full–time employees at a company. The age
distribution is given in the table. Obtain a relative–frequency histogram of these data and
determine whether the ages are approximately normally distributed.
Age
(yrs)
Frequency
25–under 30 23
30–under 35 25
35–under 40 24
40–under 45 30
45–under 50 26
50–under 55 22
55–under 60 27
60–under 65 30
65–under 70 19
86)
A)
No. The distribution is uniform.
B)
Yes. The distribution is bell–shaped.
C)
No. The distribution is right–skewed.
D)
No. The distribution is left–skewed.
Provide an appropriate response.
87)
The area under the standard normal curve between 1 and 2 is equal to 0.1359. Scores on a
particular aptitude test are normally distributed with a mean of 100 and a standard deviation of
10. Which of the following are equal to 13.59%?
a. The percentage of scores between 120 and 130
b. The percentage of scores between 110 and 120
c. The percentage of scores between 80 and 90
d. The percentage of scores between 90 and 120
e. The percentage of scores between 90 and 110
87)
A)
a, b
B)
b
C)
b, c
D)
e
Find the indicated probability or percentage for the normally distributed variable.
88)
The variable X is normally distributed.The mean is µ= 22.0 and the standard deviation is = 2.4.
Find P(19.7 < X < 25.3).
88)
A)
0.7477
B)
0.3370
C)
0.4107
D)
1.0847
Provide an appropriate response.
89)
Which of the following statements concerning areas under the standard normal curve is/are true?
a. If a z–score is negative, the area to its right is greater than 0.5
b. If the area to the right of a z–score is less than 0.5, the z–score is negative.
c. If a z–score is positive, the area to its left is less than 0.5
89)
A)
b, c
B)
a, c
C)
a
D)
a, b
Use the empirical rule to solve the problem.
90)
The amount of Jen’s monthly phone bill is normally distributed with a mean of $73 and a standard
deviation of $11. What percentage of her phone bills are between $40 and $106?
90)
A)
99.74%
B)
68.26%
C)
95.44%
D)
99.99%
29
Estimate the indicated probability by using the normal distribution as an approximation to the binomial distribution.
91)
A multiple choice test consists of 60 questions. Each question has 4 possible answers of which one is
correct. If all answers are random guesses, estimate the probability of getting at least 20% correct.
91)
A)
0.3508
B)
0.8508
C)
0.1492
D)
0.0901
Use a table of areas to obtain the shaded area under the standard normal curve.
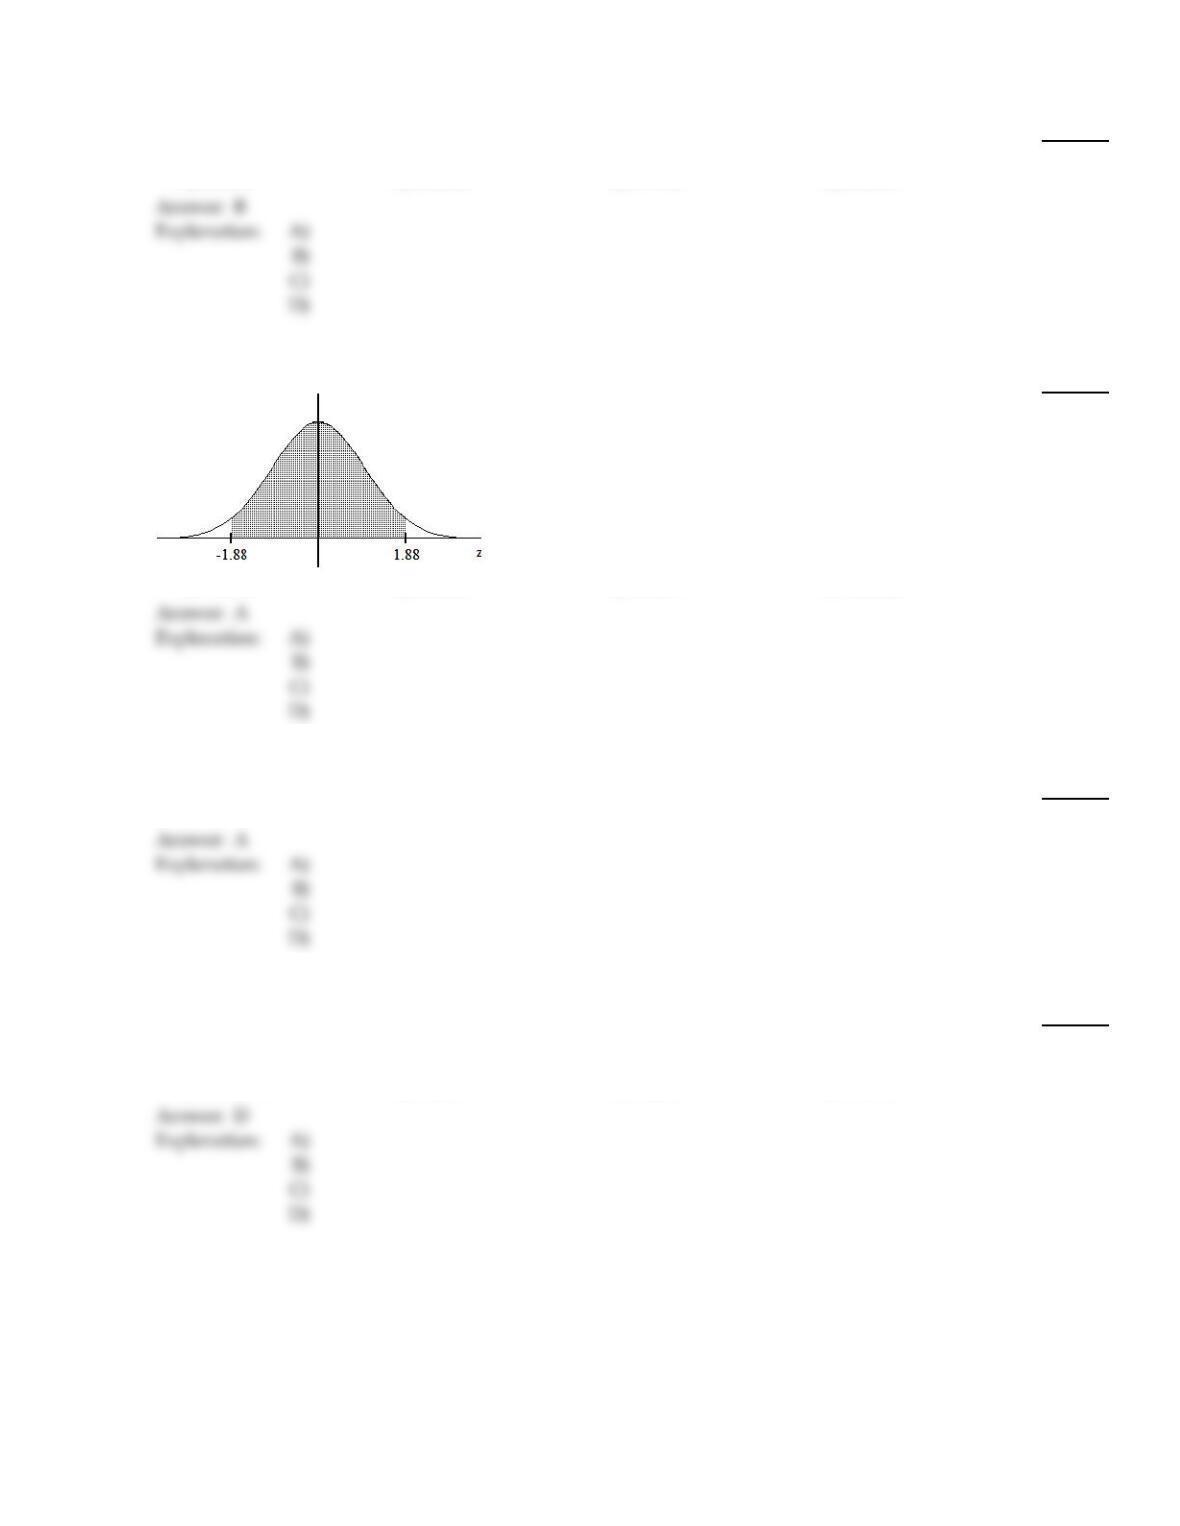
92)
92)
A)
0.9398
B)
0.0301
C)
0.9699
D)
0.0602
Use a table of areas to find the specified area under the standard normal curve.
93)
The area that lies between 0 and 3.01
93)
A)
0.4987
B)
0.5013
C)
0.1217
D)
0.9987
Find the indicated probability or percentage for the normally distributed variable.
94)
Assume that the weights of quarters are normally distributed with a mean of 5.67 g and a standard
deviation 0.070 g. A vending machine will only accept coins weighing between 5.48 g and 5.82 g.
What percentage of legal quarters will be rejected?
94)
A)
0.0196%
B)
2.48%
C)
1.62%
D)
1.96%
30
Provide an appropriate response.
95)
Most problems involving normally distributed variables are one of two types.
Type A: Find a probability or percentage, e.g. find the probability that X lies in a specified range.
Type B: Find the observation corresponding to a given probability or percentage.
Suppose that scores on a test are normally distributed with a mean of 80 and a standard deviation
of 8. Which of the following questions below are of type B?
a. Find the 80th percentile.
b. Find the cutoff for the A grade if the top 10% get an A.
c. Find the percentage scoring more than 90.
d. Find the score that separates the bottom 30% from the top 70%.
e. Find the probability that a randomly selected student will score more than 80.
95)
A)
a, b, c, d
B)
c, e
C)
b, d
D)
a, b, d
Estimate the indicated probability by using the normal distribution as an approximation to the binomial distribution.
96)
The probability that a radish seed will germinate is 0.7. Estimate the probability that of 140
randomly selected seeds, exactly 100 will germinate.
96)
A)
0.0679
B)
0.9331
C)
0.0769
D)
0.0669
D)
Find the specified percentile, quartile, or decile.
97)
A bank‘s loan officer rates applicants for credit. The ratings are normally distributed with a mean of
200 and a standard deviation of 50. Find the 6th decile.
97)
A)
187.5
B)
212.5
C)
207.8
D)
211.3
D)
Use a table of areas to find the specified area under the standard normal curve.
98)
The area that lies either to the left of –2.61 or to the right of 0.66
98)
A)
0.2591
B)
1.2501
C)
0.7499
D)
0.7409
D)
Solve the problem.
99)
Frequency data were reported for the ages of women who became mothers during one year in a
selected U.S. city. The age distribution is given in the table. Obtain a relative–frequency histogram
of these data and determine whether the ages are approximately normally distributed.
Age
(yrs)
Frequency
10–under 15 10
15–under 20 87
20–under 25 888
25–under 30 679
30–under 35 245
35–under 40 227
40–under 45 123
45–under 50 79
99)
A)
No. The distribution is left–skewed.
B)
Yes. The distribution is bell–shaped.
C)
No. The distribution is uniform.
D)
No. The distribution is right–skewed.
Use a table of areas to find the specified area under the standard normal curve.
100)
The area that lies to the right of 0.59
100)
A)
0.7224
B)
0.2190
C)
0.2776
D)
0.2224
101)
The area that lies either to the left of 1.56 or to the right of 2.30
101)
A)
0.9513
B)
0.0701
C)
0.0487
D)
0.9299
Provide an appropriate response. Assume that the variable under consideration has a density curve.
102)
The percentage of all possible observations of the variable that lie between 6 and 12 equals the area
under its density curve between and , expressed as a percentage.
102)
A)
7, 13
B)
6, 12
C)
3, 6
D)
0.06, 0.12
Use a table of areas to find the specified area under the standard normal curve.
103)
The area that lies to the left of 1.13
103)
A)
0.8708
B)
0.8907
C)
0.1292
D)
0.8485
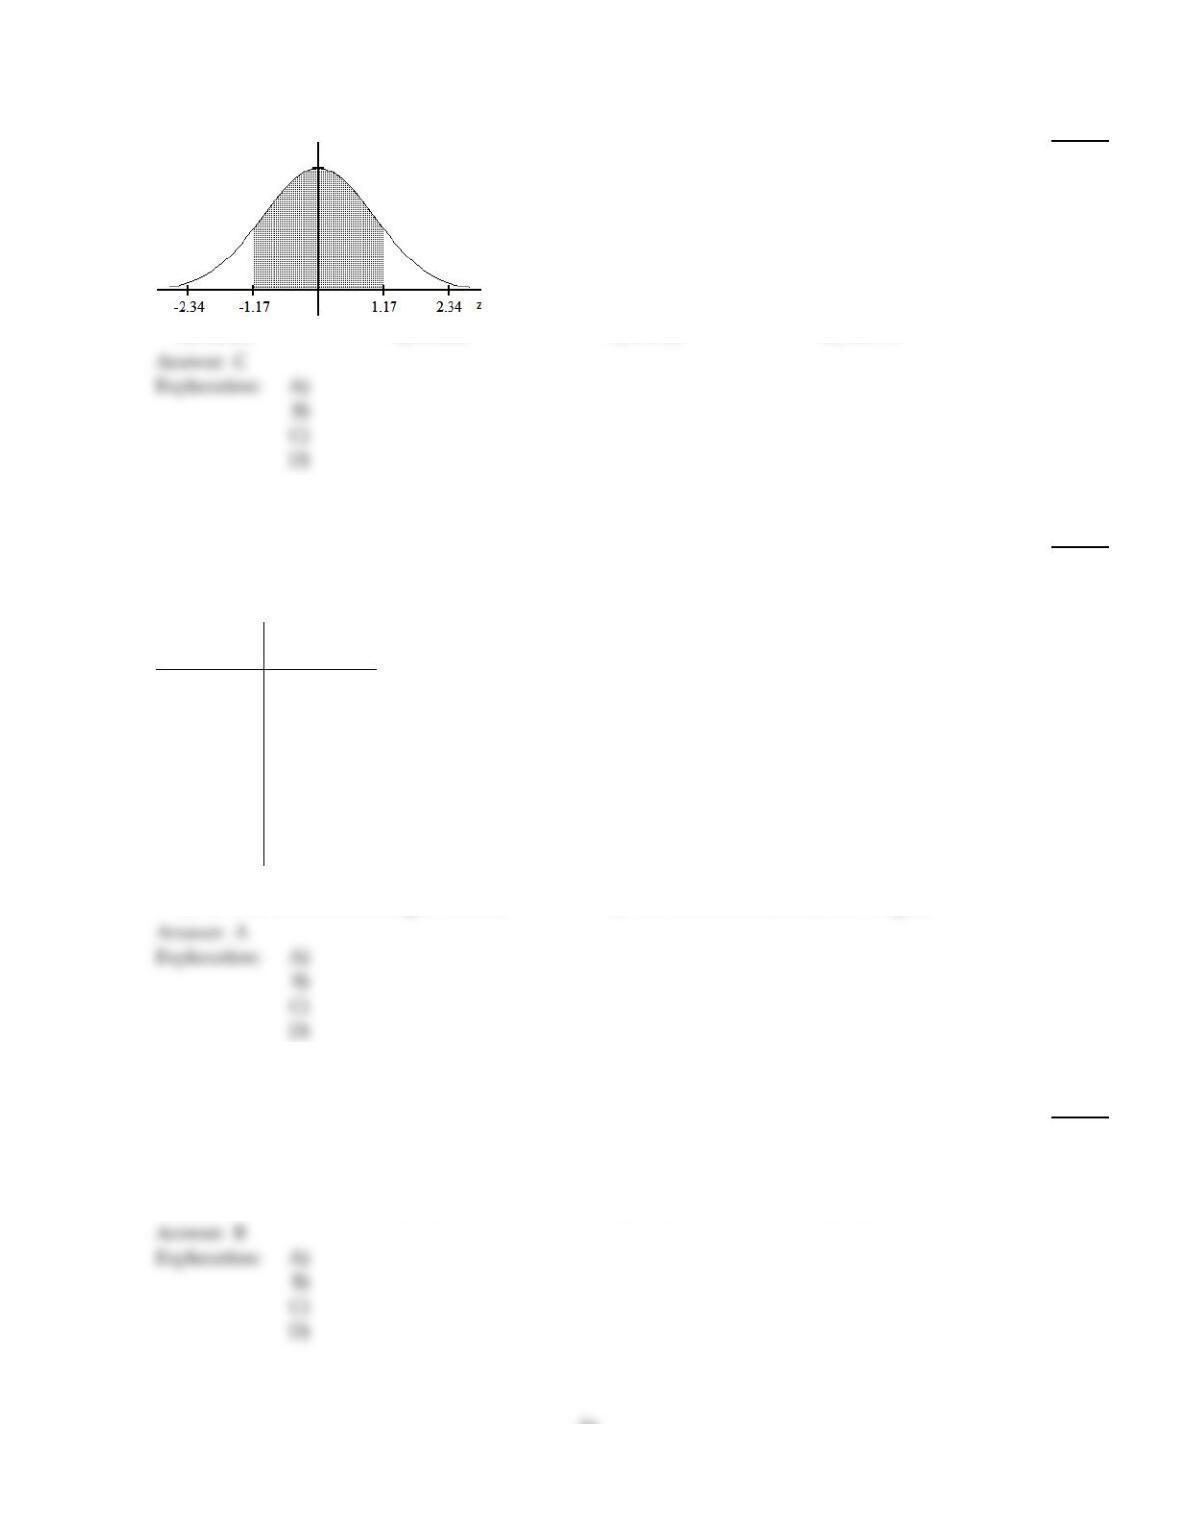
Use a table of areas to obtain the shaded area under the standard normal curve.
104)
104)
A)
0.0594
B)
0.1188
C)
0.8812
D)
0.9406
Find the specified percentile, quartile, or decile.
105)
The annual precipitation for one city is normally distributed with a mean of 33.4 inches and a
standard deviation of 3.5 inches. Find the 2nd decile.
105)
A)
36.34 inches
B)
30.46 inches
C)
40.575 inches
D)
26.225 inches
Estimate the indicated probability by using the normal distribution as an approximation to the binomial distribution.
106)
A product is manufactured in batches of 120 and the overall rate of defects is 5%. Estimate the
probability that a randomly selected batch contains more than 6 defects.
106)
A)
0.4168
B)
0.4641
C)
0.0832
D)
0.5871
Use a table of areas to obtain the shaded area under the standard normal curve.
107)
107)
A)
0.2420
B)
0.1210
C)
0.7580
D)
0.8790
Solve the problem.
108)
Frequency data were reported for the ages of women who became mothers during one year in a
selected U.S. city. The age distribution is given in the table. Obtain a relative–frequency histogram
of these data and determine whether the ages are approximately normally distributed.
Age
(yrs)
Frequency
15–under 20 101
20–under 25 270
25–under 30 285
30–under 35 479
35–under 40 867
40–under 45 1021
45–under 50 225
50–under 55 56
108)
A)
No. The distribution is left–skewed.
B)
No. The distribution is J–shaped.
C)
No. The distribution is right–skewed.
D)
Yes. The distribution is bell–shaped.
Fill in the blanks by standardizing the normally distributed variable.
109)
The amount of time that customers wait in line during peak hours at one bank is normally
distributed with a mean of 13 minutes and a standard deviation of 2 minutes. The percentage of
time that the waiting time lies between 11 and 13 minutes is equal to the area under the standard
normal curve between ___ and ___.
109)
A)
0, 1
B)
–1, 0
C)
0.69, 0.85
D)
–2, 0
34
Use a table of areas for the standard normal curve to find the required z–score.
110)
Find the z–score for which the area under the standard normal curve to its left is 0.04
110)
A)
–1.63
B)
–1.48
C)
–1.75
D)
–1.89
Provide an appropriate response. Assume that the variable under consideration has a density curve.
111)
Given that 33.6% of all possible observations of the variable are less than 10, determine the area
under the density curve that lies to the right of 10.
111)
A)
0.414
B)
0.164
C)
0.664
D)
0.336
Find the indicated probability or percentage for the normally distributed variable.
112)
The variable X is normally distributed. The mean is µ= 60.0 and the standard deviation is = 4.0.
Find P(X < 53.0).
112)
A)
0.9599
B)
0.0401
C)
0.5589
D)
0.0802
Solve the problem.
113)
A southeastern college has an enrollment of 2951 female students. Records show that the mean
height of these students is 64.7 inches and that the standard deviation is 2.3 inches. The table shows
frequency and relative–frequency data for these heights. If you assume that the distribution of
heights is approximately normal, then you can use the table to estimate areas under the associated
normal curve (that is, under the normal curve that has parameters µ = 64.7 and = 2.3). Making
this assumption, estimate the area under the associated normal curve to the left of 61.
Height
(inches)
Freq. Relative
freq.
56–under 57 20.0007
57–under 58 70.0024
58–under 59 14 0.0047
59–under 60 31 0.0105
60–under 61 101 0.0342
61–under 62 194 0.0657
62–under 63 311 0.1054
63–under 64 410 0.1389
64–under 65 526 0.1782
65–under 66 482 0.1633
66–under 67 397 0.1345
67–under 68 254 0.0861
68–under 69 150 0.0508
69–under 70 49 0.0166
70–under 71 17 0.0058
71–under 72 50.0017
72–under 73 10.0003
113)
A)
0.9473
B)
0.0999
C)
0.0342
D)
0.0525
114)
Frequency data were reported for the ages of full–time employees at a company. The age
distribution is given in the table. Obtain a relative–frequency histogram of these data and
determine whether the ages are approximately normally distributed.
Age
(yrs)
Frequency
20–under 25 14
25–under 30 39
30–under 35 99
35–under 40 300
40–under 45 385
45–under 50 240
50–under 55 87
55–under 60 24
60–under 65 15
114)
A)
No. The distribution is uniform.
B)
No. The distribution is left–skewed.
C)
No. The distribution is right–skewed.
D)
Yes. The distribution is bell–shaped.
37