Find the sample standard deviation for the given data. Round your final answer to one more decimal place than that used
for the observations.
129)
2, 6, 15, 9, 11, 22, 1, 4, 8, 19
129)
A)
6.3
B)
2.1
C)
7.1
D)
6.8
Find the mode(s) for the given sample data.
130)
20, 21, 46, 21, 49, 21, 49
130)
A)
32.4
B)
21
C)
46
D)
49
Provide an appropriate response.
131)
Obtain the population standard deviation, , for the given data. Assume that the data represent
population data. Round your final answer to one more decimal place than that used for the
observations.
The test scores of 9 students are listed below.
83 48 60
57 90 70
87 47 91
131)
A)
322.5
B)
18.0
C)
16.9
D)
286.7
Identify potential outliers, if any, for the given data.
132)
The weekly salaries (in dollars) of sixteen government workers are listed below.
690 574 813 625
728 540 457 602
502 670 685 360
514 787 480 986
132)
A)
986
B)
360, 986
C)
360
D)
None
Find the median for the given sample data.
133)
The normal monthly precipitation (in inches) for August is listed for 20 different U.S. cities.
3.5 1.6 2.4 3.7 4.1
3.9 1.0 3.6 4.2 3.4
3.7 2.2 1.5 4.2 3.4
2.7 0.4 3.7 2.0 3.6
133)
A)
3.45 in.
B)
3.50 in.
C)
2.94 in.
D)
3.40 in.
Find the range and standard deviation for each of the two samples, then compare the two sets of results.
134)
When investigating times required for drive–through service, the following results (in seconds)
were obtained.
Restaurant A 120 67 89 97 124 68 72 96
Restaurant B 115 126 49 56 98 76 78 95
134)
A)
Restaurant A: 75; 22.2
Restaurant B: 70; 27.0
It is inconclusive as to which data set has more variation.
B)
Restaurant A: 57; 22.2
Restaurant B: 77; 27.0
Both measures indicate there is more variation in the data for restaurant B than the data for
restaurant A.
C)
Restaurant A: 57; 22.2
Restaurant B: 56; 32.9
It is inconclusive as to which data set has more variation.
D)
Restaurant A: 57; 25.0
Restaurant B: 70; 27.0
Both measures indicate there is more variation in the data for restaurant B than the data for
restaurant A.
Provide an appropriate response.
135)
A teacher records the test scores for the 30 students in her class. The standard deviation of the
scores was 10. Corresponding to each score, she calculates a z–score. Hugh’s test score was one and
a half standard deviations below the mean. What would his z–score have been?
135)
A)
1.5
B)
–15
C)
15
D)
–1.5
Solve the problem. If necessary, round your answer to one more decimal place than that used for the observations.
136)
Let x1=6, x2=14, x3=2, x4=6, and x5=9. Compute xi.
136)
A)
5
B)
28
C)
7.4
D)
37
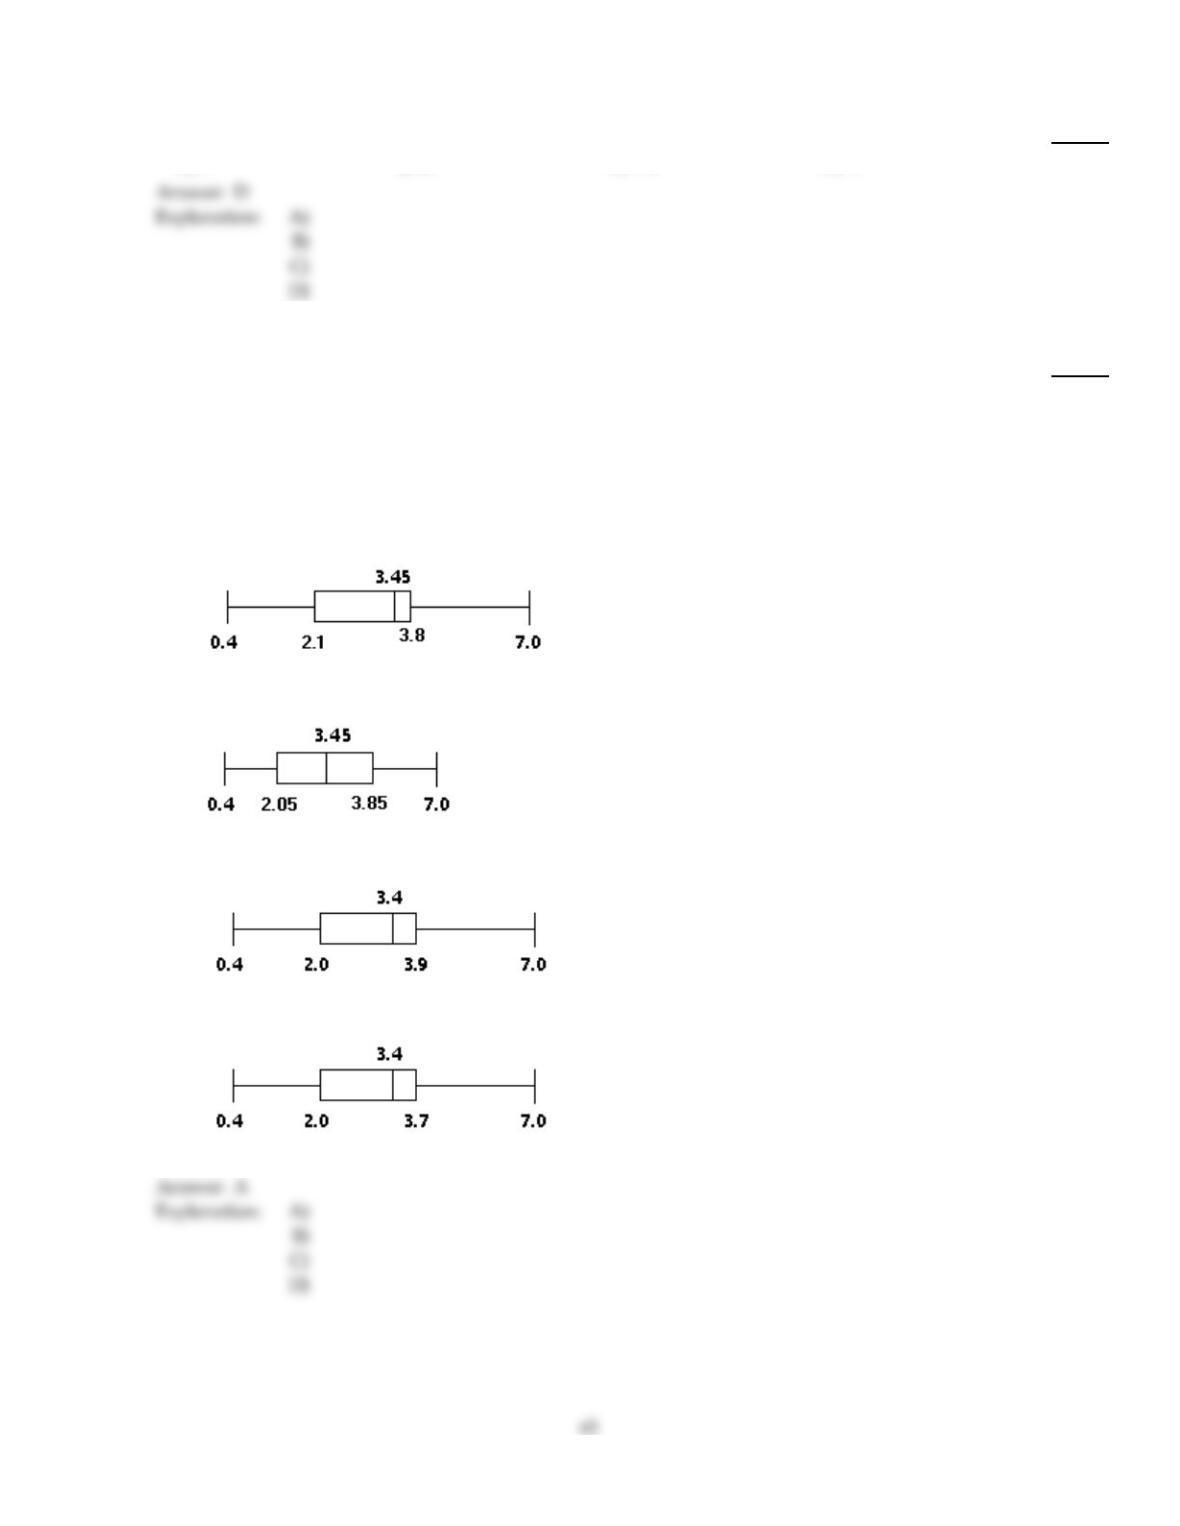
Construct and interpret a boxplot or a modified boxplot as specified.
137)
The normal monthly precipitation (in inches) for August is listed for 20 different U.S. cities.
Construct a boxplot for the data.
0.4 1.0 1.5 1.6 2.0
2.2 2.4 2.7 3.4 3.4
3.5 3.6 3.6 3.7 3.7
3.9 4.1 4.2 4.2 7.0
137)
A)
The data is slightly left–skewed.
B)
The data is symmetrical. It is a uniform distribution.
C)
The data is slightly left–skewed.
D)
The data is highly left–skewed.
Find the mean for the given sample data. Unless otherwise specified, round your answer to one more decimal place than
that used for the observations.
138)
Bill kept track of the number of hours he spent exercising each week. The results for four months are
shown below. Find the mean number of hours Bill spent exercising per week.
8.1 6.9 7.0 8.0 7.9 8.1
7.1 7.0 7.1 8.1 8.0 6.6
8.3 6.9 6.9 7.1 7.9 7.1
138)
A)
7.66 hr
B)
7.45 hr
C)
7.06 hr
D)
7.89 hr
Find the median for the given sample data.
139)
8, 3, 25, 11, 49, 43, 42
139)
A)
11
B)
42
C)
26
D)
25
Provide an appropriate response.
140)
A company’s raw–data sample of weekly salaries (in dollars) is shown below.
230 340 320 590 780 980 600 350
500 450 460 290 470 400 490 580
570 890 680 410 860 540 530 690
A frequency distribution of this data set is presented below, with a third column showing the class
midpoints.
Salary Frequency
f
Midpoint
x
200–under 300
300–under 400
400–under 500
500–under 600
600–under 700
700–under 800
800–under 900
900–under 1000
2
3
6
6
3
1
2
1
250
350
450
550
650
750
850
950
(i) Use the raw data to obtain the sample standard deviation of the ungrouped data. Round your
answer to two decimal places.
(ii) Use the grouped–data formula to obtain the sample standard deviation of the grouped data in
the frequency distribution. Round your answer to two decimal places.
(iii) Compare your answers in parts (i) and (ii).
140)
44
A)
(i) The sample standard deviation of the ungrouped data is 195.32;
(ii) The sample standard deviation of the grouped data is 171.84;
(iii) The results in parts (i) and (ii) are different. This discrepancy occurs because in the
grouped data formulas, every actual data value in a given class is replaced by the class
midpoint even though most values in the class are not equal to the midpoint.
B)
(i) The sample standard deviation of the ungrouped data is 194.48;
(ii) The sample standard deviation of the grouped data is 182.52;
(iii) The results in parts (i) and (ii) are different. This discrepancy occurs because in the
grouped data formulas, every actual data value in a given class is replaced by the class
midpoint even though most values in the class are not equal to the midpoint.
C)
(i) The sample standard deviation of the ungrouped data is 194.48;
(ii) The sample standard deviation of the grouped data is 194.48;
(iii) The results in parts (i) and (ii) are the same. The grouped data formula will always
provide the actual standard deviation when the data are grouped in classes each based on a
single value because the class midpoint is the same as each observation in each class.
D)
(i) The sample standard deviation of the ungrouped data is 171.84;
(ii) The sample standard deviation of the grouped data is 171.84;
(iii) The results in parts (i) and (ii) are the same. The grouped data formula will always
provide the actual standard deviation when the data are grouped in classes each based on a
single value because the class midpoint is the same as each observation in each class.
Obtain the five–number summary for the given data.
141)
Here are the average mathematics achievement scores for ninth graders in 34 counties.
606 588 587 586 582 580 561 555 550
548 542 540 538 537 534 532 530 529
515 512 501 498 493 489 485 472 465
462 458 444 435 431 407 378
141)
A)
378, 485, 529.5, 555, 606
B)
378, 485, 530, 550, 606
C)
378, 472, 530, 550, 606
D)
378, 472, 529.5, 550, 606
Find the mean for the given sample data. Unless otherwise specified, round your answer to one more decimal place than
that used for the observations.
142)
The local Tupperware dealers earned these commissions last month:
$3648.93 $4116.87 $2609.40 $2176.20
$4025.26 $3158.70 $2837.88
$2735.46 $1933.28 $1660.52
What was the mean commission earned? Round your answer to the nearest cent.
142)
A)
$2884.25
B)
$3612.81
C)
$3211.39
D)
$2890.25
Solve the problem.
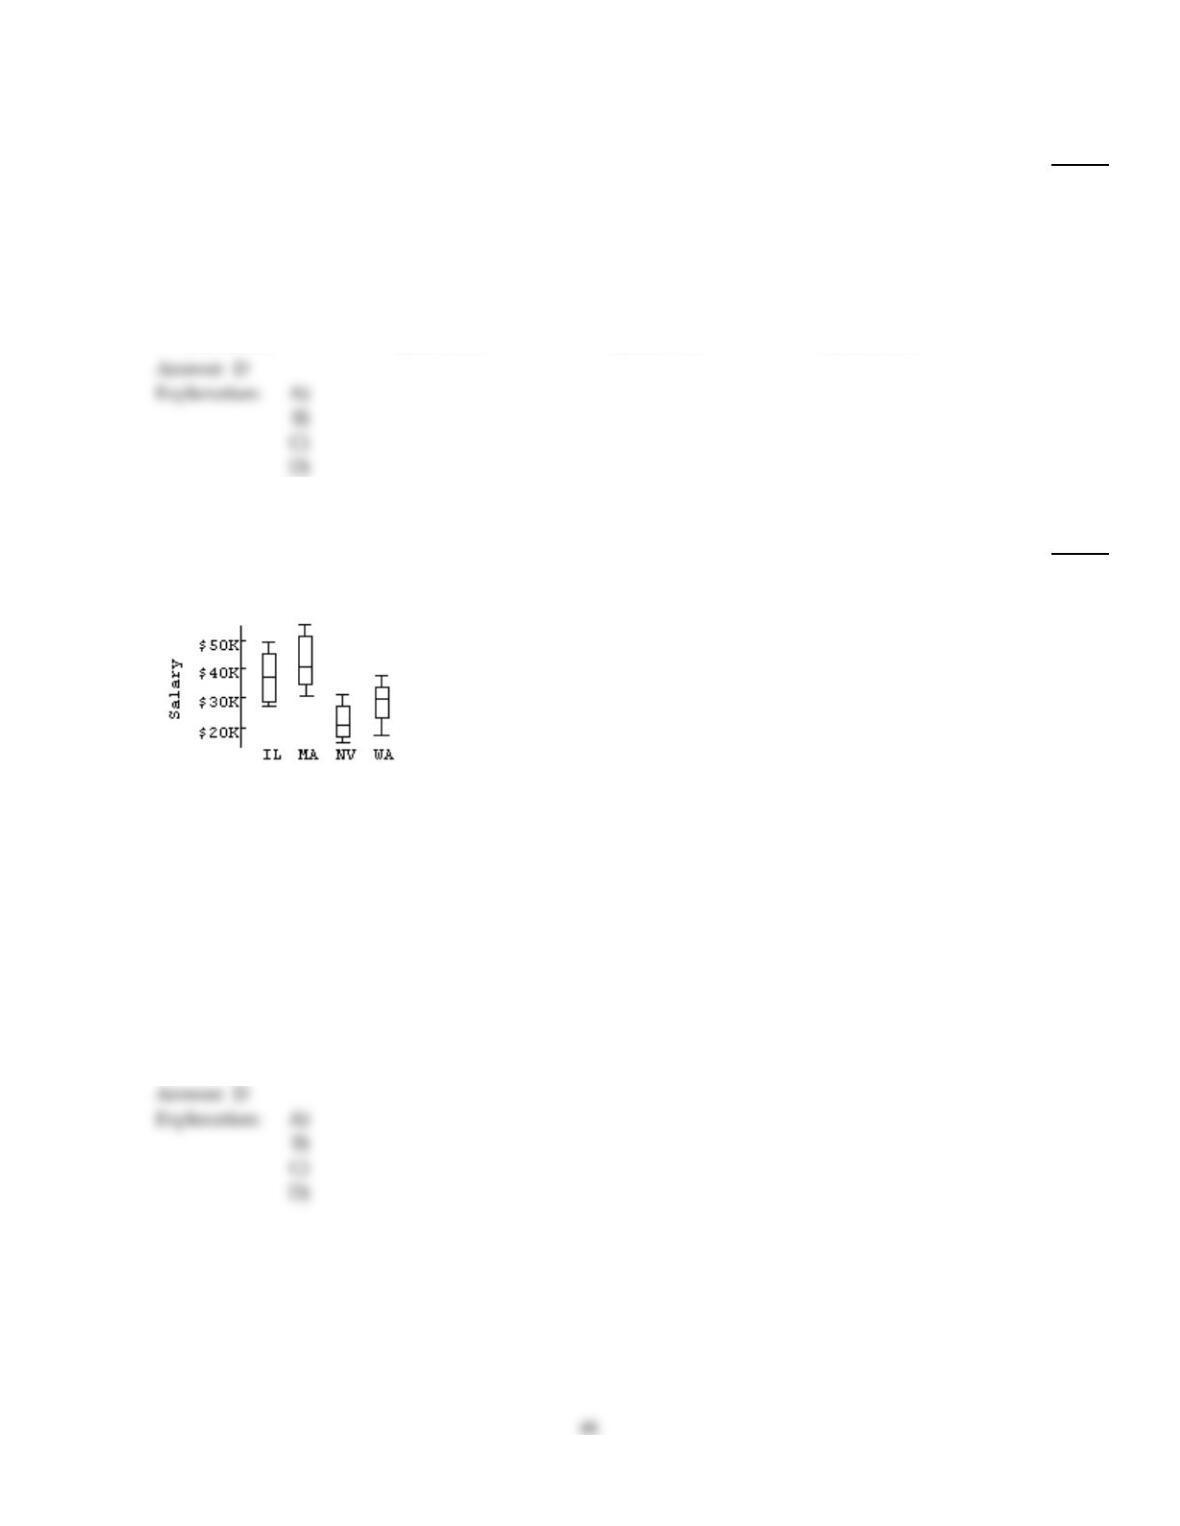
143)
Describe what these boxplots tell you about the relationship between the state you live in and your
salary, based on the same occupation.
143)
A)
IL and MA have very comparable salaries. The average salaries for these states are just below
$40K, but their variations are different. NV is not very comparable to either IL or MA. The
upper 50% of salaries for NV corresponds to the lower 50% of WA salaries.
B)
IL and MA have very comparable salaries. The average salaries for these states are just above
$40K, and their variations are very close. NV is very comparable to IL and MA. The upper
50% of salaries for NV corresponds to the lower 50% of WA salaries.
C)
IL and MA don’t have very comparable salaries. The average salaries for these states are just
below $40K, and their variations are different. NV is not very comparable to either IL or MA.
The upper 50% of salaries for WA corresponds to the lower 50% of NV salaries.
D)
IL and MA have very comparable salaries. The average salaries for these states are just below
$40K, and their variations are very close. NV is not very comparable to either IL or MA. The
upper 50% of salaries for NV corresponds to the lower 50% of WA salaries.
Find the range for the given data set.
144)
Here are costs (in dollars) of 12 electric smoothtop ranges.
860 1000 650 560 1460 1100
700 760 810 1300 550 1060
144)
A)
$895
B)
$940
C)
$910
D)
$925
Provide an appropriate response.
145)
The test scores of 40 students are summarized in the frequency distribution below. Find the
standard deviation.
Score Students
50 –under60 14
60–under 70 5
70–under 80 8
80–under 90 7
90–under 100 6
145)
A)
13.4
B)
15.6
C)
14.2
D)
14.9
Find the sample standard deviation for the given data. Round your final answer to one more decimal place than that used
for the observations.
146)
The manager of a small dry cleaner employs six people. As part of their personnel file, she asked
each one to record to the nearest one–tenth of a mile the distance they travel one way from home to
work. The six distances are listed below.
17.1 17.4 41.5 27.4 10.8 23.2
146)
A)
3146.46 mi
B)
3723.06 mi
C)
34.45 mi
D)
10.74 mi
147)
196, 205, 215, 185, 229, 278, 165
147)
A)
33.1
B)
12.7
C)
36.2
D)
30.2
Identify potential outliers, if any, for the given data.
148)
The weights (in ounces) of 27 tomatoes are listed below.
1.7 2.0 2.2 2.2 2.4 2.5 2.5 2.5 2.6
2.6 2.6 2.6 2.6 2.7 2.8 2.8 2.8 2.9
2.9 2.9 3.0 3.0 3.1 3.1 3.3 3.6 4.2
148)
A)
1.7, 3.6, 4.2
B)
4.2
C)
1.7, 4.2
D)
None
149)
The test scores of 15 students are listed below.
38 41 56 65 66
68 70 72 74 77
78 82 87 90 99
149)
A)
38, 99
B)
38
C)
38, 41
D)
None
Find the median for the given sample data.
150)
3, 7, 18, 21, 30, 30, 49
150)
A)
18
B)
25.5
C)
21
D)
30
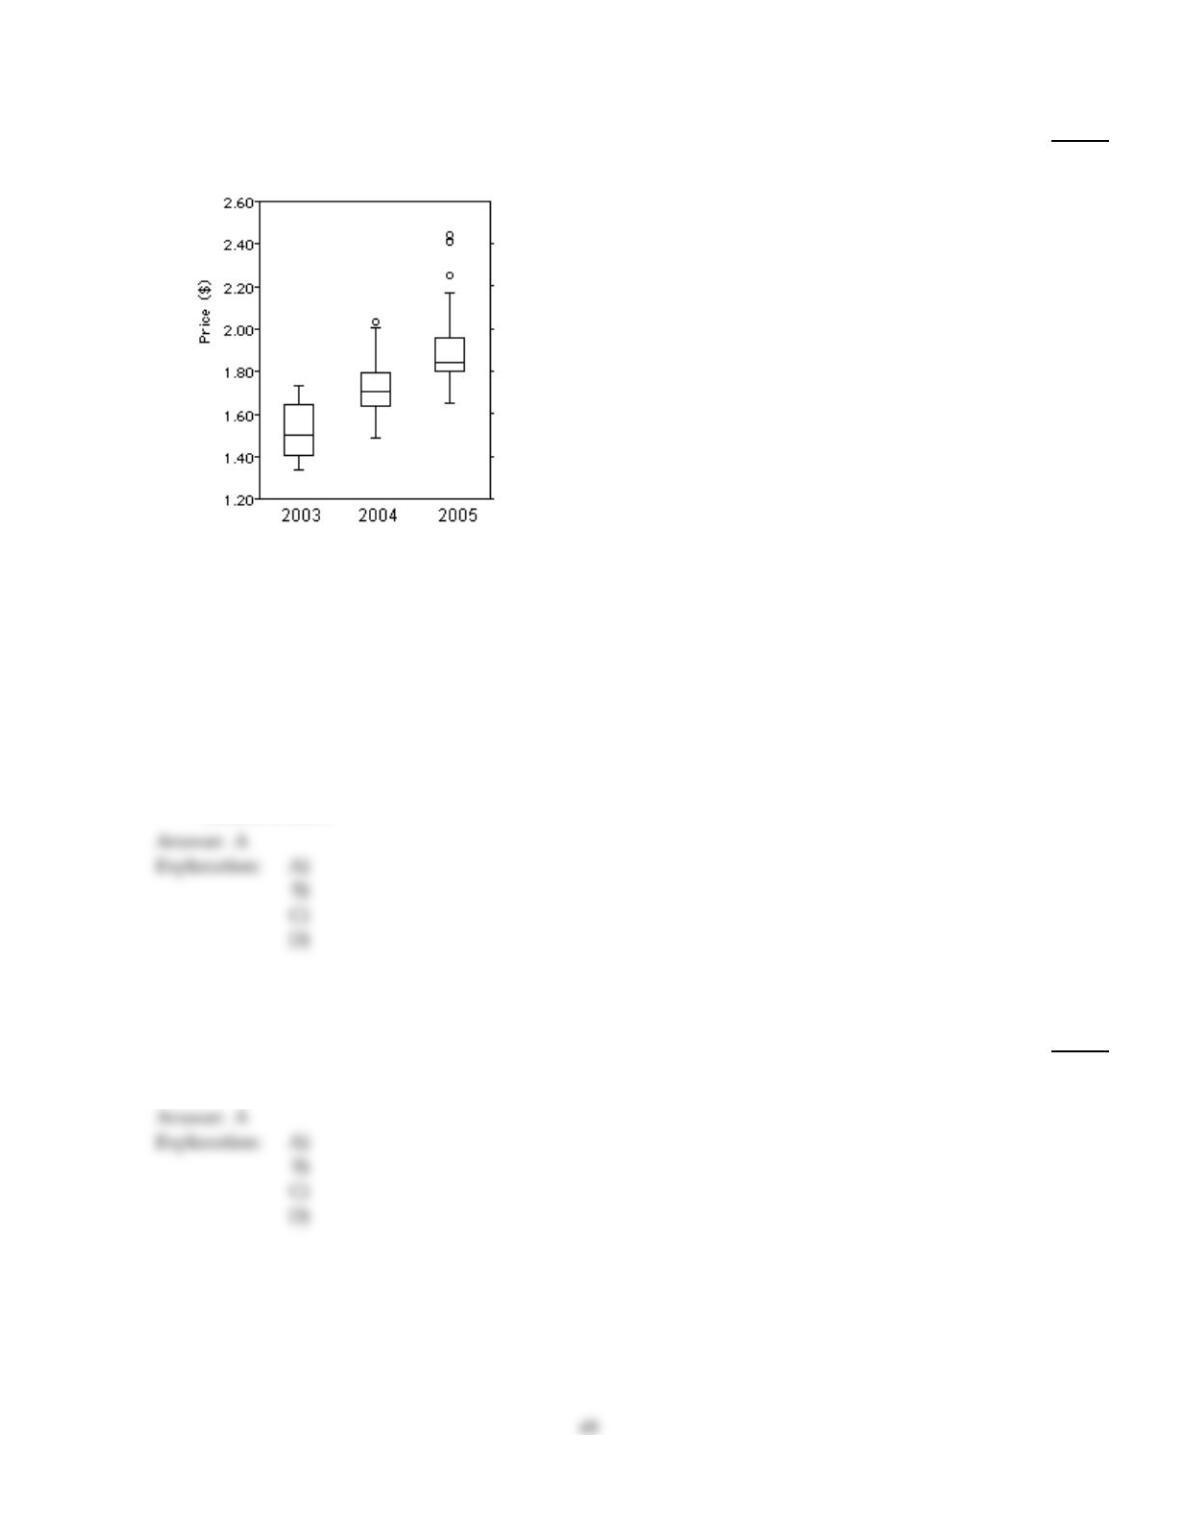
Solve the problem.
151)
Here are 3 boxplots of weekly gas prices at a service station in the United States (price in $ per
gallon). Compare the distribution of prices over the three years.
151)
A)
Gas prices have been increasing on average over the 3–year period, but the variation in the
middle 50% has decreased while variation for the entire distribution has increased. The
distribution has been left–skewed, and there were 3 potential outliers in 2005.
B)
Gas prices have been decreasing on average over the 3–year period, but the variation in the
middle 50% has been increasing while variation for the entire distribution has decreased. The
distribution has been right–skewed, and there were 3 potential outliers in 2005.
C)
Gas prices have been increasing on average over the 3–year period, and the variation overall
has been increasing as well. The distribution has been right–skewed, and there were 3
potential outliers in 2005.
D)
Gas prices have been decreasing on average over the 3–year period, and the variation has
been decreasing overall. The distribution has been left–skewed, and there were 3 potential
outliers in 2005.
Find the mean for the given sample data. Unless otherwise specified, round your answer to one more decimal place than
that used for the observations.
152)
Six college students spent $137.67, $169.56, $195.41, $186.40, $140.65, and $181.25 respectively for
books. Compute the mean amount spent. Round your answer to the nearest cent.
152)
A)
$168.49
B)
$252.74
C)
$190.19
D)
$202.19
Identify potential outliers, if any, for the given data.
153)
The normal annual precipitation (in inches) is given below for 21 different U.S. cities.
32.4 30.3 34.6 64.1 22.1 31.8 16.6
28.5 36.2 60.7 24.8 47.2 45.6 8.2
26.5 18.9 13.2 31.4 24.2 12.8 35.4
153)
A)
64.1
B)
60.7, 64.1
C)
8.2, 60.7, 64.1
D)
None
Find the range for the given data set.
154)
To get the best deal on a microwave oven, Jeremy called six appliance stores and asked the cost of a
specific model. The prices he was quoted are listed below.
$119 $454 $163 $622 $399 $311
154)
A)
$148
B)
$503
C)
$454
D)
$119
Provide an appropriate response.
155)
Which score has a higher relative position, a score of 34.8 on a test with a mean of 25 and a
standard deviation of 7, or a score of 257.4 on a test with a mean of 214 and a standard deviation of
31?(Assume that the distributions being compared have approximately the same shape.)
155)
A)
A score of 257.4
B)
A score of 34.8
C)
Both scores have the same relative position.
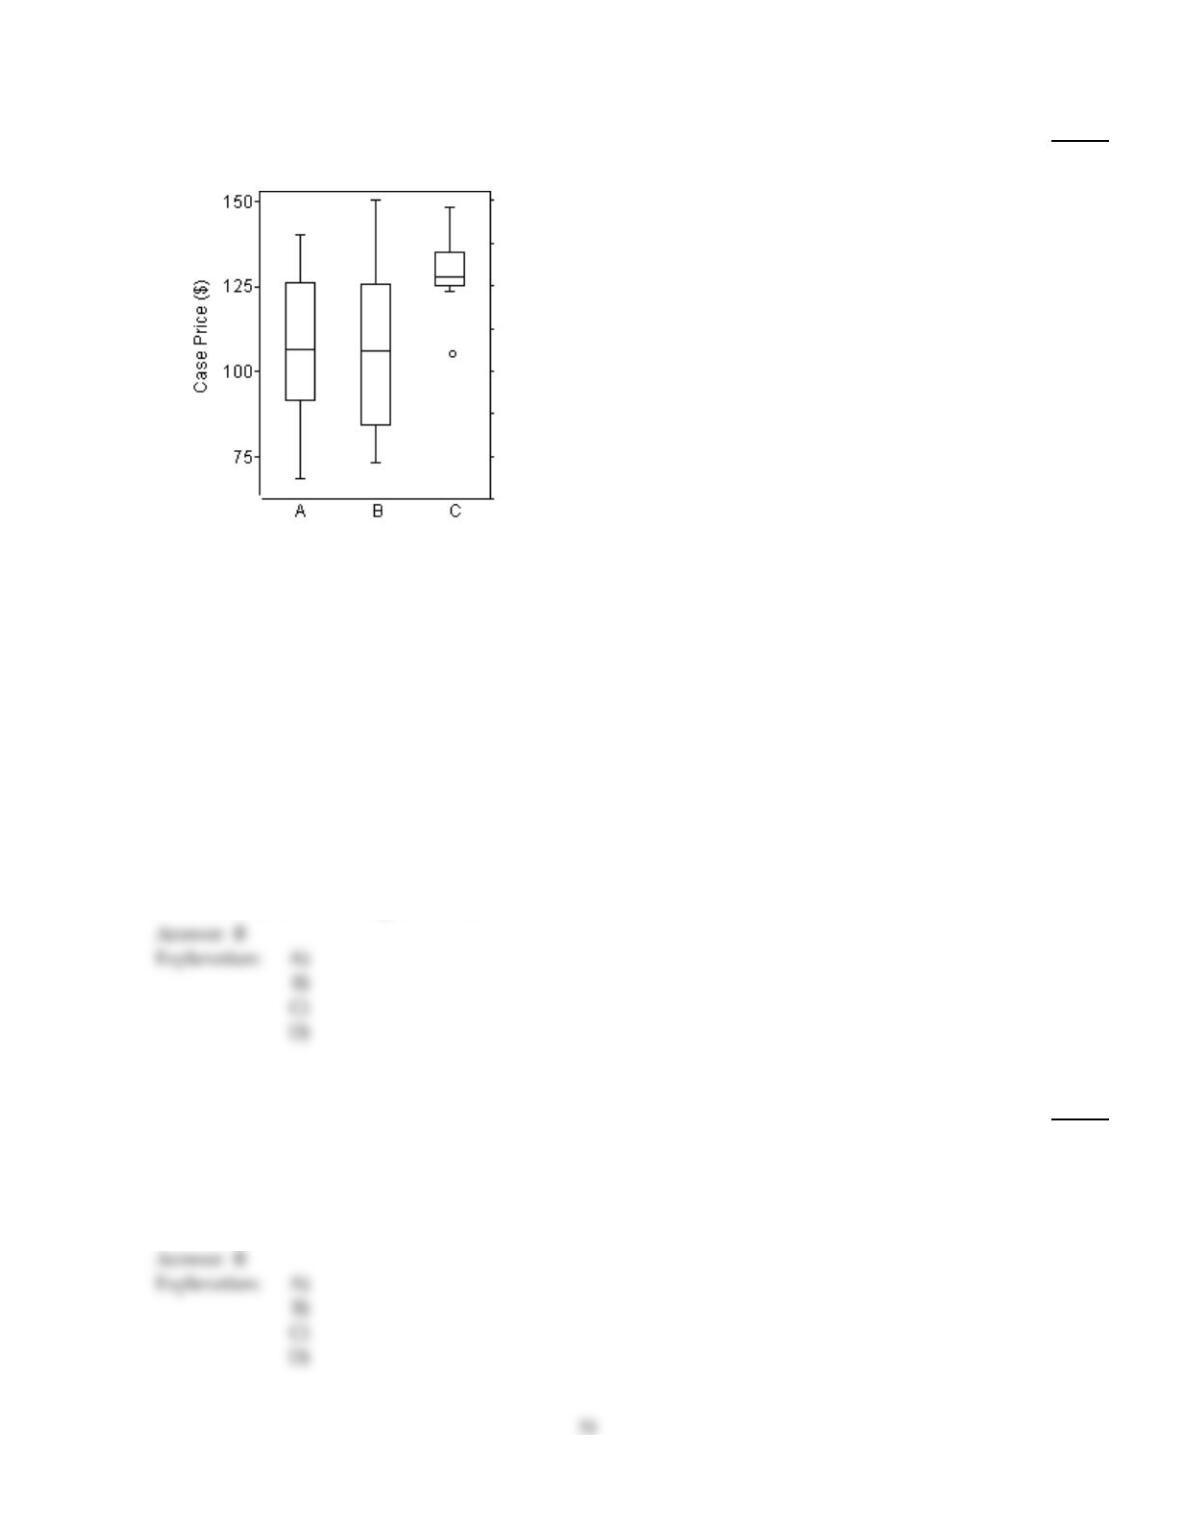
Solve the problem.
156)
The boxplots display case prices (in dollars) of white wines produced by three vineyards in the
western United States. Describe these wine prices.
156)
A)
Vineyards A and B have about the same average price; the boxplots show similar medians
and similar IQRs. Vineyard C has consistently higher prices except for one potential outlier,
but more variation in pricing as shown by the larger IQR. The distributions for A and B are
approximately symmetric, while the distribution for C is right–skewed.
B)
Vineyards A and B have about the same average price; the boxplots show similar medians
and similar IQRs. Vineyard C has higher prices except for one potential outlier, and a less
variation in pricing as shown by the smaller IQR and overall range. Distributions A and B are
approximately symmetric, while distribution C is right–skewed.
C)
Vineyards A and B have about the same average price; the boxplots show similar medians
and similar IQRs. Vineyard C has higher prices except for one potential outlier, and less
variation in pricing as shown by the smaller IQR and overall range. All three distributions
are roughly symmetric.
D)
Vineyards A and B have different average prices, but a similar variation. Vineyard C has
lower prices except for one potential outlier, and less variation in pricing as shown by the
smaller IQR. The distributions for A and B are approximately symmetric, while the
distribution for C is right–skewed.
Find the median for the given sample data.
157)
The salaries of ten randomly selected doctors are shown below.
$148,000 $149,000 $187,000 $212,000 $228,000
$106,000 $124,000 $875,000 $226,000 $155,000
157)
A)
$241,000
B)
$171,000
C)
$187,000
D)
$268,000
Solve the problem. If necessary, round your answer to one more decimal place than that used for the observations.
158)
Let x1=14, x2=10, x3=7, x4=9, and x5=17. Determine x.
158)
A)
14.3
B)
11.4
C)
5
D)
57
Solve the problem.
159)
A meteorological office keeps records of the annual precipitation in different cities. For one city, the
mean annual precipitation is 26.7 and the standard deviation of the annual precipitation amounts is
4.3. Let x represent the annual precipitation in that city. Determine the z–score for an annual
precipitation in that city of 28.4 inches. Round your final answer to two decimal places.
159)
A)
12.81
B)
0.90
C)
0.40
D)
–0.40
Determine the quartile or interquartile range as specified.
160)
The normal annual precipitation (in inches) is given below for 21 different U.S. cities. Find the
third quartile, Q3.
19.1 34.7 10.2 38.4 22.4 9.1 12.6
33.4 20.6 36.0 29.7 39.9 17.3 24.2
30.9 13.6 28.9 15.0 22.3 27.0 11.7
160)
A)
30.600 in.
B)
30.9 in.
C)
24.2 in.
D)
32.15 in.
Solve the problem.
161)
Consider the following sample of exam scores, arranged in increasing order:
22 35 44 55 67 70
78 81 81 82 84 88
88 89 90 90 91 92
92 93 93 94 94 95
95 96 96 97 99 100
Note: x= 82.4 and s = 19.5
(i) Use Chebychev’s rule to obtain a lower bound on the percentage of observations that lie within 2
standard deviations to either side of the mean.
(ii) Use the data to obtain the exact percentage of observations that lie within <b> standard
deviations to either side of the mean. Compare this answer with part (i).
161)
A)
(i) Chebychev’s rules says that 75% of the data values will lie between 82.4 –2(19.5) and
82.4 +2(19.5), or between 40.4 and 123.4;
(ii) 27 of the thirty observations (90%) lie within the interval 40.4 to 123.4. “At least 75%”
means 75% or more, and 90% is more than 75%, so Chebychev’s rule does apply to these data.
B)
(i) Chebychev’s rules says that 75% of the data values will lie between 82.4 –2(19.5) and
82.4 +2(19.5), or between 53.4 and 116.4;
(ii) 28 of the thirty observations (93%) lie within the interval 53.4 to 116.4. “At least 75%”
means 75% or more, and 93% is more than 75%, so Chebychev’s rule does apply to these data.
C)
(i) Chebychev’s rules says that 75% of the data values will lie between 82.4 –2(19.5) and
82.4 +2(19.5), or between 43.4 and 121.4;
(ii) 28 of the thirty observations (93%) lie within the interval 43.4 to 121.4. “At least 75%”
means 75% or more, and 93% is more than 75%, so Chebychev’s rule does apply to these data.
D)
(i) Chebychev’s rules says that 75% of the data values will lie between 82.4 –2(19.5) and
82.4 +2(19.5), or between 43.4 and 121.4;
(ii) 26 of the thirty observations (87%) lie within the interval 43.4 to 121.4. “At least 75%”
means 75% or more, and 87% is more than 75%, so Chebychev’s rule does apply to these data.
Determine the quartile or interquartile range as specified.
162)
The weights (in pounds) of 18 randomly selected adults are given below. Find the third quartile,
Q3.
120 165 187 143 119 132
127 156 179 159 180 202
114 146 151 168 173 144
162)
A)
173 lb
B)
174.5 lb
C)
170.5 lb
D)
176 lb
Solve the problem.
163)
A variable x has a mean, µ, of 27 and a standard deviation, , of 2. Determine the standardized
version of x.
163)
A)
x =z –27
2
B)
z =x –27
2
C)
z =x –2
27
D)
z = – 27
2
Obtain the five–number summary for the given data.
164)
The weights (in pounds) of 18 randomly selected adults are given below.
120 145 187 153 119 137
127 143 179 162 182 202
114 172 131 148 168 172
164)
A)
114, 129.00, 227.5, 170.0, 202 pounds
B)
114, 131, 150.5, 172, 202 pounds
C)
114, 129.00, 148, 170.0, 202 pounds
D)
114, 130.00, 148, 173.75, 202 pounds
Find the range for the given data set.
165)
7, 16, 4, 15, 9
165)
A)
2
B)
12
C)
16
D)
4
Find the sample standard deviation for the given data. Round your final answer to one more decimal place than that used
for the observations.
166)
Christine is currently taking college astronomy. The instructor often gives quizzes. On the past
seven quizzes, Christine got the following scores.
46 12 50 23 20 47 77
166)
A)
10,803.6
B)
50
C)
13,827
D)
22.4
Find the mode(s) for the given sample data.
167)
Last year, nine employees of an electronics company retired. Their ages at retirement are listed
below. Find the mode(s).
50 59 67
54 53 63
60 58 57
167)
A)
57.9
B)
58
C)
No mode
D)
50, 59, 67, 54, 53, 63, 60, 58, 57
Identify potential outliers, if any, for the given data.
168)
The ages of the 21 members of a track and field team are listed below.
15 18 18 19 22 23 24
24 24 24 25 26 26 27
28 28 30 32 33 40 42
168)
A)
42
B)
40, 42
C)
15, 42
D)
None
169)
The weekly salaries (in dollars) of 24 randomly selected employees of a company are shown below.
310 320 450 460 470 500 520 540
580 600 650 700 710 840 870 900
1000 1200 1250 1300 1400 1720 2500 3700
169)
A)
3700
B)
310, 2500, 3700
C)
2500
D)
2500, 3700
Provide an appropriate response.
170)
Jason and Alex were the top two players in a tennis tournament. They dominated the competition
with a record number of aces (an ace is valid serve that could not be returned by an opponent). The
following table provides the number of aces served by each of the two players during the five sets:
Jason 3 4 3 3 4
Alex 6 5 2 3 1
(i) Without doing any calculations, decide for which player the standard deviation of the number
of aces is larger. Explain.
(ii) Find the individual population standard deviations of the number of aces. Round your final
answer to two decimal places. Compare these answers with part (i).
170)
A)
(i) The spread of the values appears to be larger for Jason, so he is likely to have the larger
standard deviation.
(ii) Jason’s population standard deviation is 0.94; Alex’s population standard deviation is
0.12, so Jason did have the larger standard deviation.
B)
(i) The spread of the values appears to be larger for Alex, so he is likely to have the larger
standard deviation.
(ii) Jason’s population standard deviation is 0.49; Alex’s population standard deviation is
1.85, so Alex did have the larger standard deviation.
C)
(i) The spread of the values appears to be larger for Jason, so he is likely to have the larger
standard deviation.
(ii) Jason’s population standard deviation is 1.32; Alex’s population standard deviation is
1.01, so Jason did have the larger standard deviation.
D)
(i) The spread of the values appears to be larger for Alex, so he is likely to have the larger
standard deviation.
(ii) Jason’s population standard deviation is 0.77; Alex’s population standard deviation is
1.93, so Alex did have the larger standard deviation.
171)
Which is better, a score of 92 on a test with a mean of 71 and a standard deviation of 15, or a score
of 688 on a test with a mean of 493 and a standard deviation of 150? (Assume that the distributions
being compared have approximately the same shape.)
171)
A)
A score of 92
B)
A score of 688
C)
Both scores have the same relative position.