47
48
49
50
51
51.5
Power Curve
Answer:
41
Provide an appropriate response.
85)
List the advantages and disadvantages of nonparametric tests.
85)
Perform a hypothesis test for the population mean. Assume that preliminary data analyses indicate that it is reasonable to
apply the z–test. Use the critical–value approach.
86)
The maximum acceptable level of a certain toxic chemical in vegetables has been set at 0.4
parts per million (ppm). A consumer health group measured the level of the chemical in a
random sample of tomatoes obtained from one producer. The levels, in ppm, are shown
below.
0.31 0.47 0.19 0.72 0.56
0.91 0.29 0.83 0.49 0.28
0.31 0.46 0.25 0.34 0.17
0.58 0.19 0.26 0.47 0.81
At the 5% significance level, do the data provide sufficient evidence to conclude that the
mean level of the chemical in tomatoes from this producer is greater than the
recommended level of 0.4 ppm? Assume that the population standard deviation of levels
of the chemical in these tomatoes is 0.21 ppm.
86)
Construct a graph portraying the decision criterion for the specified hypothesis test.
87)
A hypothesis test for a population mean is conducted. The hypotheses are:
H0: µ=µ0
Ha: µµ0
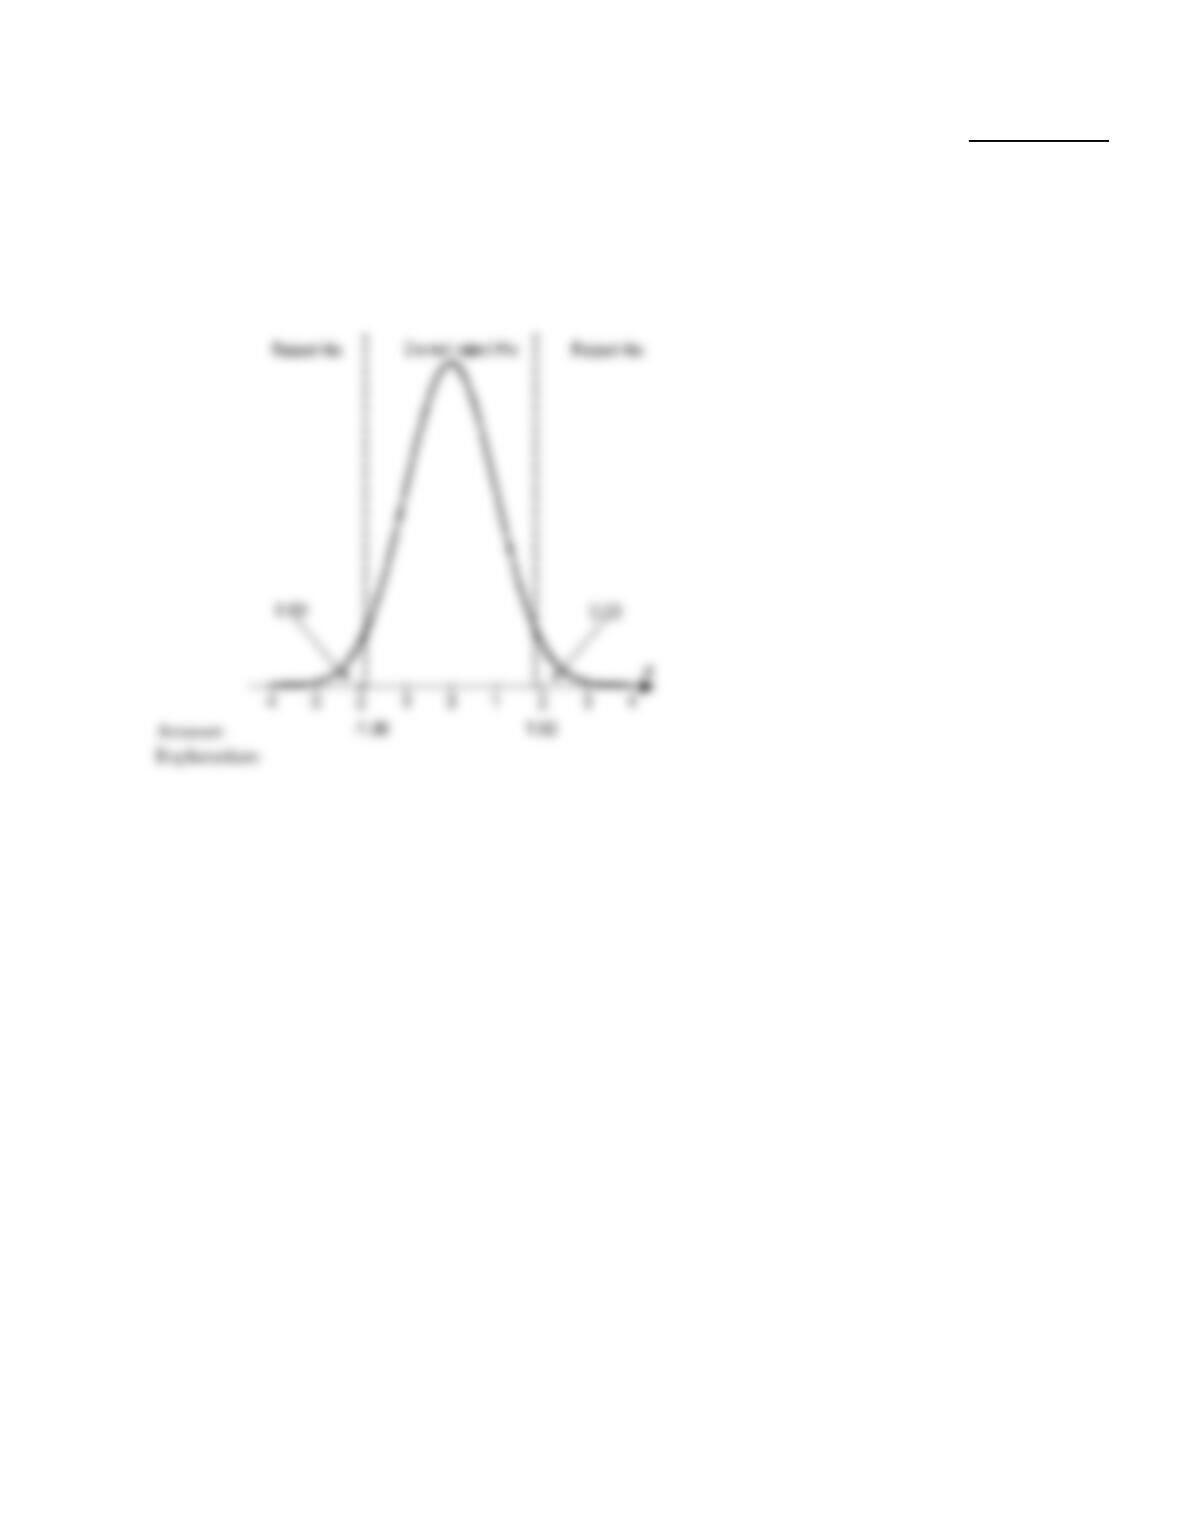
The significance level is 0.06 and the critical values are –1.88 and 1.88. Sketch a normal
curve displaying the decision criterion. This curve will represent the normal curve for the
test statistic under the assumption that the null hypothesis is true. On your graph indicate
the area in each tail, the critical values, the rejection region, and the nonrejection region.
87)
43
Decide whether it appears reasonable to use a t–test to perform a hypothesis test for the mean in question. Explain your
answer and include any relevant graphs, such as a normal probability plot, histogram, or stem–and–leaf diagram. If there
are outliers, explain how to proceed.
88)
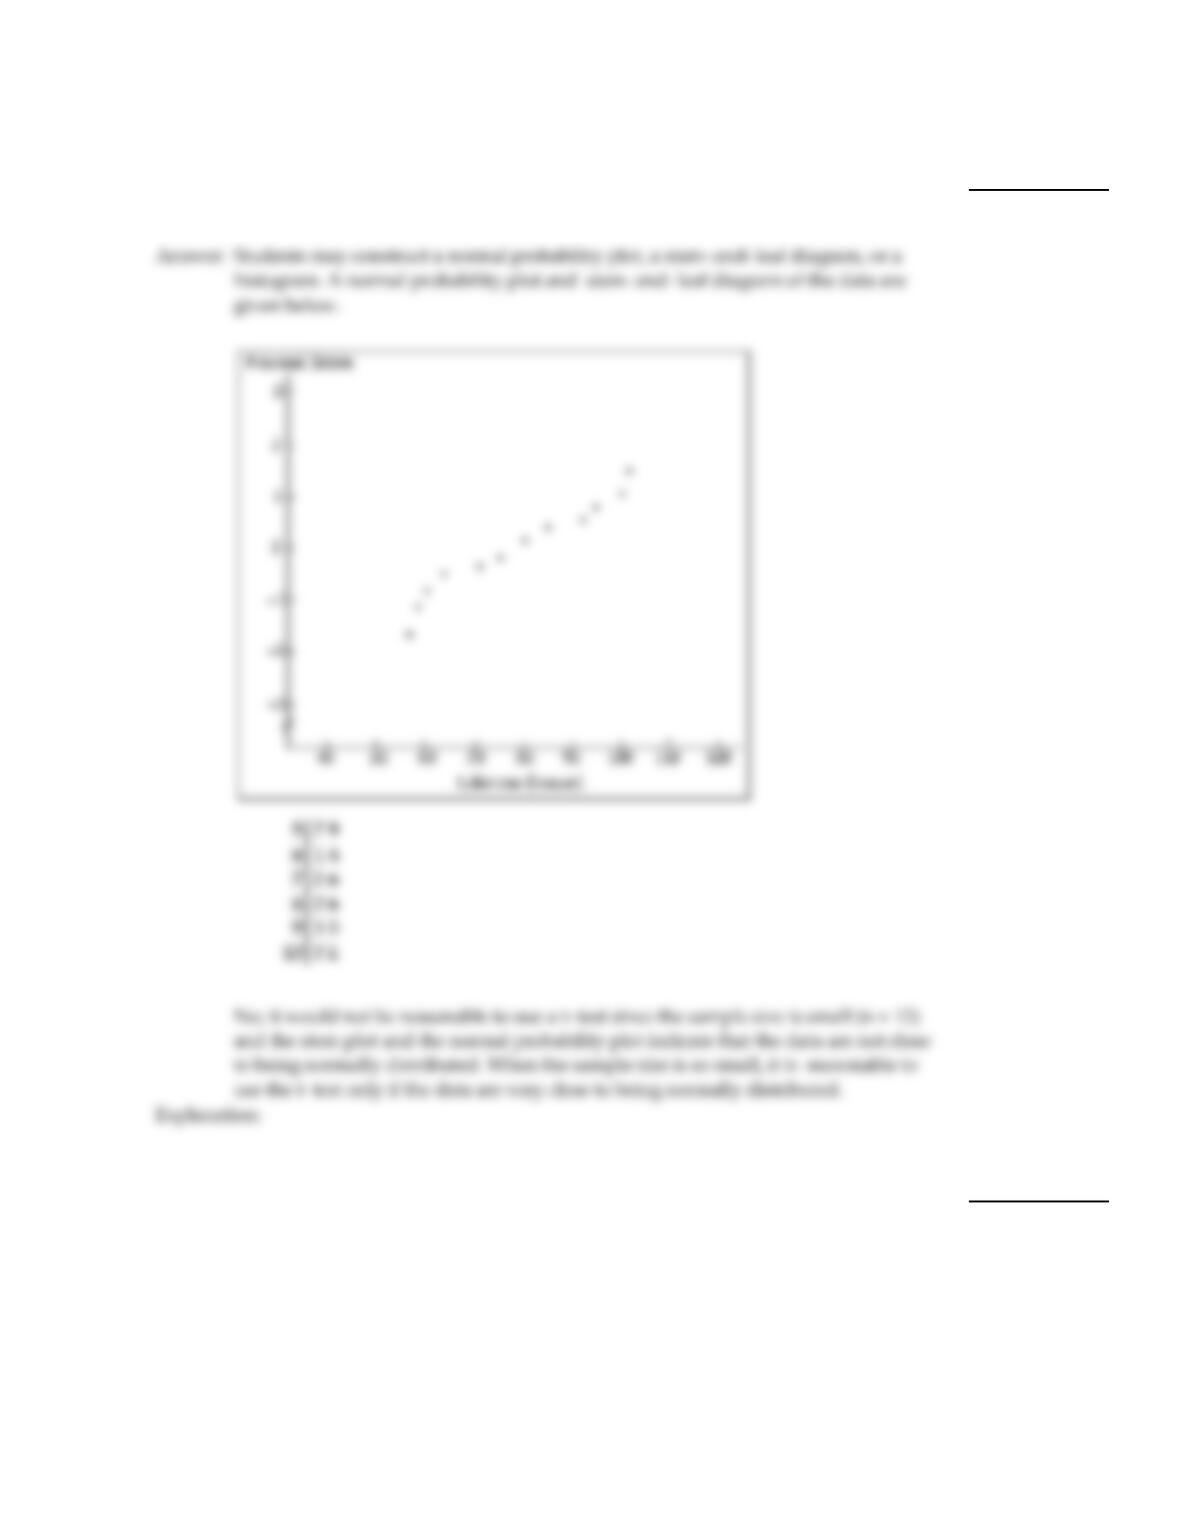
Lifetimes (in hours) for a random sample of 12 batteries are as follows:
57 59 61 64 72 76
80 86 93 95 100 102
88)
Provide an appropriate response.
89)
Suppose that you want to perform a hypothesis test for a population mean. Assume the
variable under consideration has a highly skewed distribution, the population standard
deviation is known, and the sample size is small. Is it permissible to use either a t–test, a
z–test, or a Wilcoxon signed–rank test to perform the hypothesis test? If so, which
procedure is preferable?
89)
Answer:
None of the procedures may be used.
Explanation:
44
Answer:
Perform a hypothesis test for the population mean. Assume that preliminary data analyses indicate that it is reasonable to
apply the z–test. Use the critical–value approach.
90)
A brochure claims that the average maximum height a certain type of plant is 0.7 m. A
gardener suspects that this estimate is not accurate locally due to soil conditions. A random
sample of 38 mature plants is taken. The mean height of the plants in the sample is 0.65 m.
Using a 1% level of significance, perform a hypothesis test to determine whether the
population mean is different from 0.7 m. Assume that the population standard deviation is
0.2 m.
90)
Provide an appropriate response.
91)
Suppose that you want to perform a hypothesis test for a population mean. Give an
example of a situation in which both the t–test and the Wilcoxon signed–rank test are
permissible but the t–test is preferable. Specify the distribution of the variable under
consideration, the sample size, and whether or not the population standard deviation is
known.
91)
92)
A hypothesis test for a population mean is to be performed. The population standard
deviation is known. The hypotheses are
H0: µ= 80
Ha: µ 80.
A 99% confidence interval will also be constructed for µ. Complete the following statement
concerning the relationship between the hypothesis test and the confidence interval. If 80
lies ___ (within/outside) the 99% confidence interval for µ, then the null hypothesis will be
rejected at the ____ level of significance.
92)
Decide whether it appears reasonable to use a t–test to perform a hypothesis test for the mean in question. Explain your
answer and include any relevant graphs, such as a normal probability plot, histogram, or stem–and–leaf diagram. If there
are outliers, explain how to proceed.
45
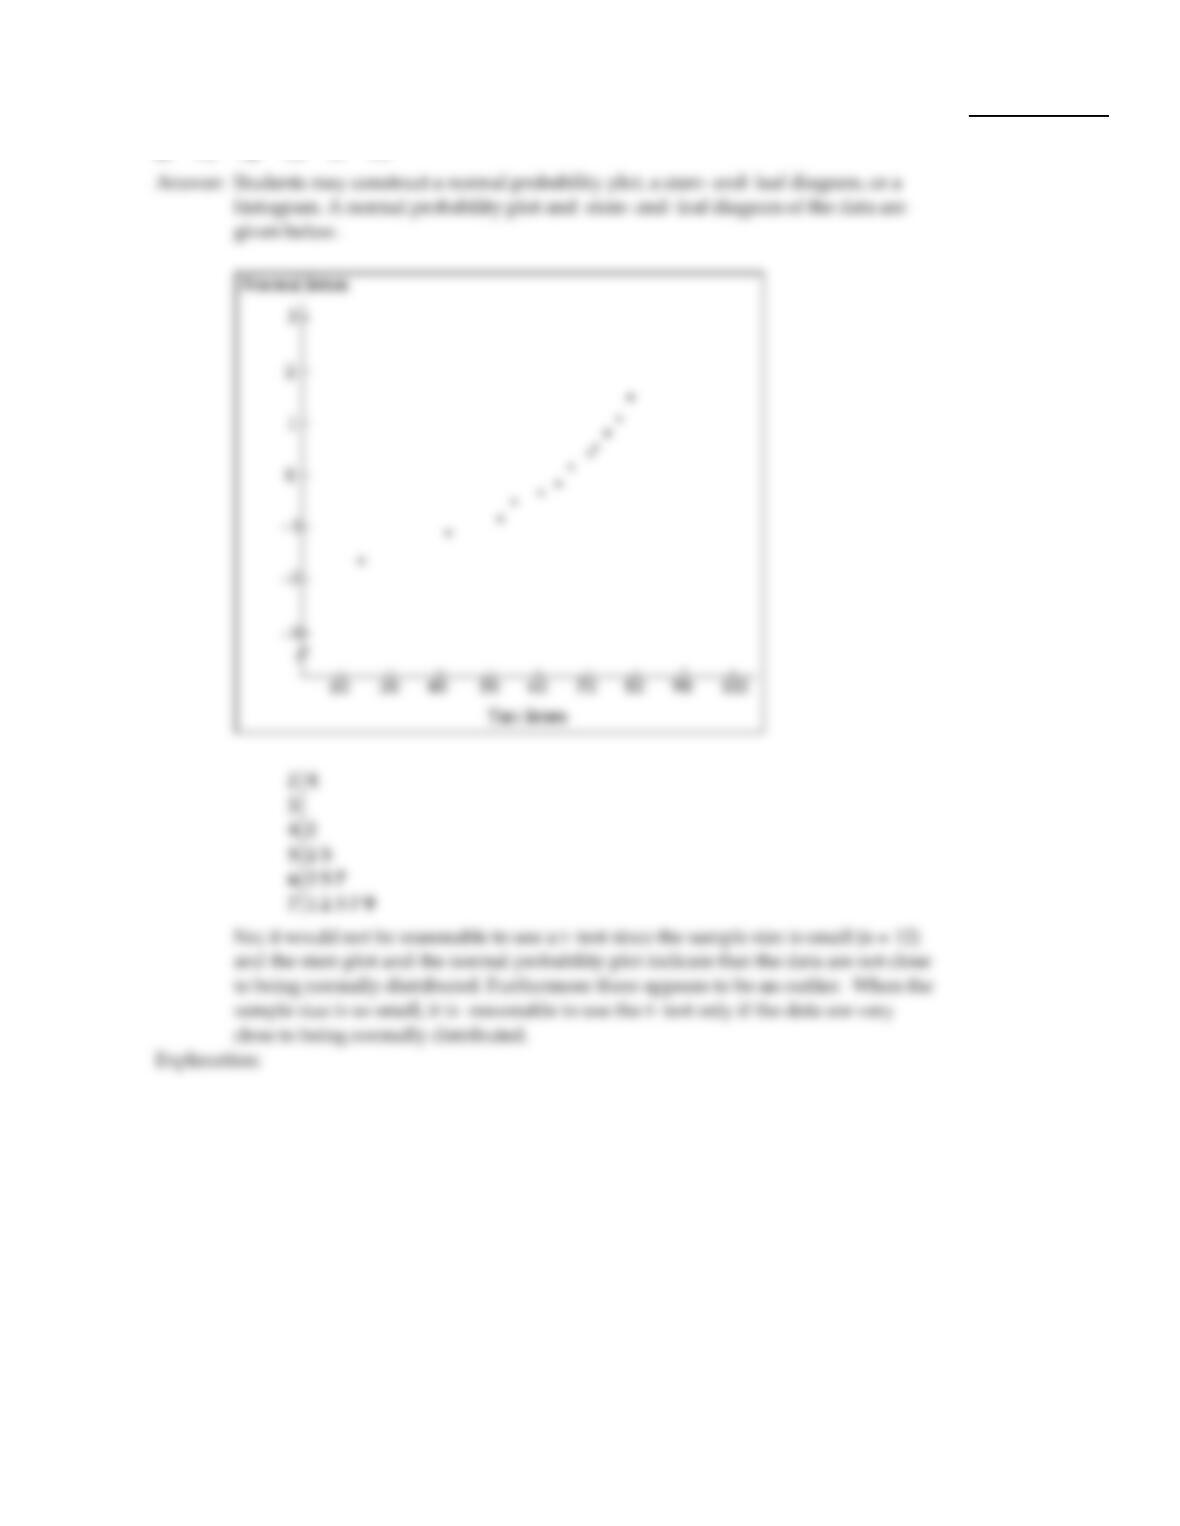
93)
Test scores for a random sample of 12 students were as follows:
24 42 52 55 60 65
67 71 72 75 77 79
93)
46
Provide an appropriate response.
94)
Suppose that you wish to conduct a hypothesis test concerning a population mean. How
would you decide whether to conduct a right–tailed, a left–tailed, or a two–tailed test? Is it
acceptable to decide what type of test to conduct by examining the sample data?
94)
Perform a one–sample z–test for a population mean using the P–value approach. Be sure to state the hypotheses and the
significance level, to compute the value of the test statistic, to obtain the P–value, and to state your conclusion. Also,
assess the strength of the evidence against the null hypothesis.
95)
The maximum acceptable level of a certain toxic chemical in vegetables has been set at 0.4
parts per million (ppm). A consumer health group measured the level of the chemical in a
random sample of tomatoes obtained from one producer. The levels, in ppm, are shown
below.
0.31 0.47 0.19 0.72 0.56
0.91 0.29 0.83 0.49 0.28
0.31 0.46 0.25 0.34 0.17
0.58 0.19 0.26 0.47 0.81
At the 5% significance level, do the data provide sufficient evidence to conclude that the
mean level of the chemical in tomatoes from this producer is greater than the
recommended level of 0.4 ppm? Assume that the population standard deviation of levels
of the chemical in these tomatoes is 0.21 ppm.
95)
Use the Wilcoxon signed–rank test to perform the required hypothesis test. Be sure to state the hypotheses and the
significance level, to obtain the critical value(s), to compute the value of the test statistic, and to state your conclusion.
96)
The mean weekly income for residents of one state is $570. A random sample of 12
residents of one small town in the state yielded the following weekly incomes, in dollars.
480 780 392 431 515 900
717 1120 495 560 520 503
At the 5% significance level, do the data provide sufficient evidence to conclude that the
mean weekly income for residents of this town is lower than the state mean income of
$570?
96)
Provide an appropriate response.
97)
Suppose that you want to perform a hypothesis test for a population mean. Give an
example of a situation in which neither the t–test, the z–test, or the Wilcoxon signed–rank
test is permissible. Specify the distribution of the variable under consideration, the sample
size, and whether or not the population standard deviation is known.
97)
48
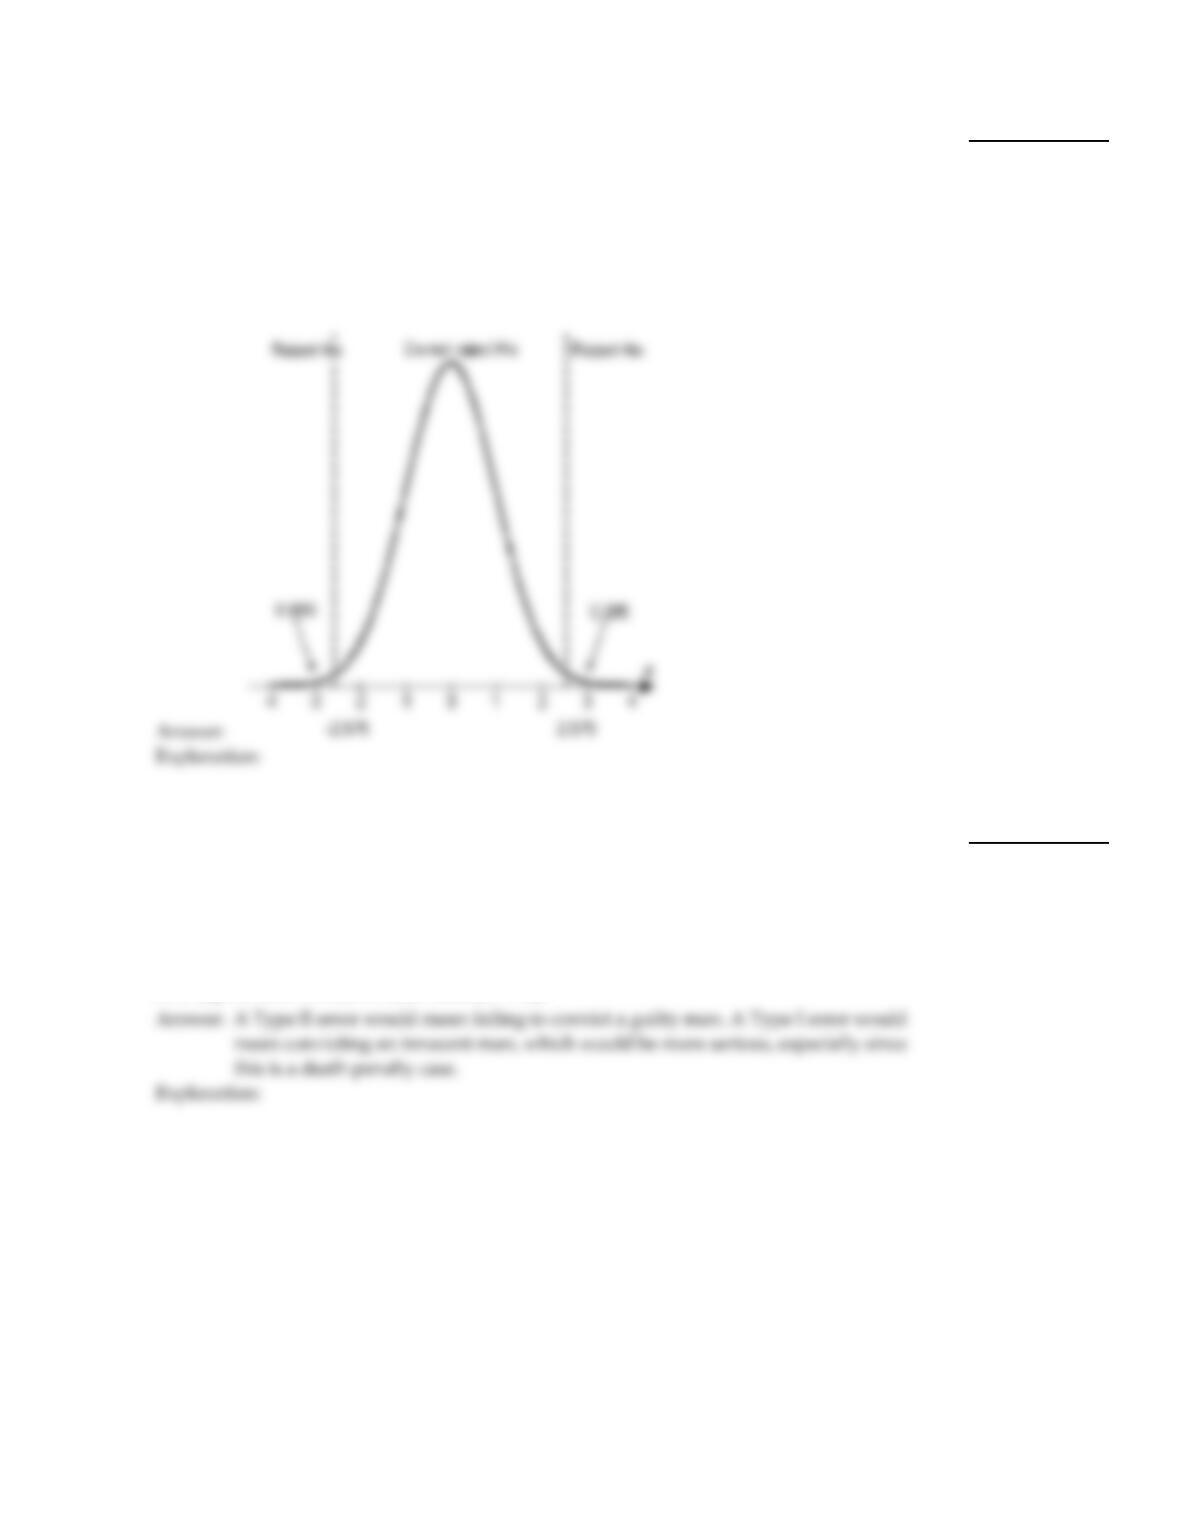
Construct a graph portraying the decision criterion for the specified hypothesis test.
98)
A hypothesis test for a population mean is conducted. The hypotheses are:
H0: µ=µ0
Ha: µµ0
The significance level is 0.01 and the critical values are –2.575 and 2.575. Sketch a normal
curve displaying the decision criterion. This curve will represent the normal curve for the
test statistic under the assumption that the null hypothesis is true. On your graph indicate
the area in each tail, the critical values, the rejection region, and the nonrejection region.
98)
Provide an appropriate response.
99)
A man is on trial accused of murder in the first degree. The prosecutor presents evidence
that he hopes will convince the jury to reject the hypothesis that the man is innocent. This
situation can be modeled as a hypothesis test with the following hypotheses:
H0: The defendant is innocent.
Ha: The defendant is guilty.
If convicted, the defendant will receive the death penalty. Do you think that a Type I error
or a Type II error would be more serious? Why?
99)
49

100)
A manufacturer claims that the mean weight of flour in its 32–ounce bags is 32.1 ounces. A
z–test is performed to determine whether the mean weight is actually less than this. The
hypotheses are
H0: µ= 32.1 ounces
Ha: µ< 32.1 ounces.
The mean weight for a sample of 45 bags of flour was 30.7 ounces. Suppose that the
P–value corresponding to this sample data is 0.001. Give an interpretation of the P–value.
Would you feel confident in concluding that the mean weight is less than 32.1 ounces?
100)
A hypothesis testing situation is given. The population standard deviation, sample size, and significance level are given.
Complete the table to give the probability of a Type II error and the power for each of the given values of µ. Use the table
to draw the power curve.
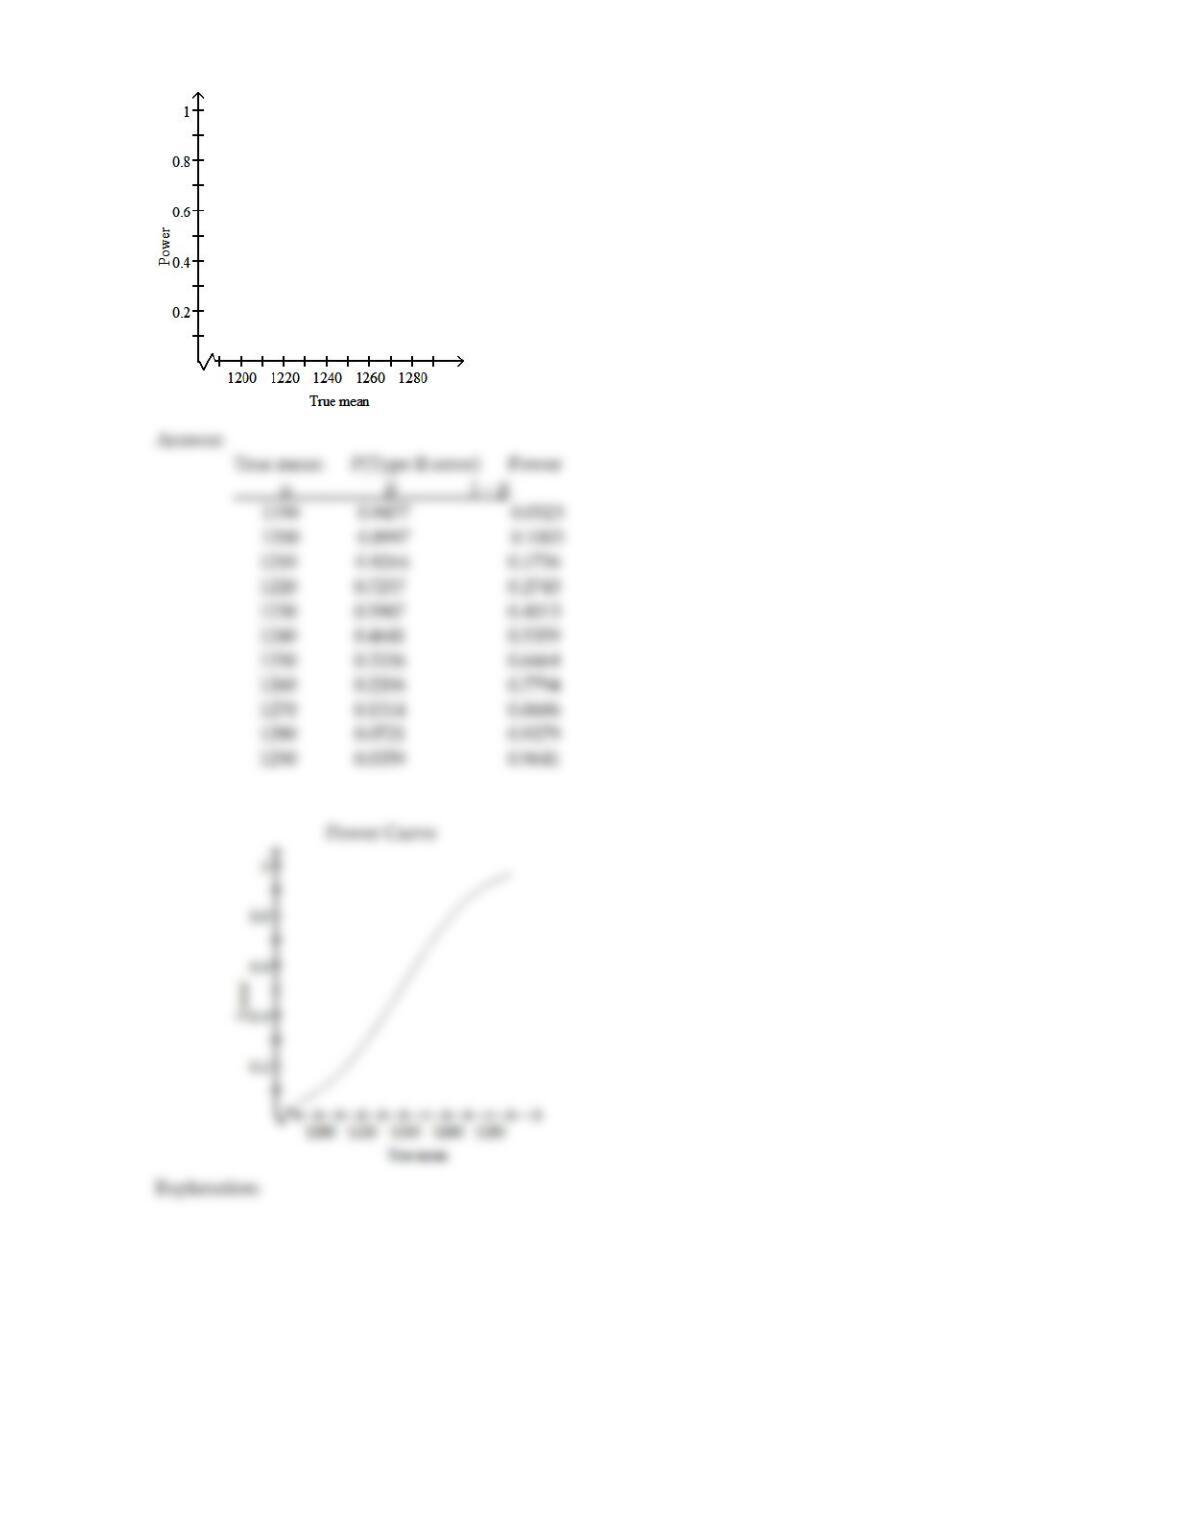
101)
A health insurer has determined that the “reasonable and customary” fee for a certain
medical procedure is $1200. They suspect that the average fee charged by one particular
clinic for this procedure is higher than $1200. The insurer wants to perform a hypothesis
test to determine whether their suspicion is correct. Preliminary data analyses indicate that
it is reasonable to apply a z–test. The hypotheses are
H0: µ= $1200
Ha: µ> $1200.
Assume that = $180, n = 38, and the significance level is 0.10. Find the probability of a
Type II error and the power for µ = 1190, 1200, 1210, 1220, 1230, 1240, 1250, 1260, 1270,
1280, 1290.
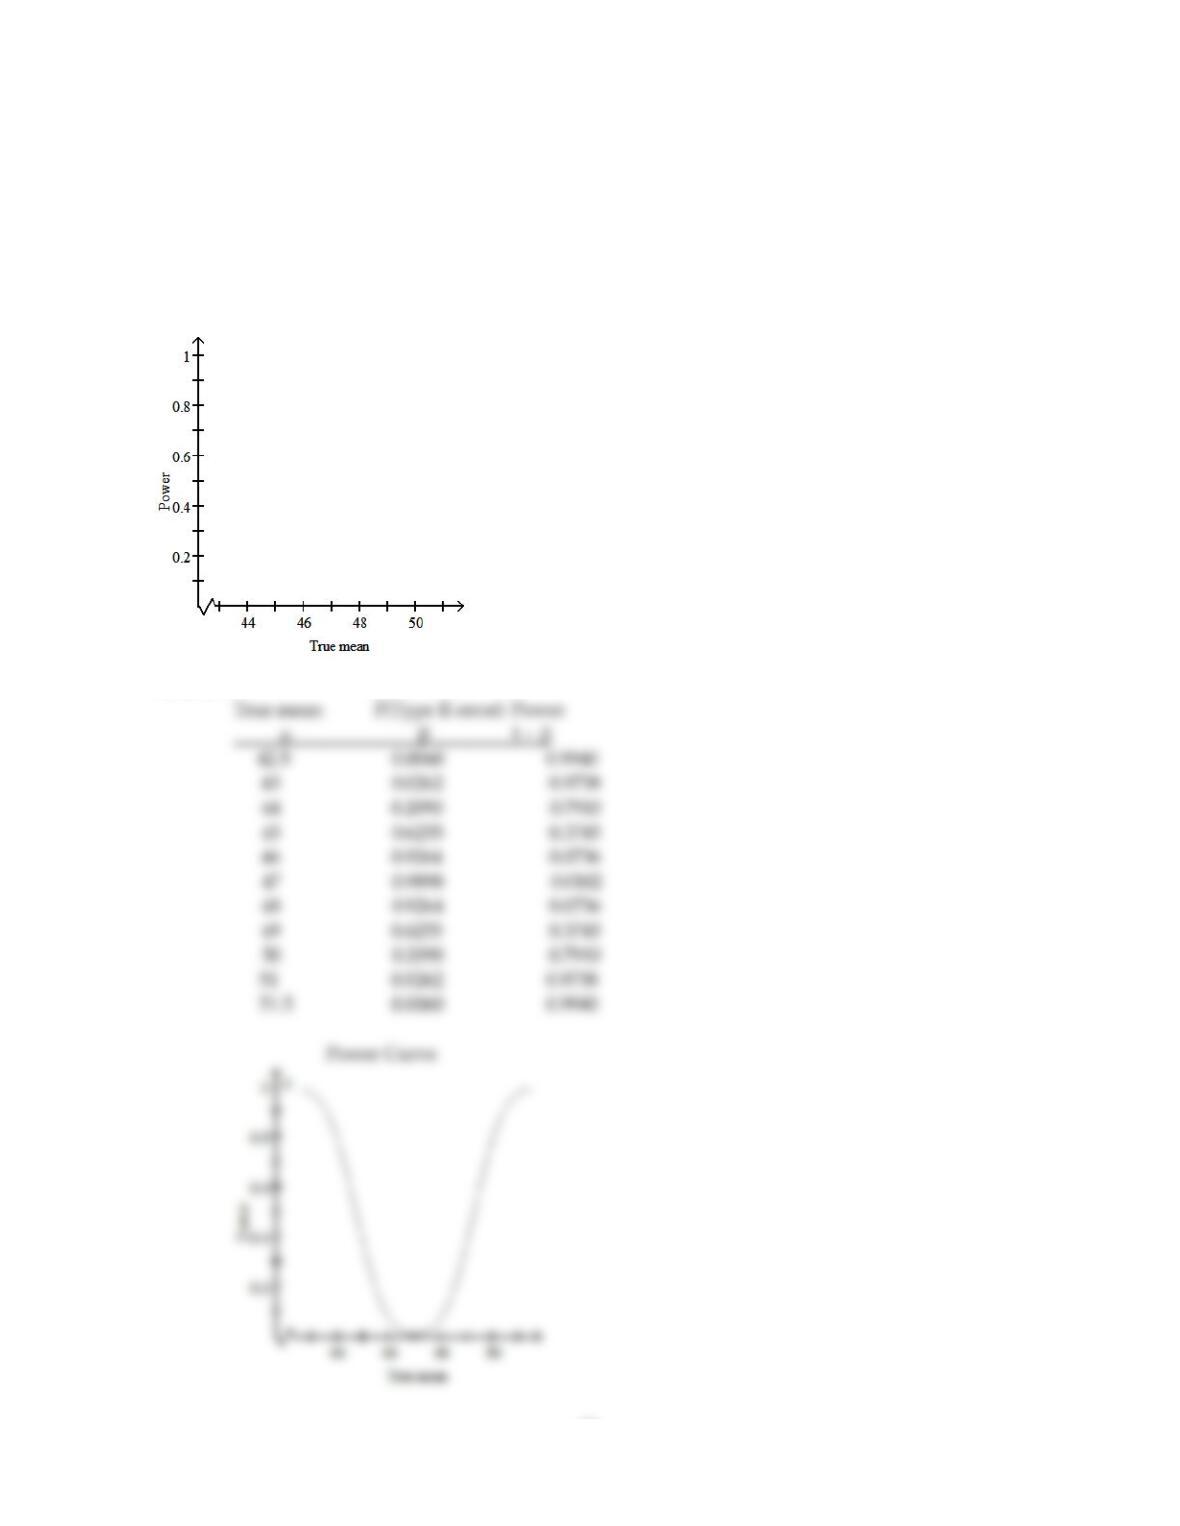
True mean P(Type II error) Power
µ 1 –
1190
1200
1210
1220
1230
1240
1250
1260
1270
1280
1290
Power Curve
101)
50
51
Preliminary data analyses indicate that it is reasonable to use a t–test to carry out the specified hypothesis test. Perform
the t–test using the critical–value approach.
102)
In tests of a computer component, it is found that the mean time between failures is
520 hours. A modification is made which is supposed to increase the time between failures.
Tests on a random sample of 10 modified components resulted in the following times (in
hours) between failures.
518 548 561 523 536
499 538 557 528 563
At the 5% significance level, test the claim that for the modified components, the mean
time between failures is greater than 520 hours.
102)
Provide an appropriate response.
103)
A one–sample z–test for a population mean is to be performed. Compare the steps
involved in using the critical–value approach and the steps involved in using the P–value
approach. Which steps do the two methods have in common? How do the two methods
differ?
103)
52
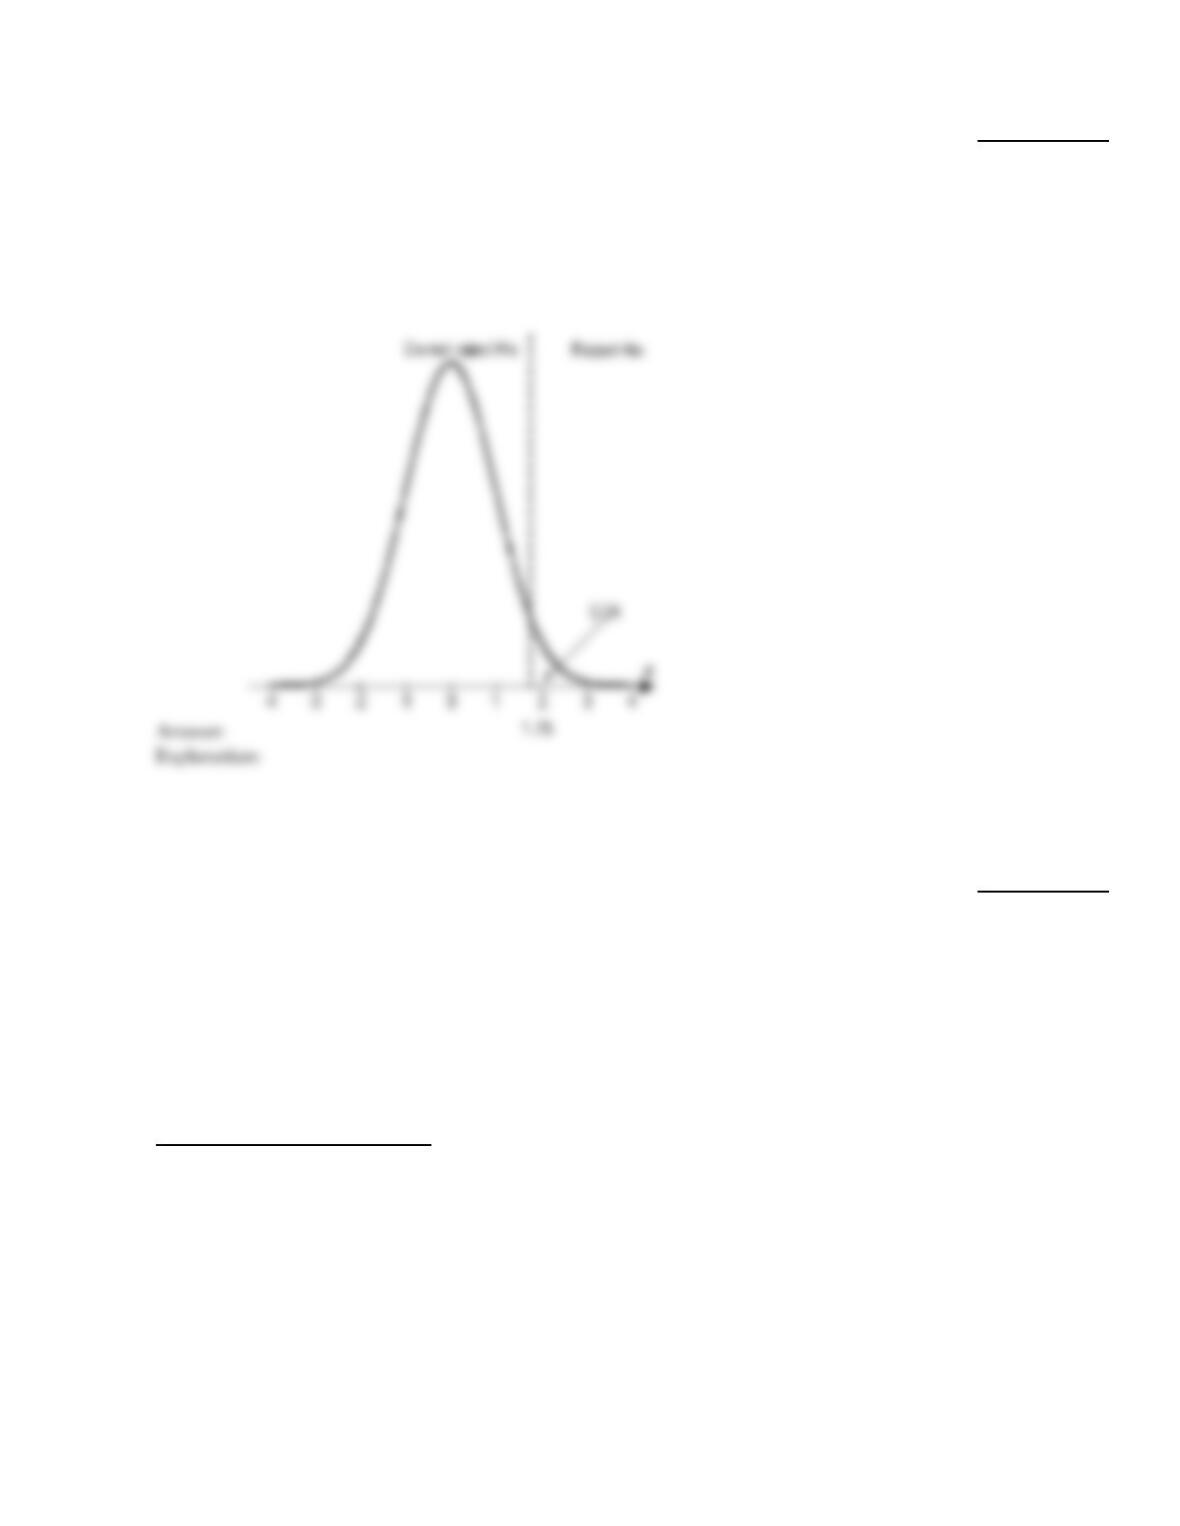
Construct a graph portraying the decision criterion for the specified hypothesis test.
104)
A hypothesis test for a population mean is conducted. The hypotheses are:
H0: µ=µ0
Ha: µ>µ0
The significance level is 0.04 and the critical value is 1.75. Sketch a normal curve
displaying the decision criterion. This curve will represent the normal curve for the test
statistic under the assumption that the null hypothesis is true. On your graph indicate the
area in the tail, the critical value, the rejection region, and the nonrejection region.
104)
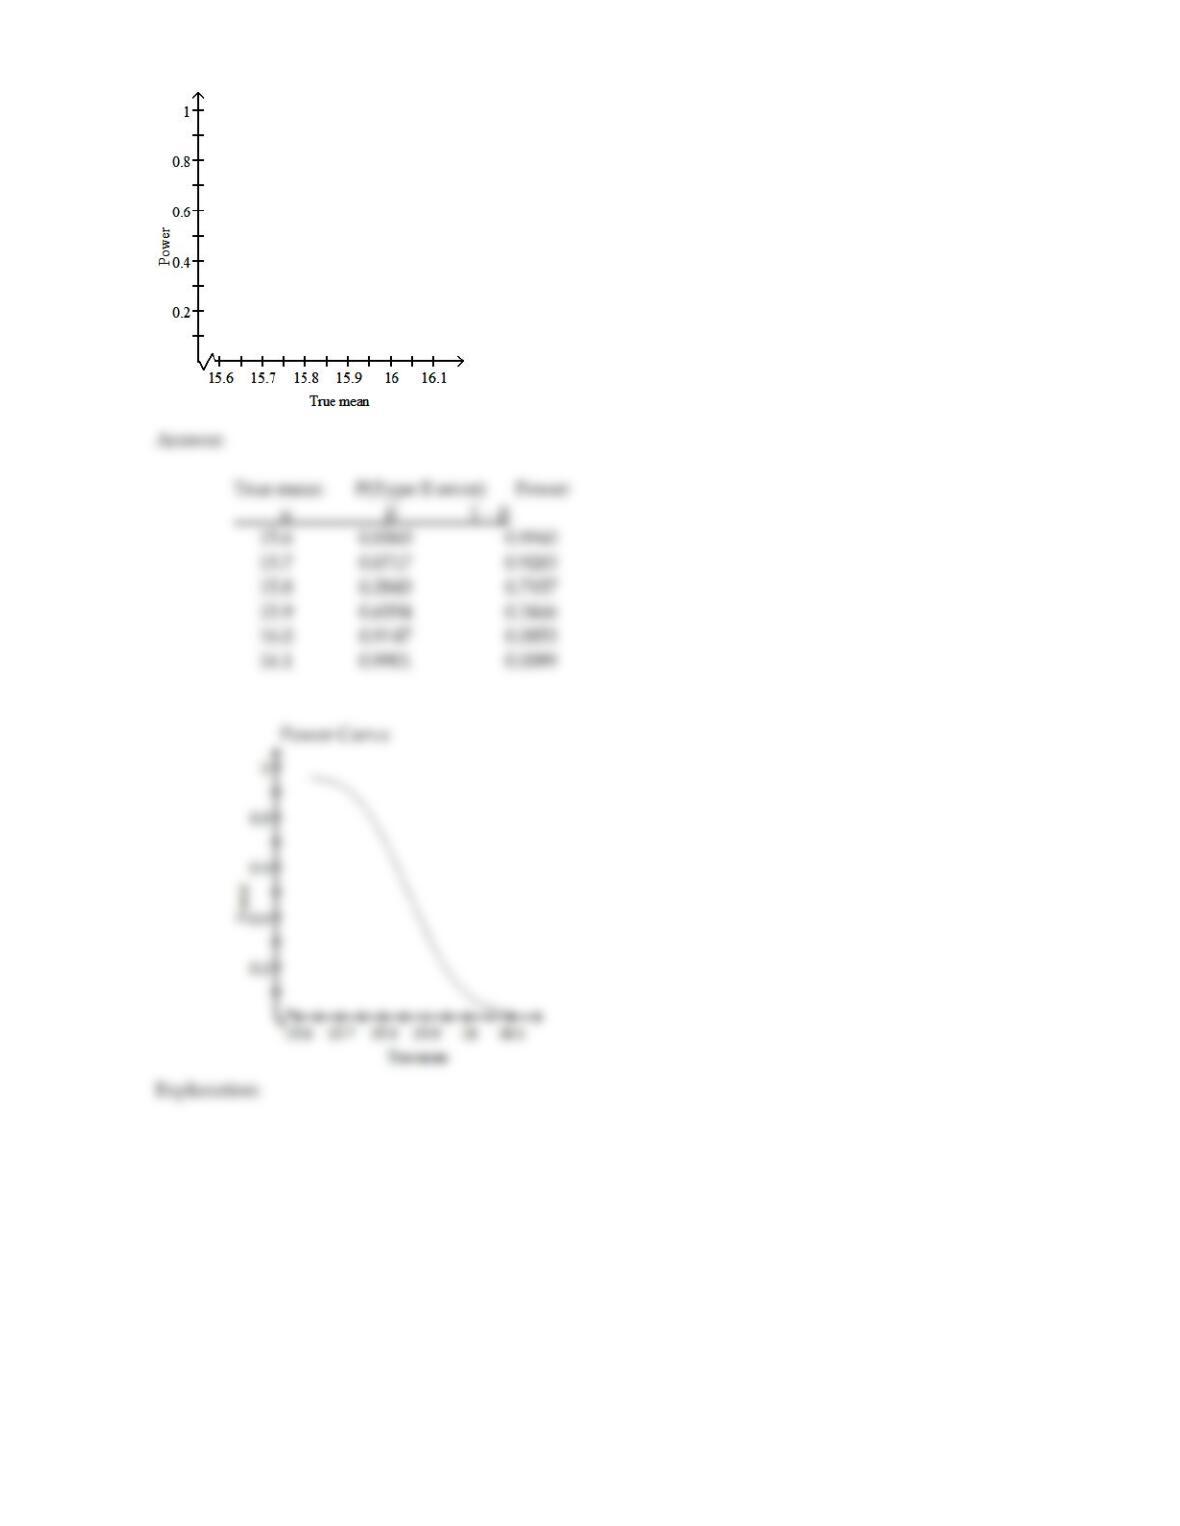
A hypothesis testing situation is given. The population standard deviation, sample size, and significance level are given.
Complete the table to give the probability of a Type II error and the power for each of the given values of µ. Use the table
to draw the power curve.
105)
A manufacturer claims that the mean amount of juice in its 16 ounce bottles is 16.1 ounces.
A consumer advocacy group wants to perform a hypothesis test to determine whether the
mean amount is actually less than this. Preliminary data analyses indicate that it is
reasonable to apply a z–test. The hypotheses are
H0: µ= 16.1 ounces
Ha: µ< 16.1 ounces.
Assume that = 0.8 ounces, n = 60, and the significance level is 0.01. Find the probability
of a Type II error and the power for µ = 15.6, 15.7, 15.8, 15.9, 16.0, 16.1.
True mean P(Type II error) Power
µ 1 –
15.6
15.7
15.8
15.9
16.0
16.1
Power Curve
105)
53
Two graphical displays are given for a set of data. A hypothesis test is to be performed for the mean of the population
from which the data were obtained. Would it be reasonable to use a one–mean z–test? Explain your reasoning. Assume
that the population standard deviation is known.
54
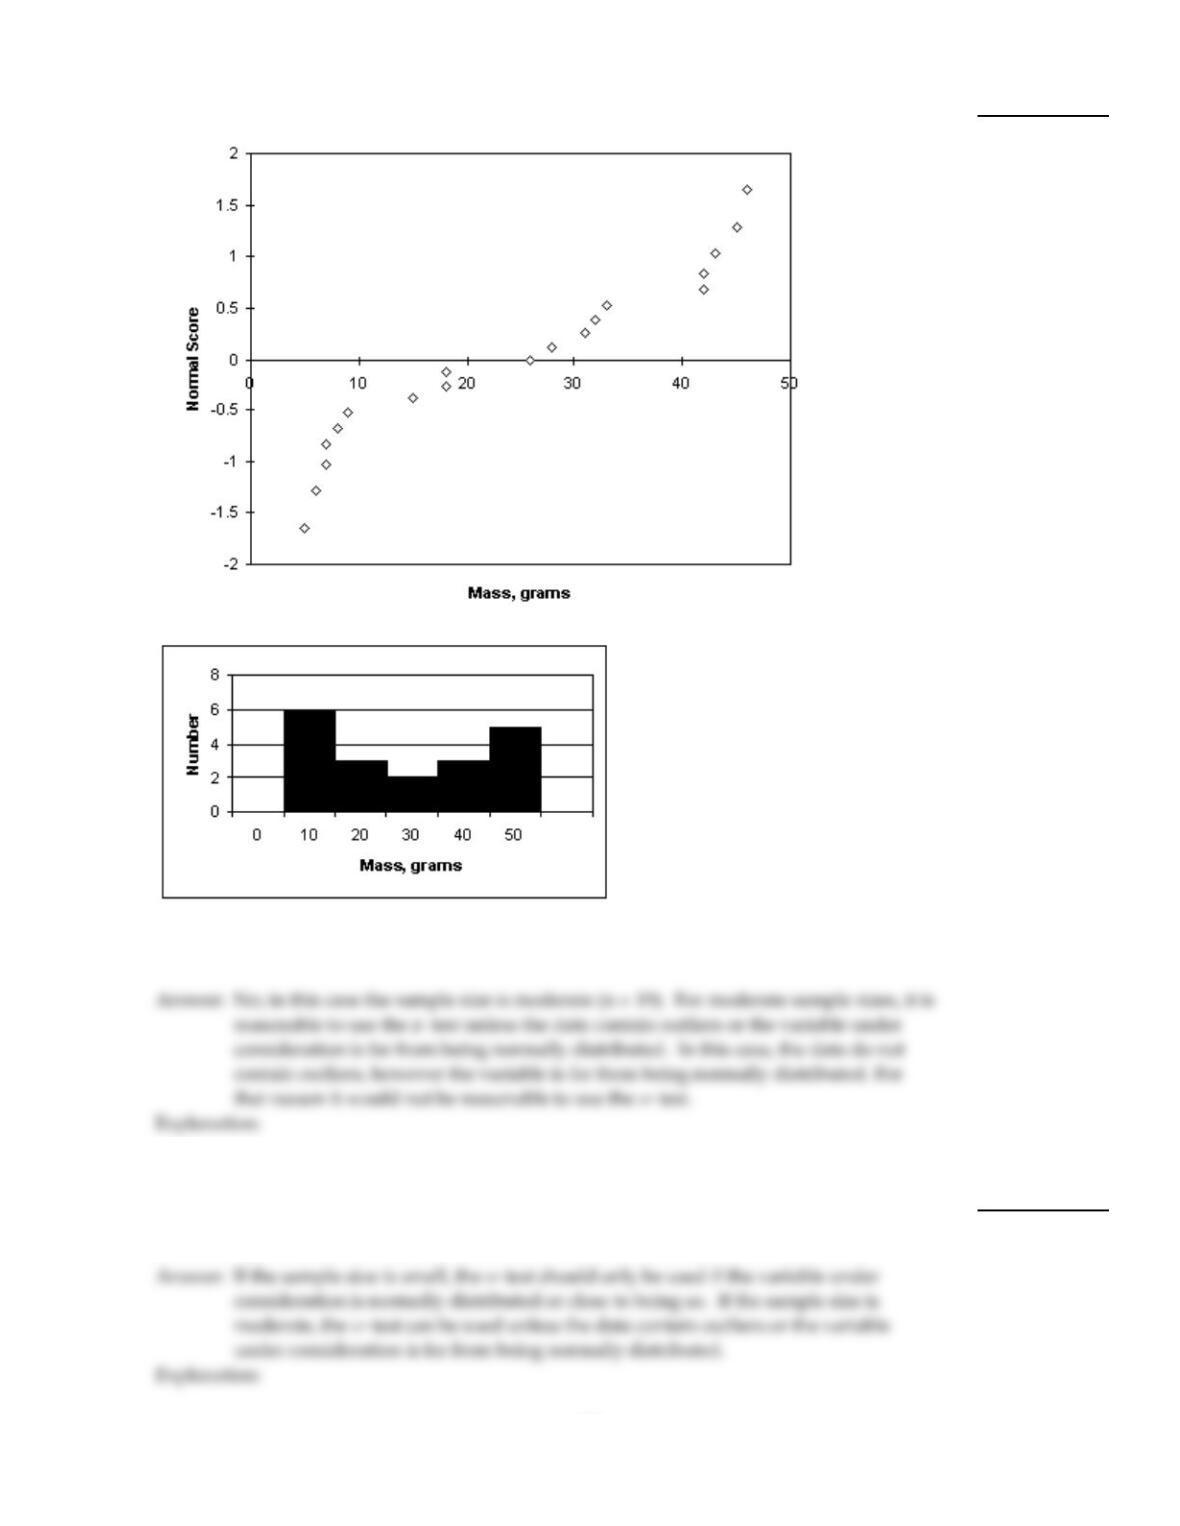
106)
A normal probability plot and a histogram plot of the data are given below.
106)
Provide an appropriate response.
107)
A hypothesis test for a population mean is to be performed. If the sample size is small (less
than 15), under what conditions is it reasonable to use the z–test? If the sample size is
moderate (between 15 and 30), under what conditions is it reasonable to use the z–test?
107)
55
Preliminary data analyses indicate that it is reasonable to use a t–test to carry out the specified hypothesis test. Perform
the t–test using the P–value approach.
108)
DuraBurn claims that the mean lifetime of its SuperGlo light bulbs is 798 hours. A
researcher wants to perform a hypothesis test to determine whether the mean lifetime is
actually less than this. A random sample of 20 DuraBurn SuperGlo bulbs exhibited an
average lifetime x=720 hours with a standard deviation s =75 hours. Using the
hypotheses
H0: µ=798
Ha: µ<798,
compute the value of the test statistic, and find the P–value for the sample. State your
conclusion. Use a significance level of 0.05.
108)
Provide an appropriate response.
109)
Suppose that you want to perform a hypothesis test for a population mean. Give an
example of a situation in which both the t–test and the Wilcoxon signed–rank test are
permissible but the Wilcoxon signed–rank test is preferable. Specify the distribution of the
variable under consideration, the sample size, and whether or not the population standard
deviation is known.
109)
110)
What assumption is required for the Wilcoxon signed–rank test? Why do you think this
assumption is required?
110)
111)
Outline the six steps involved in performing a one–sample z–test for a population mean.
111)
56
112)
A one–sample z–test for a population mean is to be performed. Why might it be more
useful for those interpreting the results to know the P–value rather than simply whether or
not the null hypothesis was rejected?
112)
113)
A hypothesis test for a population mean is to be performed. The hypotheses are
H0: µ= 60
Ha: µ> 60.
Do you think the probability of a Type II error will be larger if µ= 61 or if µ= 65? Explain
your thinking.
113)
MULTIPLE CHOICE. Choose the one alternative that best completes the statement or answers the question.
A hypothesis test is to be performed. Determine the null and alternative hypotheses.
114)
A psychologist has designed a test to measure stress levels in adults. She has determined that
nationwide the mean score on her test is 20. A hypothesis test is to be conducted to determine
whether the mean score for trial lawyers exceeds the national mean score.
114)
A)
H0: µ>20
Ha: µ20
B)
H0: µ=20
Ha: µ>20
C)
H0: µ=20
Ha: µ20
D)
H0: µ<20
Ha: µ>20
Classify the hypothesis test as two–tailed, left–tailed, or right–tailed.
115)
In the past, the mean running time for a certain type of flashlight battery has been 8.1 hours. The
manufacturer has introduced a change in the production method and wants to perform a
hypothesis test to determine whether the mean running time has changed as a result.
115)
A)
Two–tailed
B)
Left–tailed
C)
Right–tailed
57

A sample mean, sample standard deviation, and sample size are given. Use the one–mean t–test to perform the required
hypothesis test about the mean, µ, of the population from which the sample was drawn. Use the P–value approach. Also,
assess the strength of the evidence against the null hypothesis.
116)
x= 226,450, s = 11,500, n = 23, H0: µ= 220,000, Ha: µ> 220,000, = 0.01
116)
A)
Test statistic: t = 2.69, P–value = 0.0036. Reject the null hypothesis. There is sufficient
evidence to conclude that the mean is greater than 220,000. The evidence against the null
hypothesis is very strong.
B)
Test statistic: t = 2.69, P–value = 0.00669. Reject the null hypothesis. There is sufficient
evidence to conclude that the mean is greater than 220,000. The evidence against the null
hypothesis is very strong.
C)
Test statistic: t = 2.69, P–value = 0.9933. Do not reject the null hypothesis. There is not
sufficient evidence to conclude that the mean is greater than 220,000. The evidence against the
null hypothesis is weak or none.
D)
Test statistic: t = 0.56, P–value = 0.2877. Do not reject the null hypothesis. There is not
sufficient evidence to conclude that the mean is greater than 220,000. The evidence against the
null hypothesis is weak or none.
Use a table of t–values to estimate the P–value for the specified one–mean t–test.
117)
Left–tailed test, n = 15, t = – 2.627
117)
A)
0.01 < P < 0.025
B)
0.005 < P < 0.01
C)
P < 0.005
D)
P > 0.005
118)
Two–tailed test, n = 9, t = 3.479
118)
A)
P < 0.005
B)
0.02 < P < 0.05
C)
P > 0.005
D)
P < 0.01
58
A sample mean, sample size, and population standard deviation are given. Use the one–mean z–test to perform the
required hypothesis test at the given significance level. Use the critical –value approach.
119)
x=25, n =40, = 1.5, H0: µ=22; Ha: µ22, = 0.05
119)
A)
z=12.65; critical values = ±1.645; do not reject H0
B)
z=12.65; critical values = ±1.96; reject H0
C)
z=12.65; critical values = ±1.96; do not reject H0
D)
z=12.65; critical values = ±1.645; reject H0
A hypothesis test is to be performed. Determine the null and alternative hypotheses.
120)
The recommended dietary allowance (RDA) of vitamin C for women is 75 milligrams per day. A
hypothesis test is to be performed to decide whether adult women are, on average, getting less than
the RDA of 75 milligrams per day.
120)
A)
H0: µ= 75 mg
Ha: µ 75 mg
B)
H0: µ> 75 mg
Ha: µ< 75 mg
C)
H0: µ= 75 mg
Ha: µ< 75 mg
D)
H0: µ< 75 mg
Ha: µ= 75 mg
A sample mean, sample size, and population standard deviation are given. Use the one–mean z–test to perform the
required hypothesis test at the given significance level. Use the critical –value approach.
121)
x=51, n =36 , = 3.6, H0: µ= 50; Ha: µ> 50, = 0.01
121)
A)
z =1.67;critical value = 2.33; reject H0
B)
z =1.67;critical value = 2.33; do not reject H0
C)
z = 0.28; critical value = 2.33; do not reject H0
D)
z =1.67;critical value = 1.33; reject H0
Provide an appropriate response.
122)
A hypothesis test for a population mean is to be performed. True or false: The probability of a Type
I error is equal to the significance level.
122)
A)
True
B)
False
59

For the given hypothesis test, determine the probability of a Type II error or the power, as specified.
123)
A manufacturer claims that the mean amount of juice in its 16 ounce bottles is 16.1 ounces. A
consumer advocacy group wants to perform a hypothesis test to determine whether the mean
amount is actually less than this. Preliminary data analyses indicate that it is reasonable to apply a
z–test. The hypotheses are
H0: µ= 16.1 ounces
Ha: µ< 16.1 ounces.
Assume that = 0.8 ounces, n = 60, and the significance level is 0.01. Find the probability of a Type
II error if in fact µ= 15.8 ounces.
123)
A)
0.2843
B)
0.7157
C)
0.99
D)
0.01
For the given hypothesis test, explain the meaning of a Type I error, a Type II error, or a correct decision as specified.
124)
In 2000, the mean math SAT score for students at one school was 475. Five years later, in 2005, a
teacher performed a hypothesis test to determine whether the average math SAT score of students
at the school had changed from the 2000 mean of 475. The hypotheses were:
H0: µ=475
Ha: µ475
where µ is the mean math SAT score, in 2005, for students at the school
Explain the meaning of a Type II error.
124)
A)
A Type II error would occur if, in fact, µ=475, but the results of the sampling lead to the
conclusion that µ475
B)
A Type II error would occur if, in fact, µ=475, but the results of the sampling do not lead to
rejection of that fact
C)
A Type II error would occur if, in fact, µ475, and the results of the sampling lead to that
conclusion.
D)
A Type II error would occur if, in fact, µ475, but the results of the sampling fail to lead to
that conclusion.
Find the critical value(s) for the specified Wilcoxon signed–rank test.
125)
Sample size = 14, right–tailed test, significance level = 0.01
125)
A)
16
B)
92
C)
89
D)
13
60