Determine the specified calculation.
100)
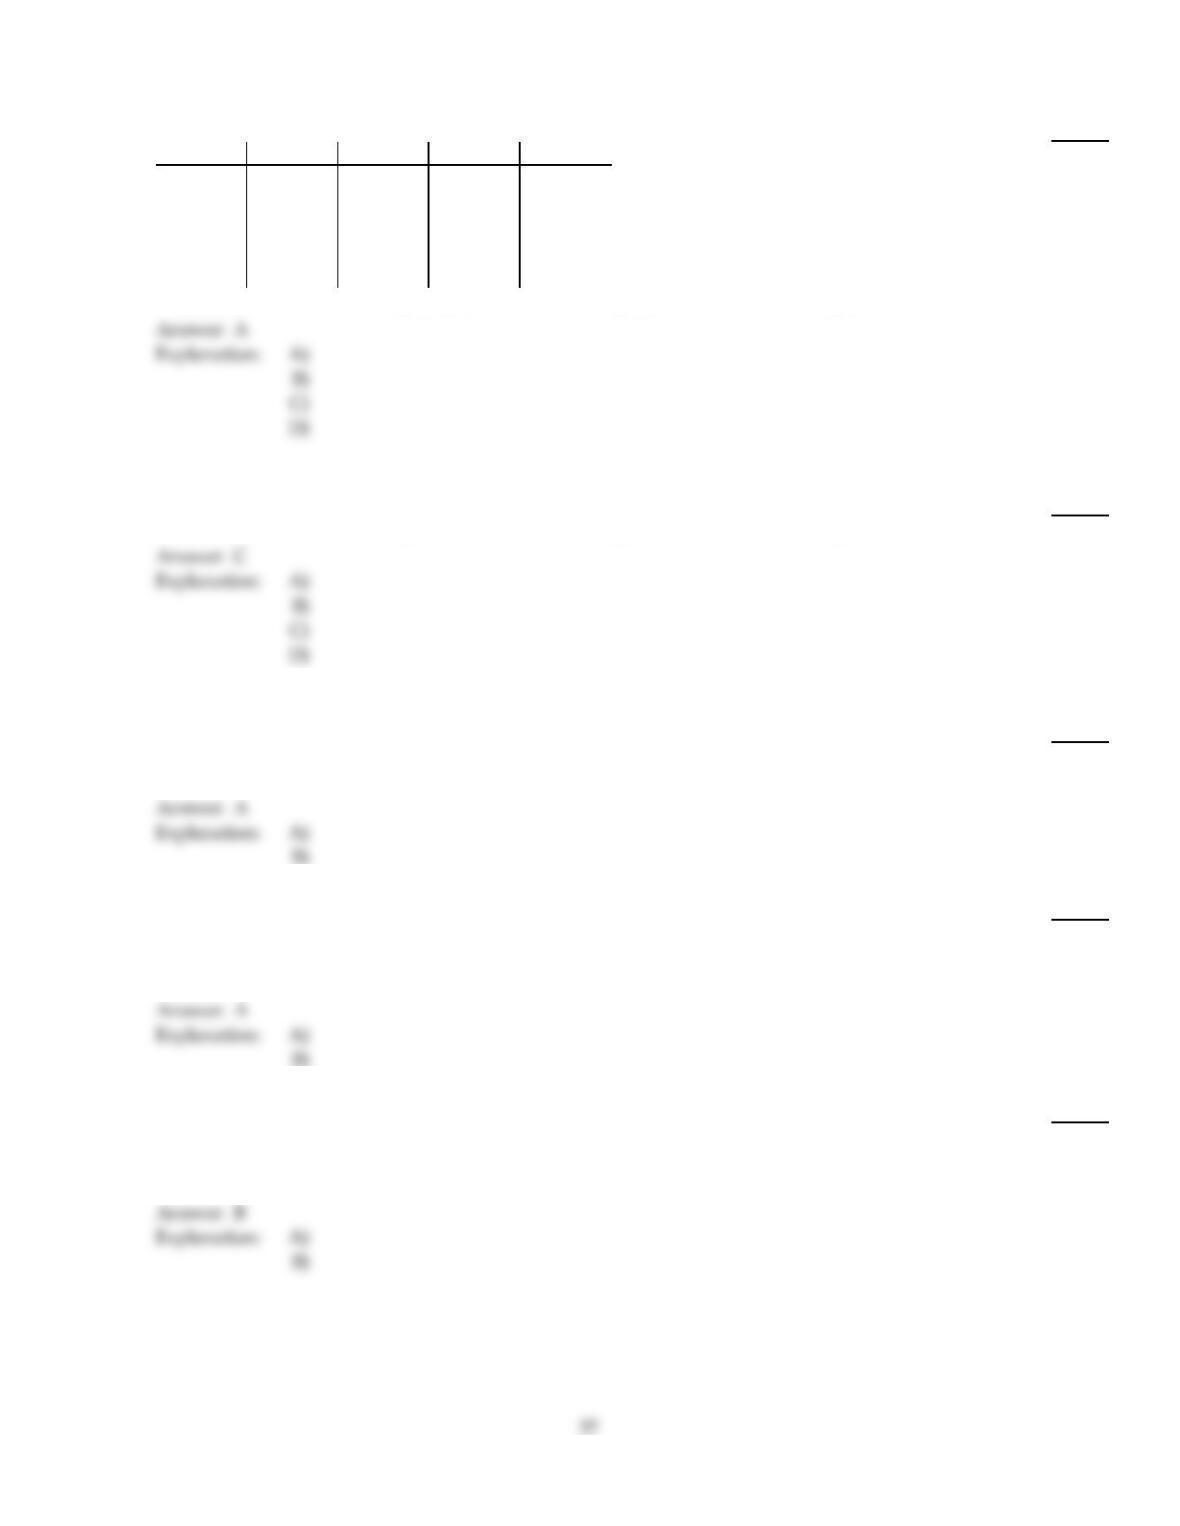
Sample 1 Sample 2 Sample 3 Sample 4 Sample 5
610 810 8
813 9 9 12
712 911
11 8 9
9
MSE
100)
A)
1.885
B)
33.778
C)
24.5
D)
8.444
Find the required q–value.
101)
For a q–curve with parameters = 7 and = 15, find the q–value having area 0.05 to its right.
101)
A)
5.99
B)
6.76
C)
4.78
D)
9.12
Provide an appropriate response.
102)
True or false: When performing a one–way ANOVA, the error sum of squares can be obtained by
subtracting the treatment sum of squares from the total sum of squares.
102)
A)
True
B)
False
103)
A Kruskal–Wallis test is to be performed to compare the means of four populations. True or false?
The null hypothesis of equal means will be rejected if the variation among the sample mean ranks
is large relative to the variation of all ranks.
103)
A)
True
B)
False
104)
A one–way ANOVA is to be performed. True or false: The error mean square gives a measure of
the variation within the samples, while the treatment mean square gives a measure of variation
among the sample means.
104)
A)
False
B)
True
Find the required F–value.
105)
An F–curve has df = (30, 12). Find the F–value having area 0.01 to its right.
105)
A)
1.77
B)
2.01
C)
3.70
D)
2.84
Compute the sum of squares.
106)
A one–way ANOVA is to be performed. Independent random samples are selected from three
different populations. The sample data are given in the table below.
Sample 1 Sample 2 Sample 3
2 5 4
3 6 8
1 7
7
Compute the error sum of squares, SSE.
106)
A)
180.5
B)
16.5
C)
11.5
D)
28.0
107)
A one–way ANOVA is to be performed. Independent random samples are selected from four
different populations. The sample data are given in the table below.
Sample 1 Sample 2 Sample 3 Sample 4
2 4 3 4
3 4 5 9
2 1 8
8 9
7
Compute the total sum of squares, SST.
107)
A)
152.9
B)
127.9
C)
98.9
D)
4550
108)
A one–way ANOVA is to be performed. Independent random samples are selected from three
different populations. The sample data are given in the table below.
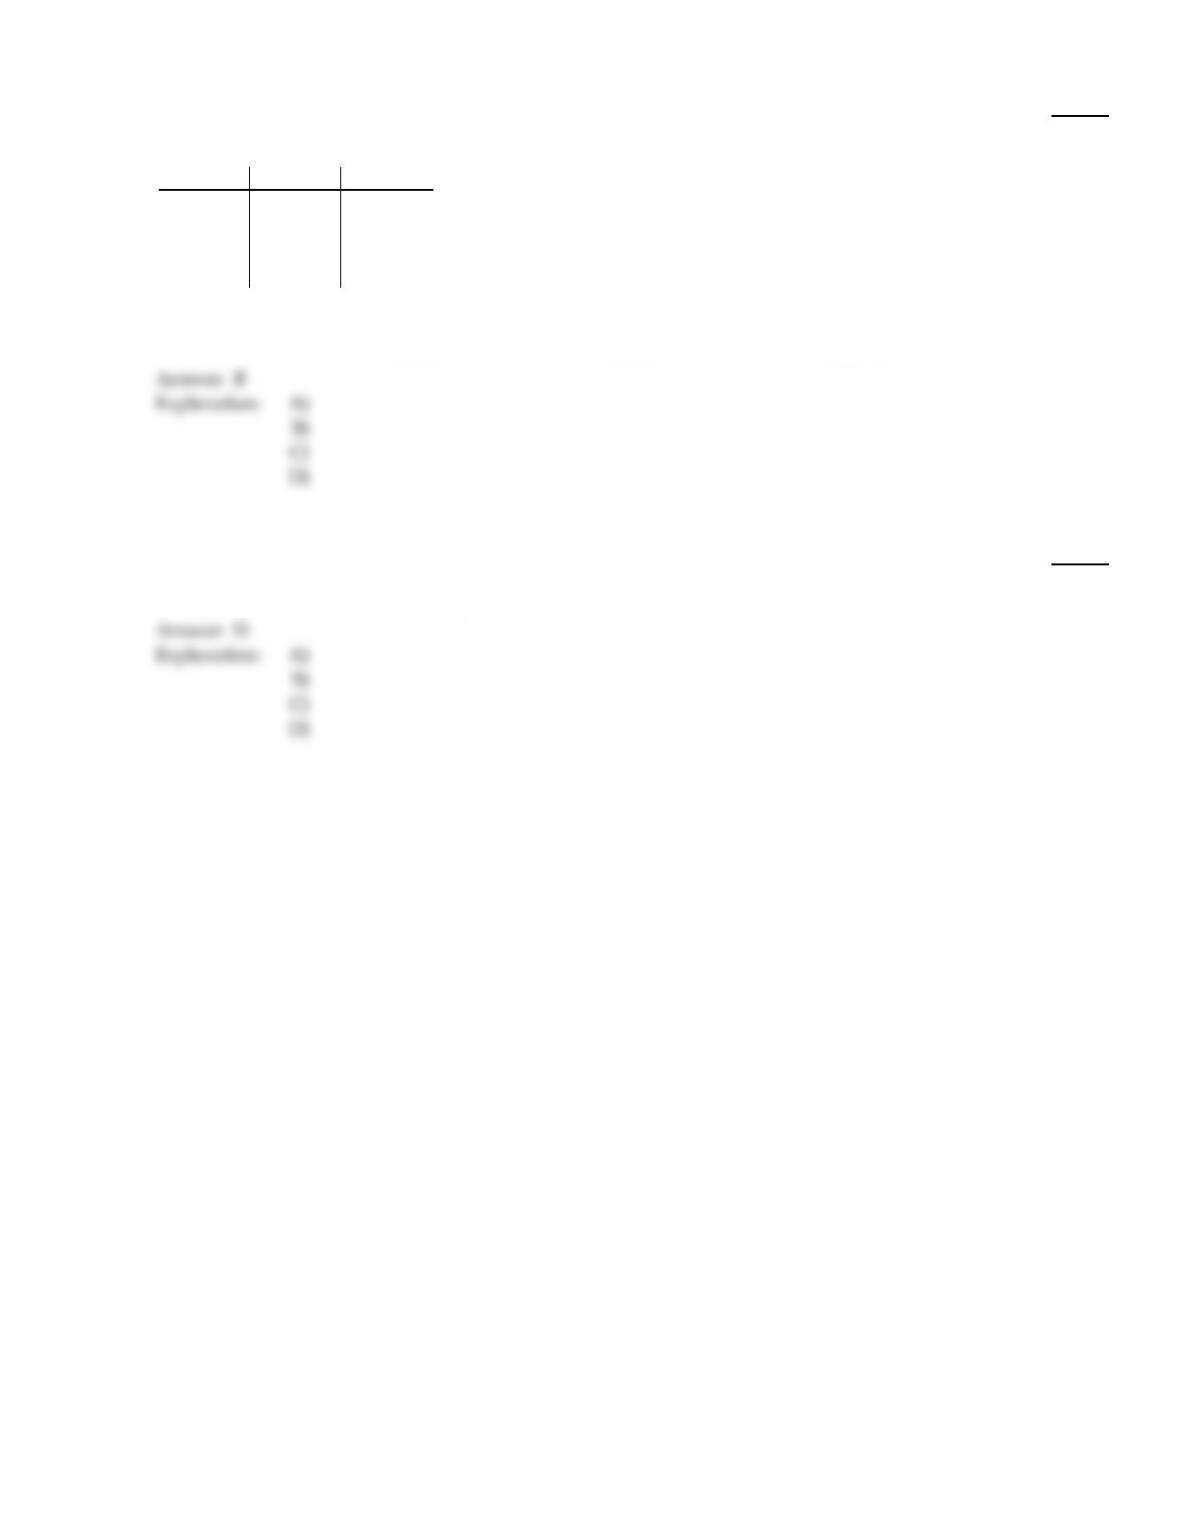
Sample 1 Sample 2 Sample 3
4 8 8
3 2 5
4 6
5
Compute the treatment sum of squares, SSTR.
108)
A)
85.2
B)
9.3
C)
34.0
D)
234.3
Provide an appropriate response.
109)
A one–way ANOVA is performed to compare the means of four populations. The sample sizes are
20, 22, 15, and 17. Determine the degrees of freedom for the F–statistic.
109)
A)
(4, 70)
B)
(3, 73)
C)
(70, 73)
D)
(3, 70)
39
Fill in the missing entries in the partially completed one–way ANOVA table.
110)
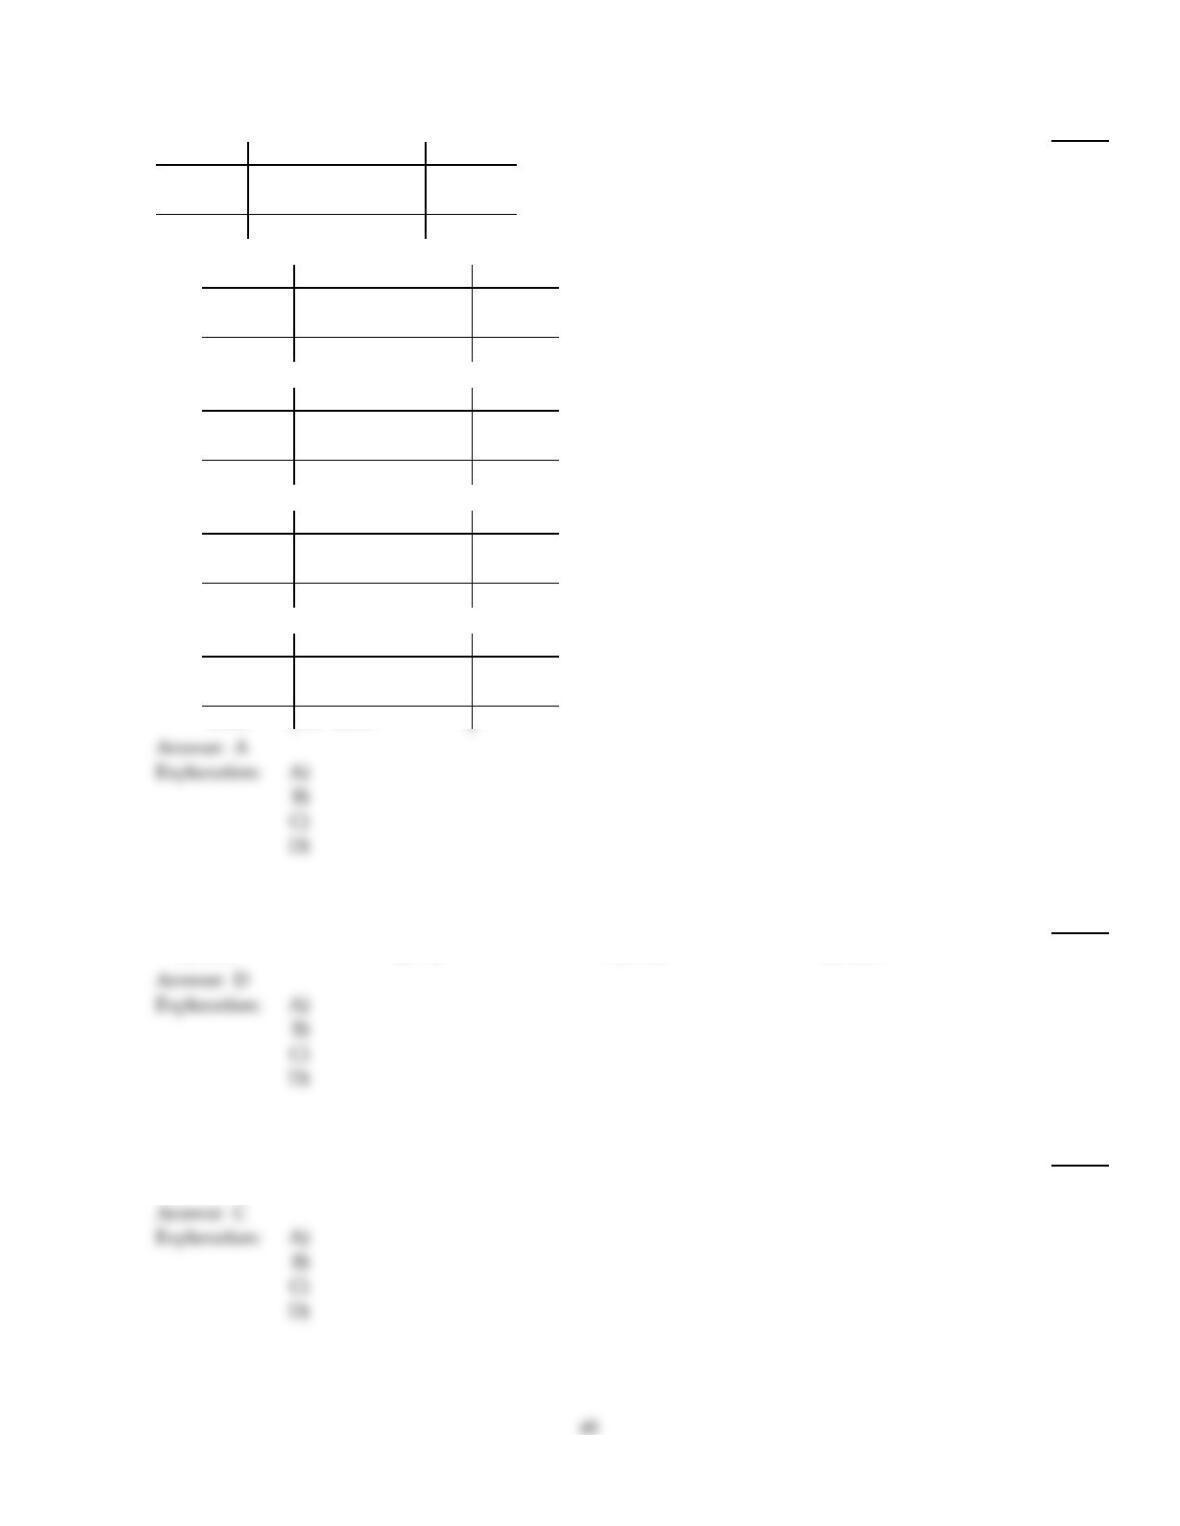
Source df SS MS = SS/df F–statistic
Treatment 20.5
Error 29 3.9
Total 34
110)
A)
Source df SS MS = SS/df F–statistic
Treatment 520.5 4.10 1.05
Error 29 113.1 3.9
Total 34 133.6
B)
Source df SS MS = SS/df F–statistic
Treatment 520.5 4.10 1.05
Error 29 113.1 3.9
Total 34 92.6
C)
Source df SS MS = SS/df F–statistic
Treatment 520.5 0.18 0.046
Error 29 113.1 3.9
Total 34 133.6
D)
Source df SS MS = SS/df F–statistic
Treatment 5 20.5 4.10 0.95
Error 29 113.1 3.9
Total 34 133.6
Find the required q–value.
111)
For a q–curve with parameters = 10 and = 16, find q0.01 .
111)
A)
5.86
B)
7.27
C)
5.44
D)
6.35
Find the required F–value.
112)
For an F–curve with df = (20, 5), find F0.025 .
112)
A)
3.29
B)
4.10
C)
6.33
D)
4.56
Provide an appropriate response.
113)
True or false: In a one–way ANOVA, the null hypothesis will be rejected if the variation among the
sample means is large relative to the variation within the samples.
113)
A)
True
B)
False
Fill in the missing entries in the partially completed one–way ANOVA table.
114)
Source df SS MS = SS/df F–statistic
Treatment 322.97 11.16
Error 13.72 0.686
Total
114)
A)
Source df SS MS = SS/df F–statistic
Treatment 322.97 7.66 11.16
Error 20 13.72 0.686
Total 23 9.25
B)
Source df SS MS = SS/df F–statistic
Treatment 322.97 1.67 2.43
Error 20 13.72 0.686
Total 23 36.69
C)
Source df SS MS = SS/df F–statistic
Treatment 322.97 1.15 1.68
Error 20 13.72 0.686
Total 23 36.69
D)
Source df SS MS = SS/df F–statistic
Treatment 322.97 7.66 11.16
Error 20 13.72 0.686
Total 23 36.69
Find the required F–value.
115)
For an F–curve with df = (60, 10), find F0.05 .
115)
A)
4.86
B)
1.99
C)
2.90
D)
2.62
Fill in the missing entries in the partially completed one–way ANOVA table.
116)
Source df SS MS = SS/df F–statistic
Treatment 25.2
Error 16 4.1
Total 20
116)
A)
Source df SS MS = SS/df F–statistic
Treatment 425.2 6.30 1.54
Error 16 65.6 4.1
Total 20 25.46
B)
Source df SS MS = SS/df F–statistic
Treatment 425.2 6.30 0.65
Error 16 65.6 4.1
Total 20 90.8
C)
Source df SS MS = SS/df F–statistic
Treatment 425.2 0.70 221.27
Error 16 65.6 4.1
Total 20 90.8
D)
Source df SS MS = SS/df F–statistic
Treatment 425.2 6.30 1.54
Error 16 65.6 4.1
Total 20 90.8
Determine the specified calculation.
117)
Sample 1 Sample 2 Sample 3 Sample 4 Sample 5
410 11 10 8
813 11 912
10 12 911
11 8 9
9
F
117)
A)
0.761
B)
0.404
C)
1.314
D)
2.473
118)
Sample 1 Sample 2 Sample 3
6 2 2
6 4 5
8 4
6
SSTR
118)
A)
21.889
B)
10.944
C)
9.667
D)
1.611
Fill in the missing entries in the partially completed one–way ANOVA table.
119)
Source df SS MS = SS/df F–statistic
Treatment 22
Error 22 3
Total 26
119)
A)
Source df SS MS = SS/df F–statistic
Treatment 48 22 10.33
Error 22 66.0 3
Total 26 88.0
B)
Source df SS MS = SS/df F–statistic
Treatment 422 5.50 1.83
Error 22 66.0 3
Total 26 44
C)
Source df SS MS = SS/df F–statistic
Treatment 422 0.33 0.11
Error 22 66.0 3
Total 26 88.0
D)
Source df SS MS = SS/df F–statistic
Treatment 422 5.50 1.83
Error 22 66.0 3
Total 26 88.0
D)
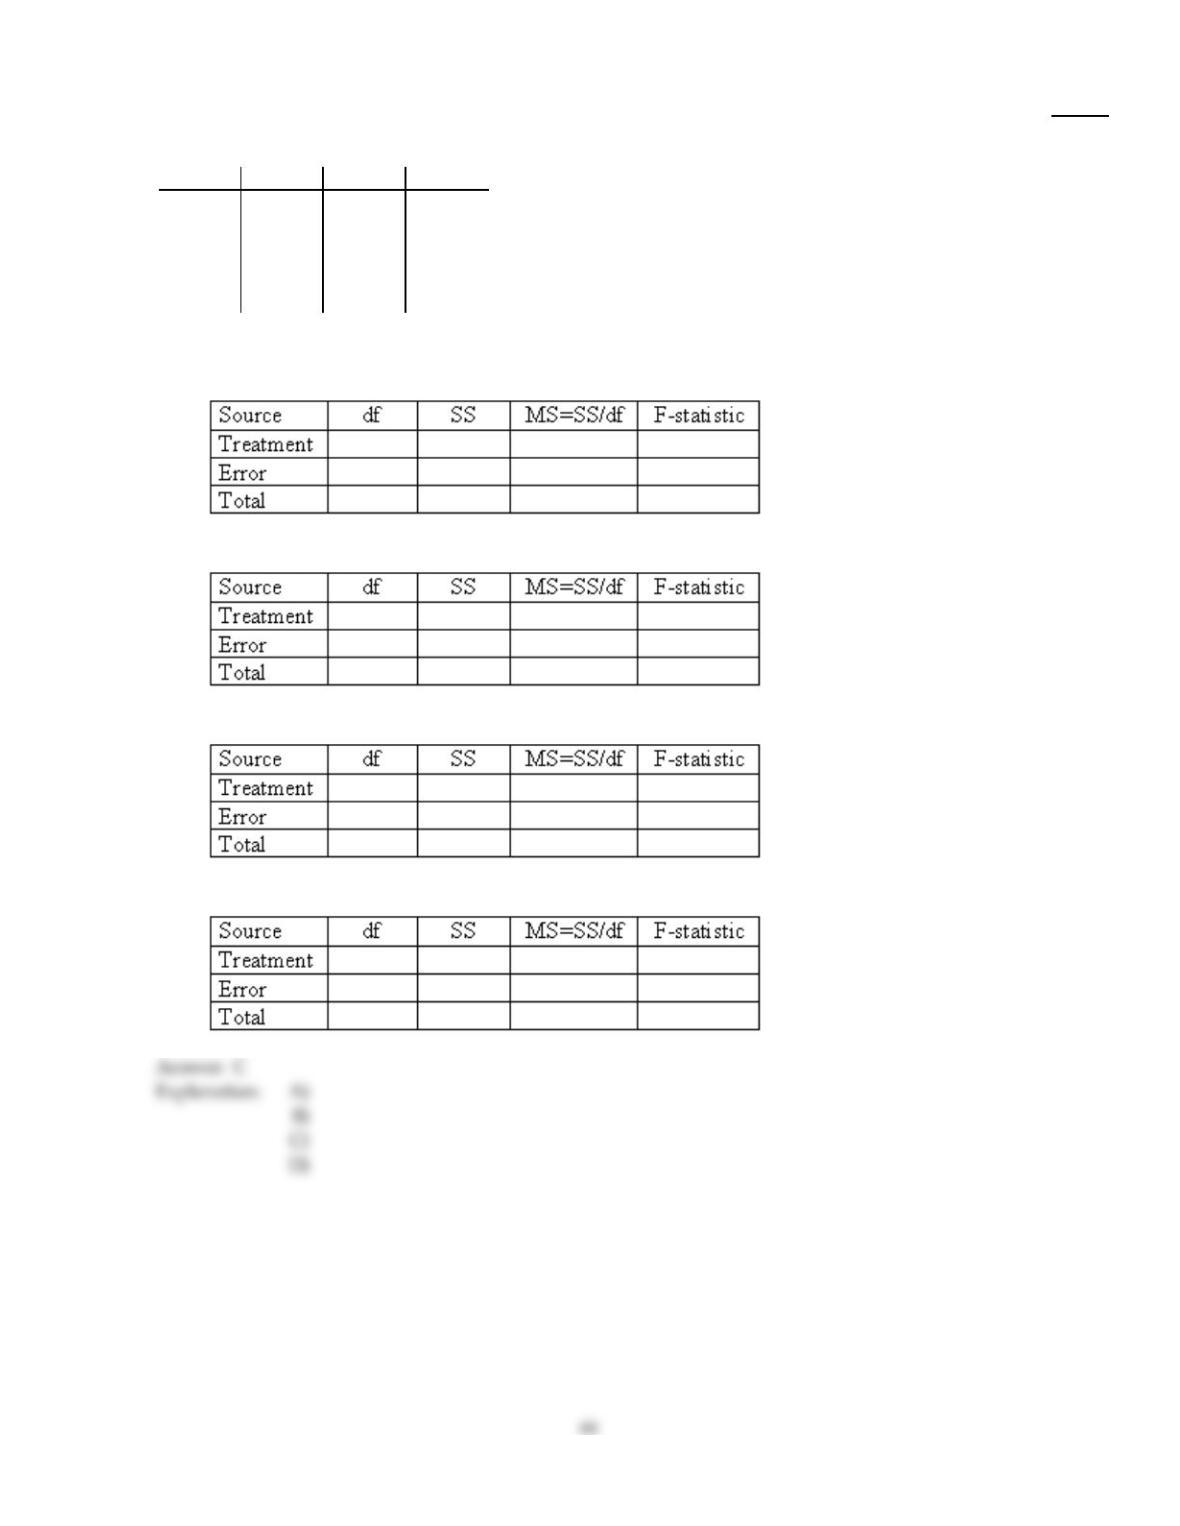
Construct the one–way ANOVA table.
43
D)
120)
A one–way ANOVA is to be performed. Independent random samples are selected from four
different populations. The sample data are given in the table below.
Sample 1 Sample 2 Sample 3 Sample 4
38 36 34 25
36 28 25 34
31 24 34 29
42 27 40
29
Construct the one–way ANOVA table for the data.
120)
A)
398.53 32.84 1.07
12 367.47 30.62
15 466.00
B)
388.53 29.51 0.95
12 377.47 31.46
15 466.00 31.07
C)
388.53 29.51 0.94
12 377.47 31.46
15 466.00
D)
488.53 22.13 0.70
12 377.47 31.46
16 466.00
Provide an appropriate response.
121)
A Kruskal–Wallis test is being performed to compare 4 population means. If the null hypothesis of
equal means is true, what is the approximate distribution of the test statistic
H =SSTR
SST/(n–1) ?
Assume that the samples are independent and that the 4 distributions of the variable under
consideration have the same shape. n denotes the total number of observations.
121)
A)
Chi–square distribution with df =3
B)
Normal distribution
C)
Chi–square distribution with df =4
D)
Chi–square distribution with df = n – 1
Explanation:
Answer Key
Testname: C16
46
Answer Key
Testname: C16
47
Answer Key
Testname: C16
48
Answer Key
Testname: C16
49
Answer Key
Testname: C16
Answer Key
Testname: C16
Answer Key
Testname: C16