Obtain the five–number summary for the given data.
172)
2, 3, 6, 8, 9, 11, 14
172)
A)
2, 5, 6, 4, 14
B)
2, 6, 8, 9, 14
C)
2, 3, 8, 11, 14
D)
2, 4.5, 8, 10, 14
173)
The normal annual precipitation (in inches) is given below for 21 different U.S. cities.
39.1 33.0 18.5 35.3 27.1 27.8 8.6
23.0 42.6 34.1 20.3 12.0 5.1 13.2
22.0 10.9 15.9 25.4 17.2 15.2 51.7
173)
A)
5.1, 15.2, 22.0, 33.0, 51.7 inches
B)
5.1, 13.700, 21.15, 31.700, 51.7 inches
C)
5.1, 13.700, 22.0, 31.700, 51.7 inches
D)
5.1, 14.20, 21.15, 33.55, 51.7 inches
Find the mean for the given sample data. Unless otherwise specified, round your answer to one more decimal place than
that used for the observations.
174)
Frank’s Furniture employees earned the following amounts last week:
$458.30 $288.60 $275.04 $180.94 $418.33
$491.87 $484.75 $394.36 $296.11
What was the mean amount earned by an employee last week? Round your answer to the nearest
cent.
174)
A)
$358.70
B)
$411.04
C)
$469.76
D)
$365.37
Identify potential outliers, if any, for the given data.
175)
The normal monthly precipitation (in inches) for August is listed for 20 different U.S. cities.
0.4 1.0 1.5 1.6 2.0
2.2 2.4 2.7 3.4 3.4
3.5 3.6 3.6 3.7 3.7
3.9 4.1 4.2 4.2 7.0
175)
A)
0.4
B)
4.2, 7.0
C)
7.0
D)
0.4, 7.0
Provide an appropriate response.
176)
Find the population mean. Round to one decimal place as needed.
0, 2, 7, 7, 8
176)
A)
24
B)
5
C)
6
D)
4.8
Use the empirical rule to solve the problem.
177)
At one college, GPA’s have a roughly bell–shaped distribution with a mean of 2.9 and a standard
deviation of 0.6. What percentage of students at the college have a GPA between 2.3 and 3.5?
177)
A)
99.7%
B)
95%
C)
84.13%
D)
68%
Find the sample standard deviation for the given data. Round your final answer to one more decimal place than that used
for the observations.
178)
The manager of an electrical supply store measured the diameters of the rolls of wire in the
inventory. The diameters of the rolls (in m) are listed below.
0.566 0.507 0.375 0.224 0.436 0.572 0.124
178)
A)
0.1721 m
B)
0.2240 m
C)
1.1232 m
D)
1.3009 m
Determine the quartile or interquartile range as specified.
179)
The test scores of 15 students are listed below. Find the first quartile, Q1.
40 45 51 55 60
62 67 69 75 79
85 87 90 94 95
179)
A)
55
B)
57.5
C)
53.0
D)
54.00
180)
The weekly salaries (in dollars) of sixteen government workers are listed below. Find the third
quartile, Q3.
492 794 545 855
506 747 623 816
669 885 450 567
709 473 650 527
180)
A)
$770.50
B)
$782.25
C)
$650
D)
$747
181)
The test scores of 19 students are listed below. Find the interquartile range.
91 47 86 70 60
64 97 55 90 78
82 83 50 88 72
44 92 94 67
181)
A)
29.5
B)
30
C)
27
D)
30.5
Provide an appropriate response.
182)
Following is the number of reported cases of influenza for two cities for the years 1996 through
2005:
City A 1163 1954 1487 1864 1779 1244 1332 1299 1353
1802
City B 937 1023 843 829 965 1011 943 831 976 858
(i) Without doing any calculations, decide for which city the standard deviation of the number
cases of influenza is larger. Explain.
(ii) Find the individual population standard deviations of the number of cases of influenza. Round
your final answer to two decimal places. Compare these answers with part (i).
182)
A)
(i) The range of the values for City A is 791, while it is only 192 for City B, so City A is likely
to have the larger standard deviation.
(ii) City A’s population standard deviation is 277.40; City B’s population standard deviation
is 71.29, so City A did have the larger standard deviation.
B)
(i) The range of the values for City A is 767, while it is only 121 for City B, so City A is likely
to have the larger standard deviation.
(ii) City A’s population standard deviation is 277.37; City B’s population standard deviation
is 72.01, so City A did have the larger standard deviation.
C)
(i) The range of the values for City A is 791, while it is only 192 for City B, so City A is likely
to have the larger standard deviation.
(ii) City A’s population standard deviation is 278.43; City B’s population standard deviation
is 71.25, so City A did have the larger standard deviation.
D)
(i) The range of the values for City A is 767, while it is only 121 for City B, so City A is likely
to have the larger standard deviation.
(ii) City A’s population standard deviation is 261.80; City B’s population standard deviation
is 69.47, so City A did have the larger standard deviation.
Find the sample standard deviation for the given data. Round your final answer to one more decimal place than that used
for the observations.
183)
The normal monthly precipitation (in inches) for August is listed for 12 different U.S. cities.
3.5 1.6 2.4 3.7 4.1 3.9
1.0 3.6 4.2 3.4 3.7 2.2
183)
A)
1.00 in.
B)
1.05 in.
C)
1.09 in.
D)
12.03 in.
Solve the problem. If necessary, round your answer to one more decimal place than that used for the observations.
184)
A scientist used the following data set showing the weight in pounds gained (or lost) by a sample
of eight laboratory animals given Drug X. Determine n, xi, and x.
8.1 –7.0 2.0 3.0
–2.4 2.2 5.5 –5.3
184)
A)
n = 8;
xi=6.1;
x=0.76
B)
n = 8;
xi=6.1;
x=0.87
C)
n =7;
xi=6.1;
x=0.76
D)
n =7;
xi=6.1;
x=0.87
Find the sample standard deviation for the given data. Round your final answer to one more decimal place than that used
for the observations.
185)
15, 42, 53, 7, 9, 12, 14, 28, 47
185)
A)
16.6
B)
29.1
C)
17.8
D)
15.8
Find the median for the given sample data.
186)
The weights (in ounces) of 21 cookies are shown.
0.81 1.44 0.66 1.62 0.82 0.63 1.24
1.44 1.53 0.96 0.81 1.14 1.09 0.61
0.47 1.14 0.63 1.09 1.72 0.82 0.56
186)
A)
0.79 oz
B)
0.96 oz
C)
0.61 oz
D)
1.44 oz
Find the mode(s) for the given sample data.
187)
7.2, 7.41, 7.56, 7.2, 7.88, 7.99, 7.62
187)
A)
7.551
B)
7.56
C)
7.41
D)
7.2
Construct and interpret a boxplot or a modified boxplot as specified.
188)
The weights (in ounces) of 27 tomatoes are listed below. Construct a modified boxplot for the data.
1.7 2.0 2.2 2.2 2.4 2.5 2.5 2.5 2.6
2.6 2.6 2.6 2.6 2.7 2.8 2.8 2.8 2.9
2.9 2.9 3.0 3.0 3.1 3.1 3.3 3.6 4.2
188)
A)
The data is highly right–skewed with three potential outliers.
B)
The data is roughly symmetrical and has two potential outliers.
C)
The data is left–skewed and has one potential outlier.
D)
The data is roughly symmetrical, possibly bell–shaped, with no potential outliers.
Find the median for the given sample data.
189)
A store manager kept track of the number of newspapers sold each week over a seven–week
period. The results are shown below.
85, 15, 214, 168, 292, 237, 235
189)
A)
235 newspapers
B)
178 newspapers
C)
214 newspapers
D)
168 newspapers
62
Find the range for the given data set.
190)
The weights, in pounds, of 18 randomly selected adults are given below.
120 165 187 143 119 132
127 156 179 159 180 202
114 146 151 168 173 144
190)
A)
78 lb
B)
202 lb
C)
88 lb
D)
114 lb
Find the sample standard deviation for the given data. Round your final answer to one more decimal place than that used
for the observations.
191)
496, 598, 503, 528, 565, 601, 576, 543
191)
A)
182.1
B)
40.4
C)
60.6
D)
170.2
Obtain the five–number summary for the given data.
192)
The test scores of 15 students are listed below.
43 46 50 55 58
62 66 71 74 79
85 87 90 94 95
192)
A)
43, 53.75, 71, 85.5, 95
B)
43, 55, 72.5, 87, 95
C)
43, 53.75, 72.5, 85.5, 95
D)
43, 56.5, 71, 86, 95
Solve the problem.
193)
Consider the following data set:
46 49 50 52 52 53 56 58 63 71
Note: x= 55 and s = 7.4
Also consider the graph of the data set:
Chebychev’s rule says that at least 0.75% of the observations lie within 2 standard deviations to
either side of the mean. What percentage of the observations actually lie within 2 standard
deviations to either side of the mean?
193)
A)
90%
B)
80%
C)
65%
D)
75%
Find the range for the given data set.
194)
The test scores of 19 students are listed below.
91 99 86 54 72
85 97 91 90 66
82 83 78 88 77
80 92 94 98
194)
A)
33
B)
54
C)
44
D)
45
Find the mean for the given sample data. Unless otherwise specified, round your answer to one more decimal place than
that used for the observations.
195)
16, 13, 8, 14, 6, 4, 6
195)
A)
11.2
B)
9.1
C)
9.6
D)
11.1
Identify potential outliers, if any, for the given data.
196)
The weights (in pounds) of 18 randomly selected adults are given below.
131 142 186 149 178 109
127 115 174 150 167 165
132 231 90 155 194 152
196)
A)
231
B)
90, 231
C)
90
D)
None
Provide an appropriate response.
197)
Which score has the highest relative position: a score of 40 on a test with a mean of 31 and a
standard deviation of 9, a score of 3.8 on a test with a mean of 2.5 and a standard deviation of 1.2 or
a score of 491 on a test with a mean of 445 and a standard deviation of 46? (Assume that the
distributions being compared have approximately the same shape.)
197)
A)
A score of 491
B)
A score of 3.8
C)
A score of 40
Find the mode(s) for the given sample data.
198)
76, 25, 76, 13, 25, 29, 56, 76
198)
A)
47
B)
25
C)
42.5
D)
76
199)
86, 62, 32, 62, 29, 86
199)
A)
62
B)
86
C)
59.5
D)
86, 62
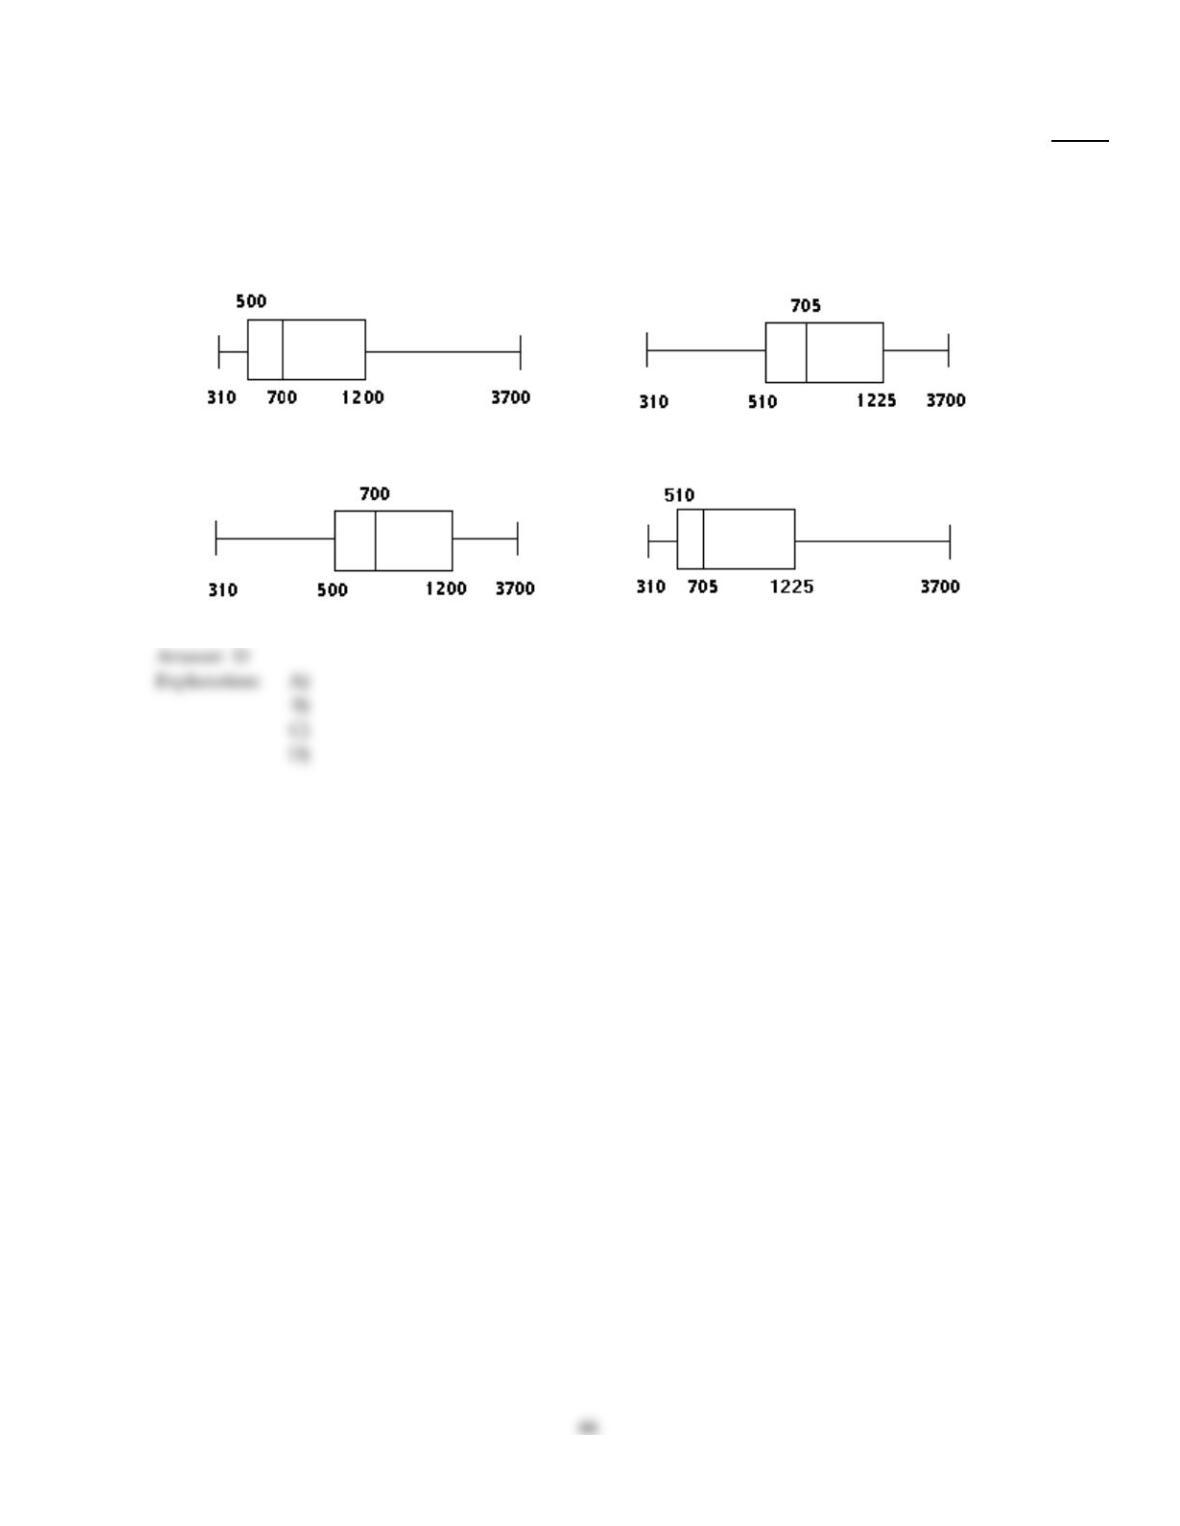
Construct and interpret a boxplot or a modified boxplot as specified.
200)
The weekly salaries (in dollars) of 24 randomly selected employees of a company are shown below.
Construct a boxplot for the data.
310 320 450 460 470 500 520 540
580 600 650 700 710 840 870 900
1000 1200 1250 1300 1400 1720 2500 3700
200)
A)
The data is highly right–skewed.
B)
The data is fairly symmetrical.
C)
The data is fairly symmetrical.
D)
The data is highly right–skewed.
Answer Key
Testname: C3
Answer Key
Testname: C3
68
Answer Key
Testname: C3
69
Answer Key
Testname: C3
Answer Key
Testname: C3

Answer Key
Testname: C3