Perform a chi–square independence test using the critical value approach, provided the conditions for using the test are
met. Be sure to state the hypotheses and the significance level, to obtain the expected frequencies, to obtain the critical
value, to compute the value of the test statistic, and to state your conclusion.
42)
At the 0.01 significance level, do the data provide sufficient evidence to conclude that an
association exists between car color and the likelihood of being in an accident?
Red Blue White
Car has been in accident 28 33 36
Car has not been in accident 23 22 30
42)
Perform a chi–square independence test using the P–value approach, provided the conditions for using the test are met.
Be sure to state the hypotheses and the significance level, to obtain the expected frequencies, to compute the value of the
test statistic, to obtain the P–value, and to state your conclusion.
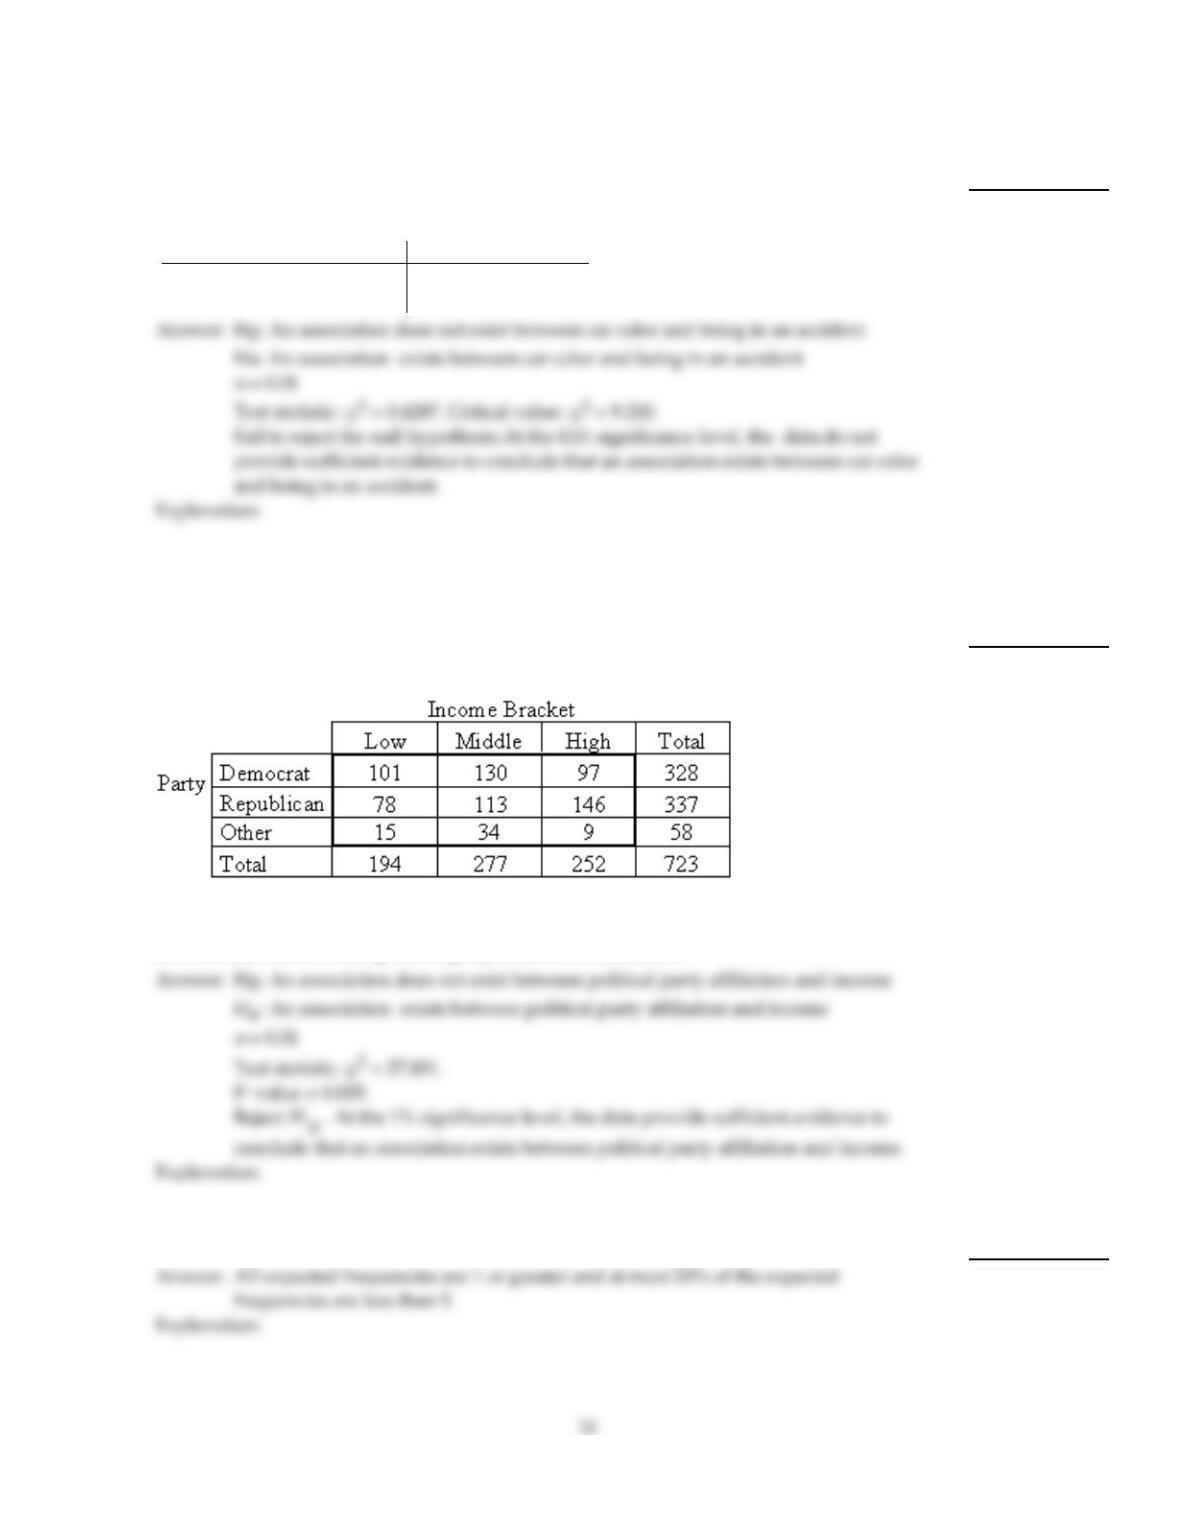
43)
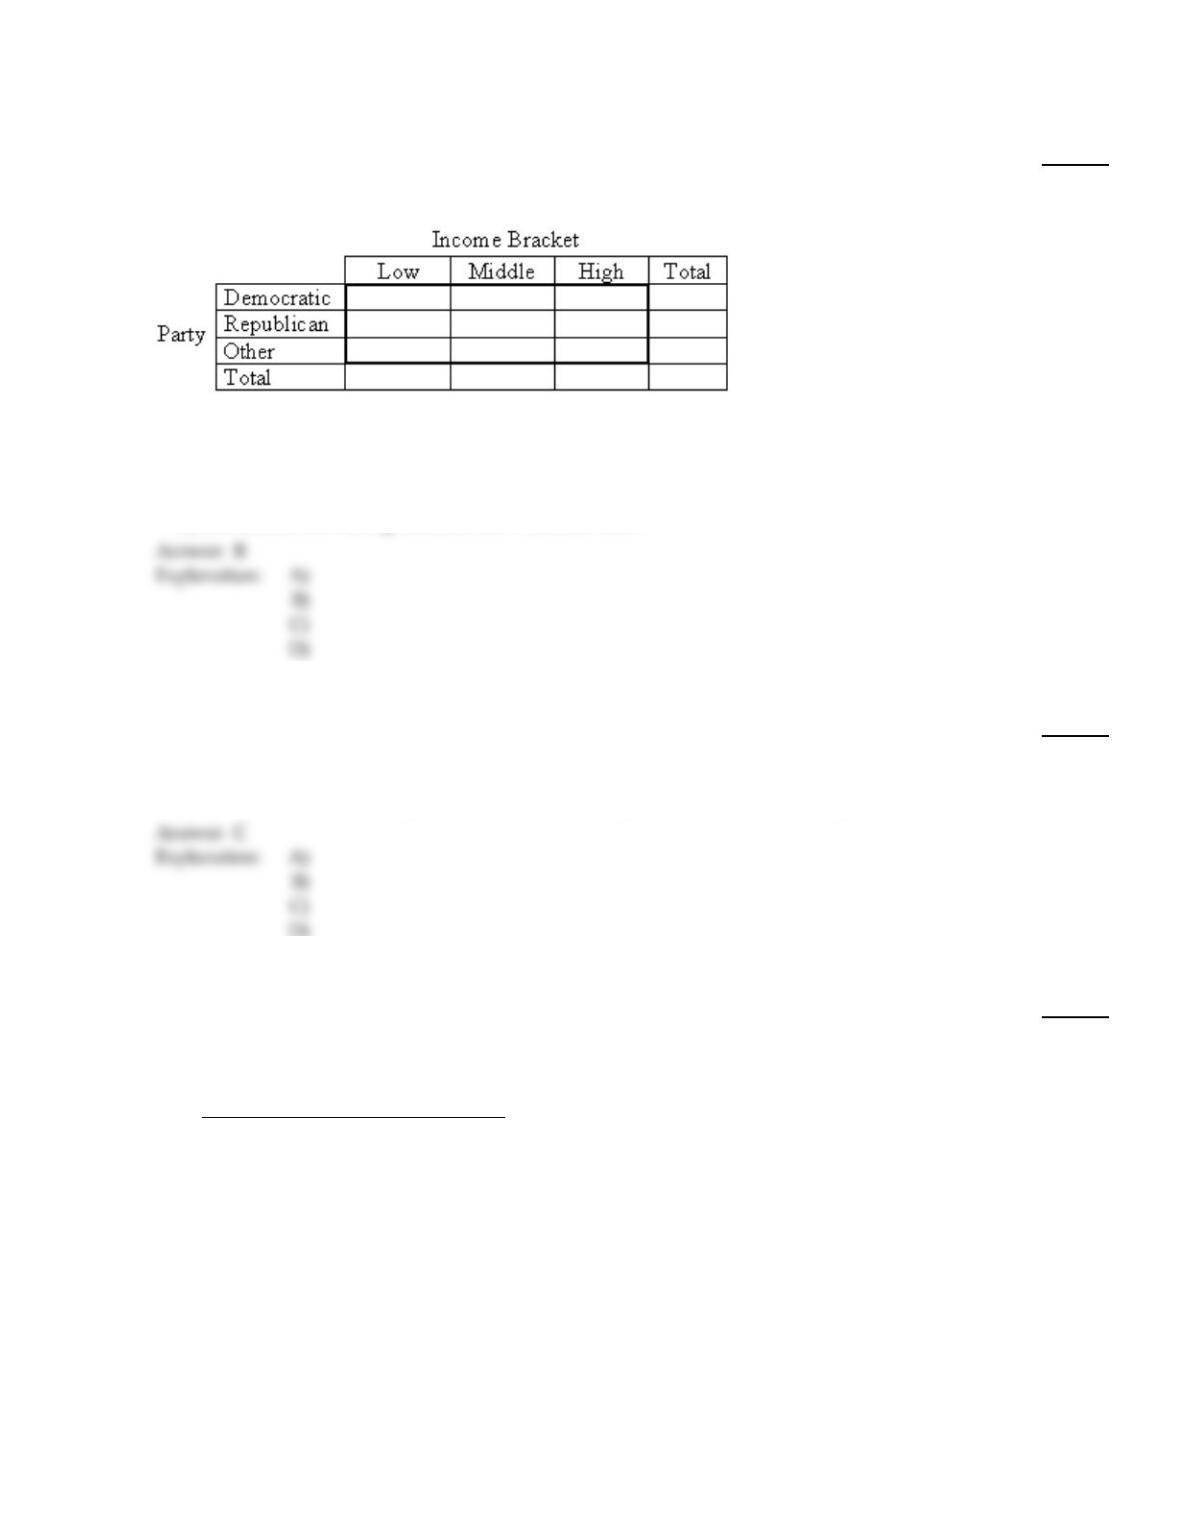
A researcher performed a study to determine whether an association exists between
political party affiliation and income. She obtained the following sample data.
At the 1% significance level, do the data provide sufficient evidence to conclude that an
association exists between political party affiliation and income?
43)
Provide an appropriate response.
44)
What assumptions are made when using a chi–square goodness–of–fit test?
44)
45)
Suppose that you wish to perform a chi–square test of independence. True or false, if the
two variables are not associated, then the test statistic 2=(O – E)2
Ehas approximately a
chi–square distribution with rc – 1 degrees of freedom, where r and c are the number of
possible values for the two variables under consideration?
If the statement is false, explain why.
45)
Perform the indicated goodness–of–fit test. Be sure to state the hypotheses and the significance level, to obtain the critical
value, to compute the value of the test statistic, and to state your conclusion.
46)
In studying the responses to a multiple–choice test question, the following sample data
were obtained. At the 0.05 significance level, test the claim that all five responses occur
with the same frequency.
Response A B C D E
Frequency 12 15 16 18 19
46)
Perform a chi–square independence test using the P–value approach, provided the conditions for using the test are met.
Be sure to state the hypotheses and the significance level, to obtain the expected frequencies, to compute the value of the
test statistic, to obtain the P–value, and to state your conclusion.
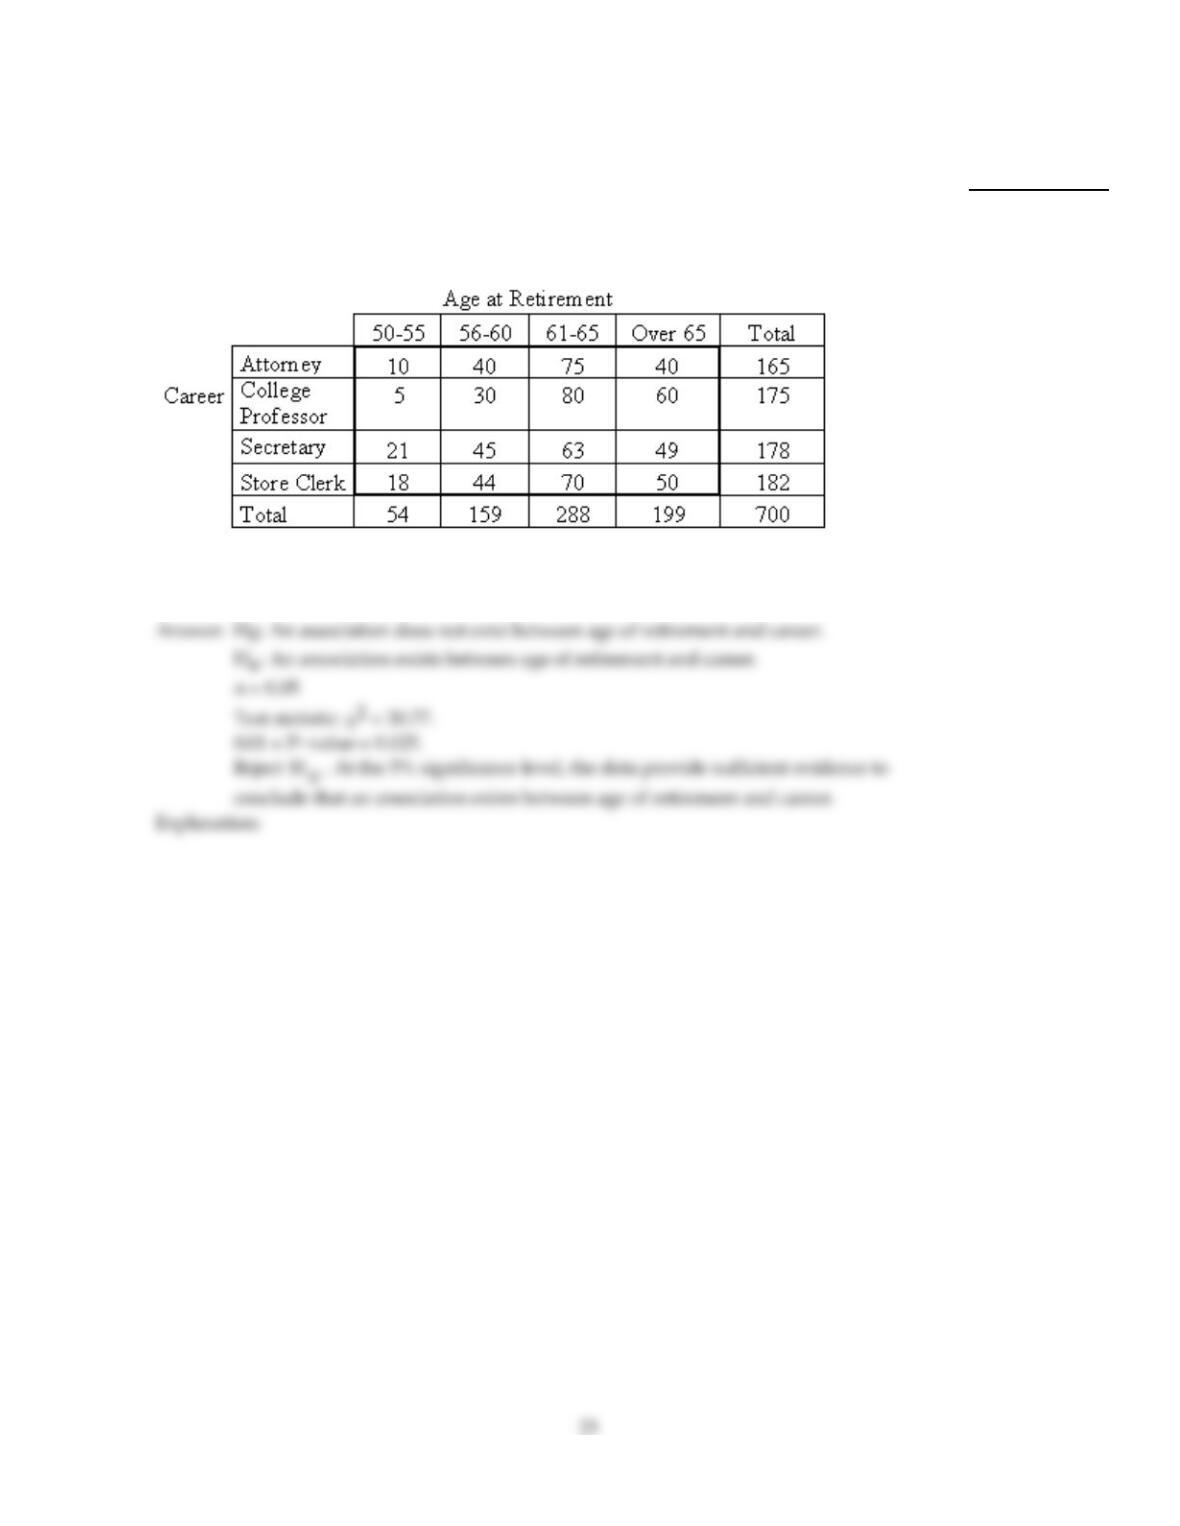
47)
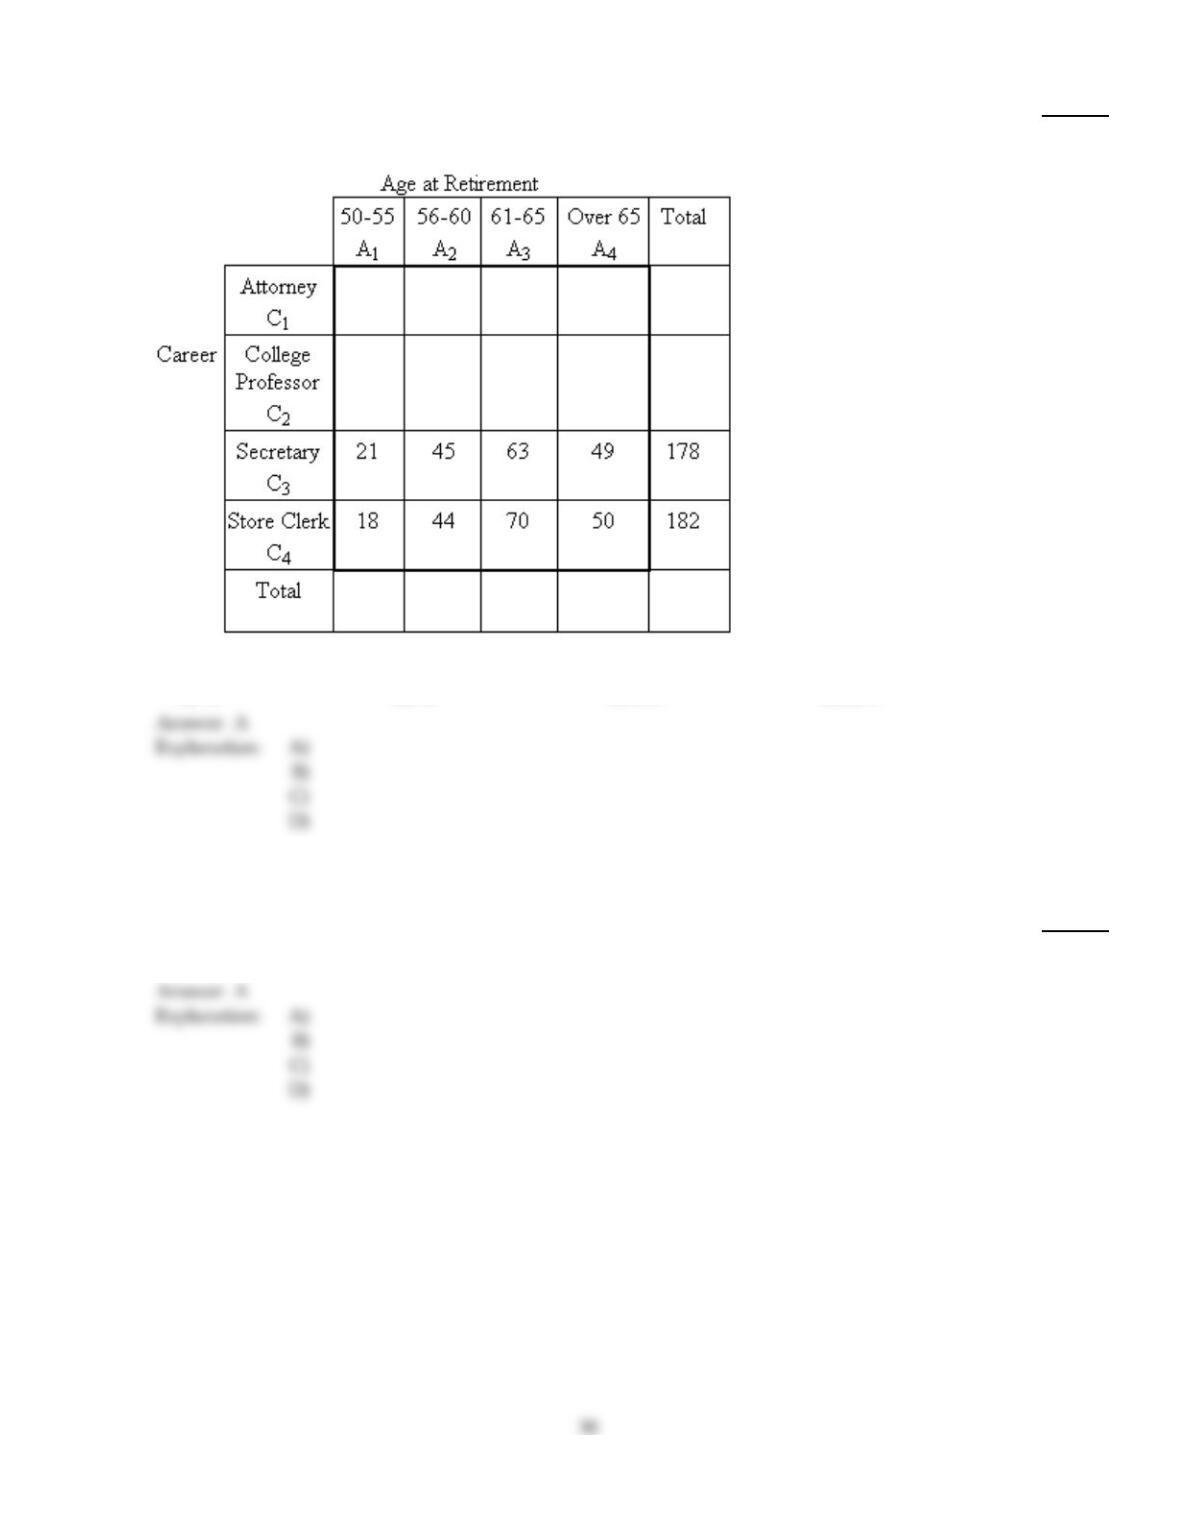
Research is conducted regarding the average age at retirement for four career groups. To
test whether there is a relationship between age of retirement and career in these groups,
700 employees, recently retired, are randomly selected. The resulting data are displayed in
the contingency table below.
At the 5% significance level, do the data provide sufficient evidence to conclude that an
association exists between age of retirement and career?
47)
Perform the indicated goodness–of–fit test using the P–value method. Be sure to state the hypotheses and the significance
level , to compute the value of the test statistic, to obtain the P–value, and to state your conclusion.
48)
The U.S. Department of Defense provides data on the distribution of military personnel on
active duty by branch of service. Below is a table giving the percentage distribution for
1985.
Branch of Service Percentage
Army 36.3
Navy 26.5
Marine Corps 9.2
Air Force 28.0
A random sample of 325 military personnel currently on active duty gave the following
statistics.
Branch of Service Frequency
Army 102
Navy 101
Marine Corps 40
Air Force 82
At the 5% significance level, do the data provide evidence that the current distribution of
military personnel on active duty differs from the 1985 distribution?
48)
Provide an appropriate response.
49)
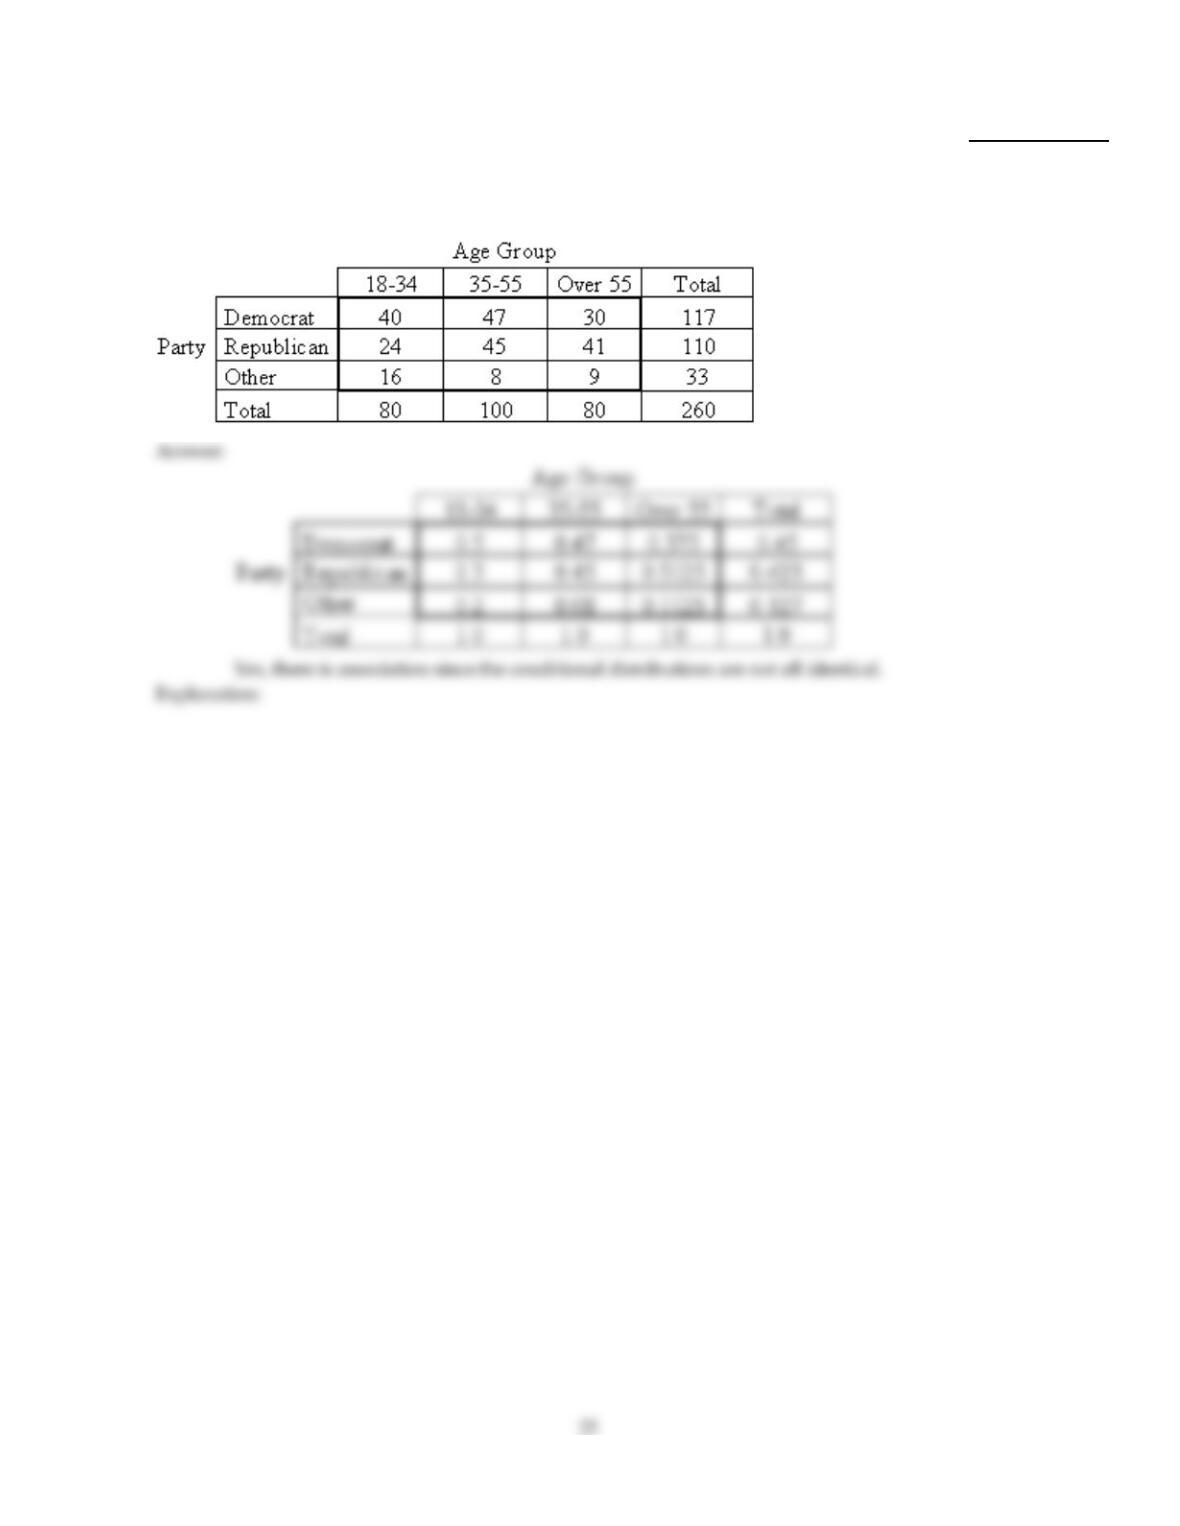
The contingency table below shows political party affiliation cross classified by age group
for a certain population. Obtain the conditional distribution of political party affiliation
within each age group and the marginal distribution of political party affiliation. Is there
association between the two variables? How can you tell?
49)
Perform the indicated goodness–of–fit test using the P–value method. Be sure to state the hypotheses and the significance
level , to compute the value of the test statistic, to obtain the P–value, and to state your conclusion.
50)
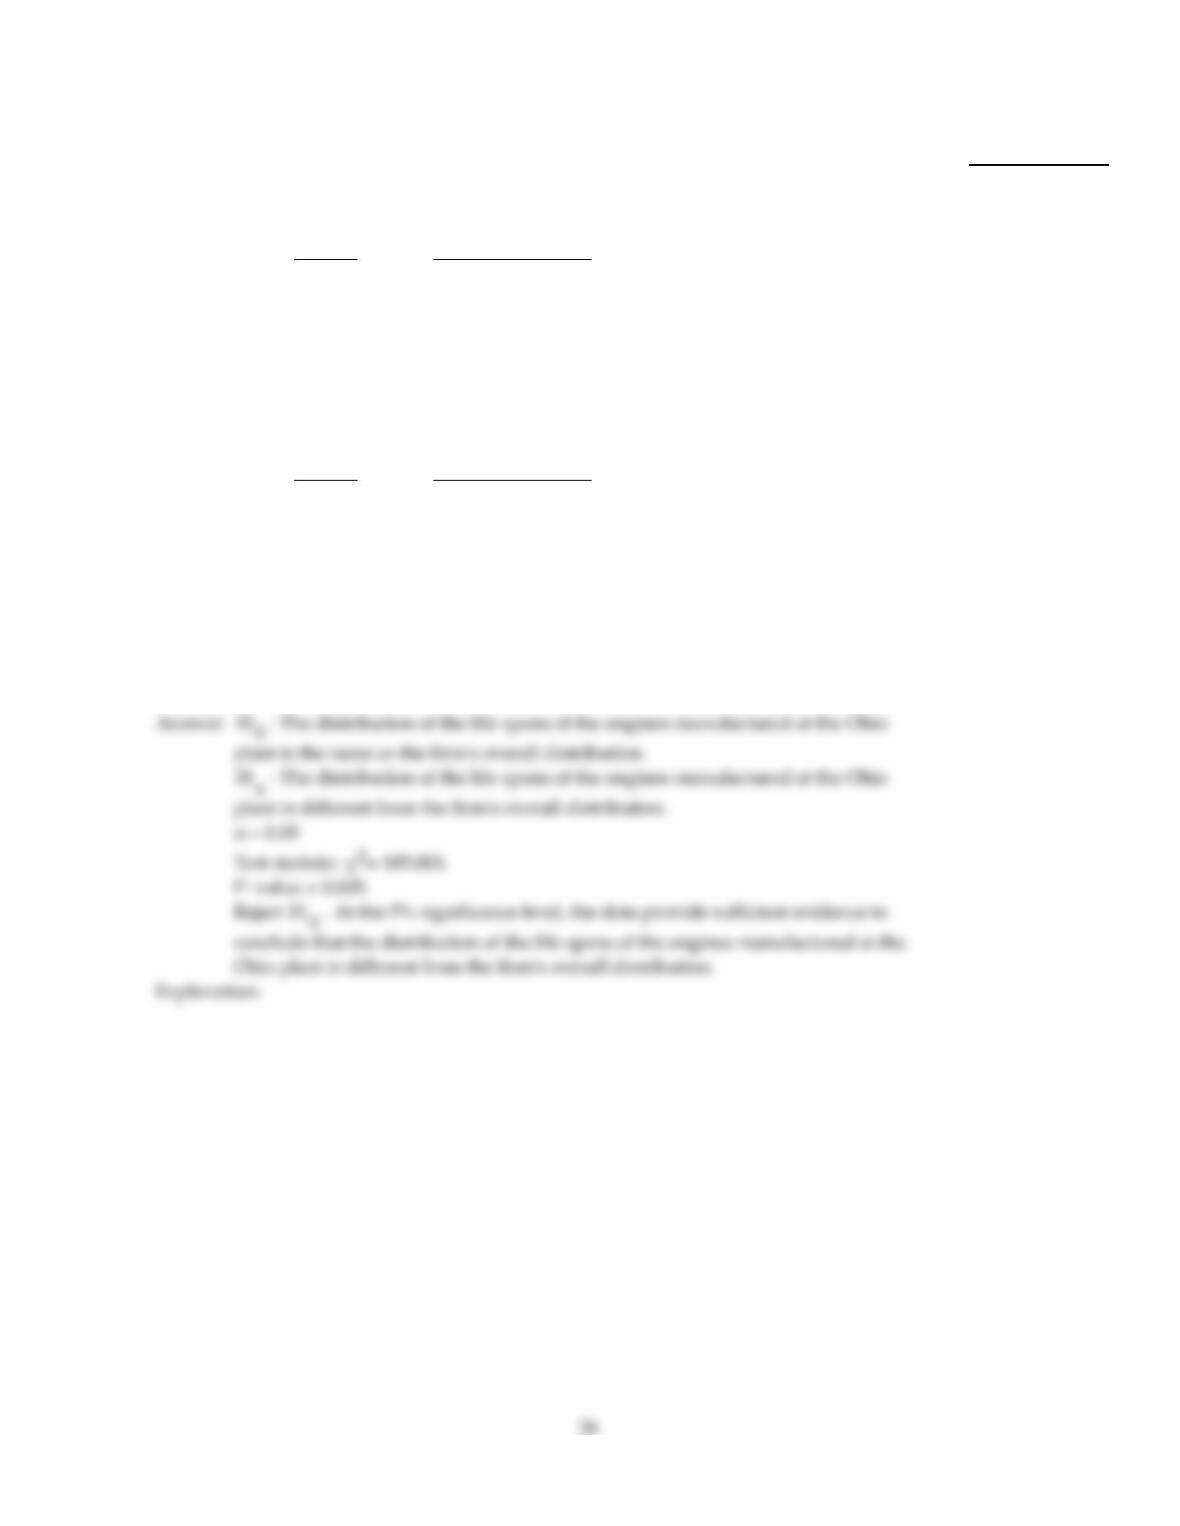
A firm that manufactures engines for racing boats gathers data from all of its plants. The
table below gives the distribution of the life span of the engines (in numbers of months) for
the entire firm.
Months Relative Frequency
Under 60 0.017
70–79 0.201
80–89 0.353
90–99 0.331
100–109 0.098
A random sample of 448 engines from the firm‘s Ohio plant gives the following results.
Months Number of engines
Under 60 22
70–79 131
80–89 46
90–99 154
100–109 95
At the 5% significance level, do the data provide evidence that the distribution of the life
spans of the engines manufactured at the Ohio plant is different from the firm’s overall
distribution?
50)
Perform the indicated goodness–of–fit test. Be sure to state the hypotheses and the significance level, to obtain the critical
value, to compute the value of the test statistic, and to state your conclusion.
51)
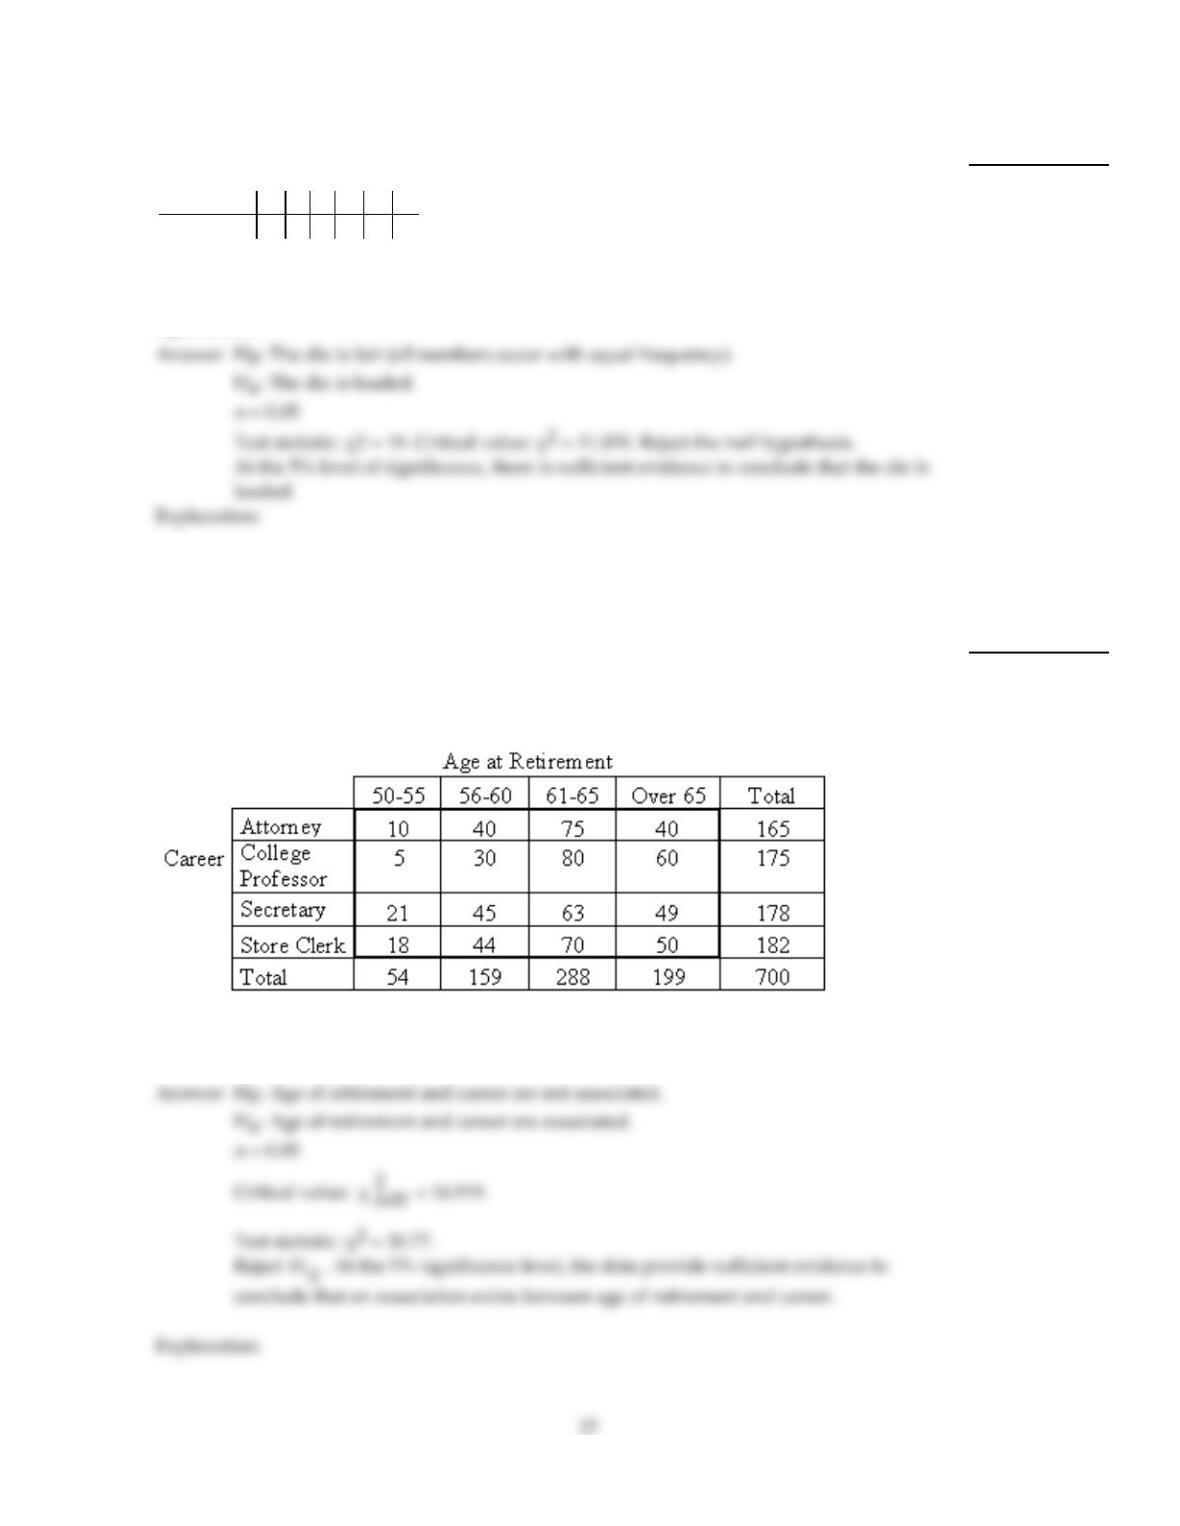
You roll a die 48 times with the following results.
Number 1 2 3 4 5 6
Frequency 13 2 3 13 13 4
Do the data provide sufficient evidence to conclude that the die is loaded (i.e., that the six
numbers are not equally likely)? Perform the hypothesis test at the 0.05 level of
significance.
51)
Perform a chi–square independence test using the critical value approach, provided the conditions for using the test are
met. Be sure to state the hypotheses and the significance level, to obtain the expected frequencies, to obtain the critical
value, to compute the value of the test statistic, and to state your conclusion.
52)
Research is conducted regarding the average age at retirement for four career groups. To
test whether there is a relationship between age of retirement and career in these groups,
700 employees, recently retired, are randomly selected. The resulting data are displayed in
the contingency table below.
At the 5% significance level, do the data provide sufficient evidence to conclude that an
association exists between age of retirement and career?
52)
Provide an appropriate response.
53)
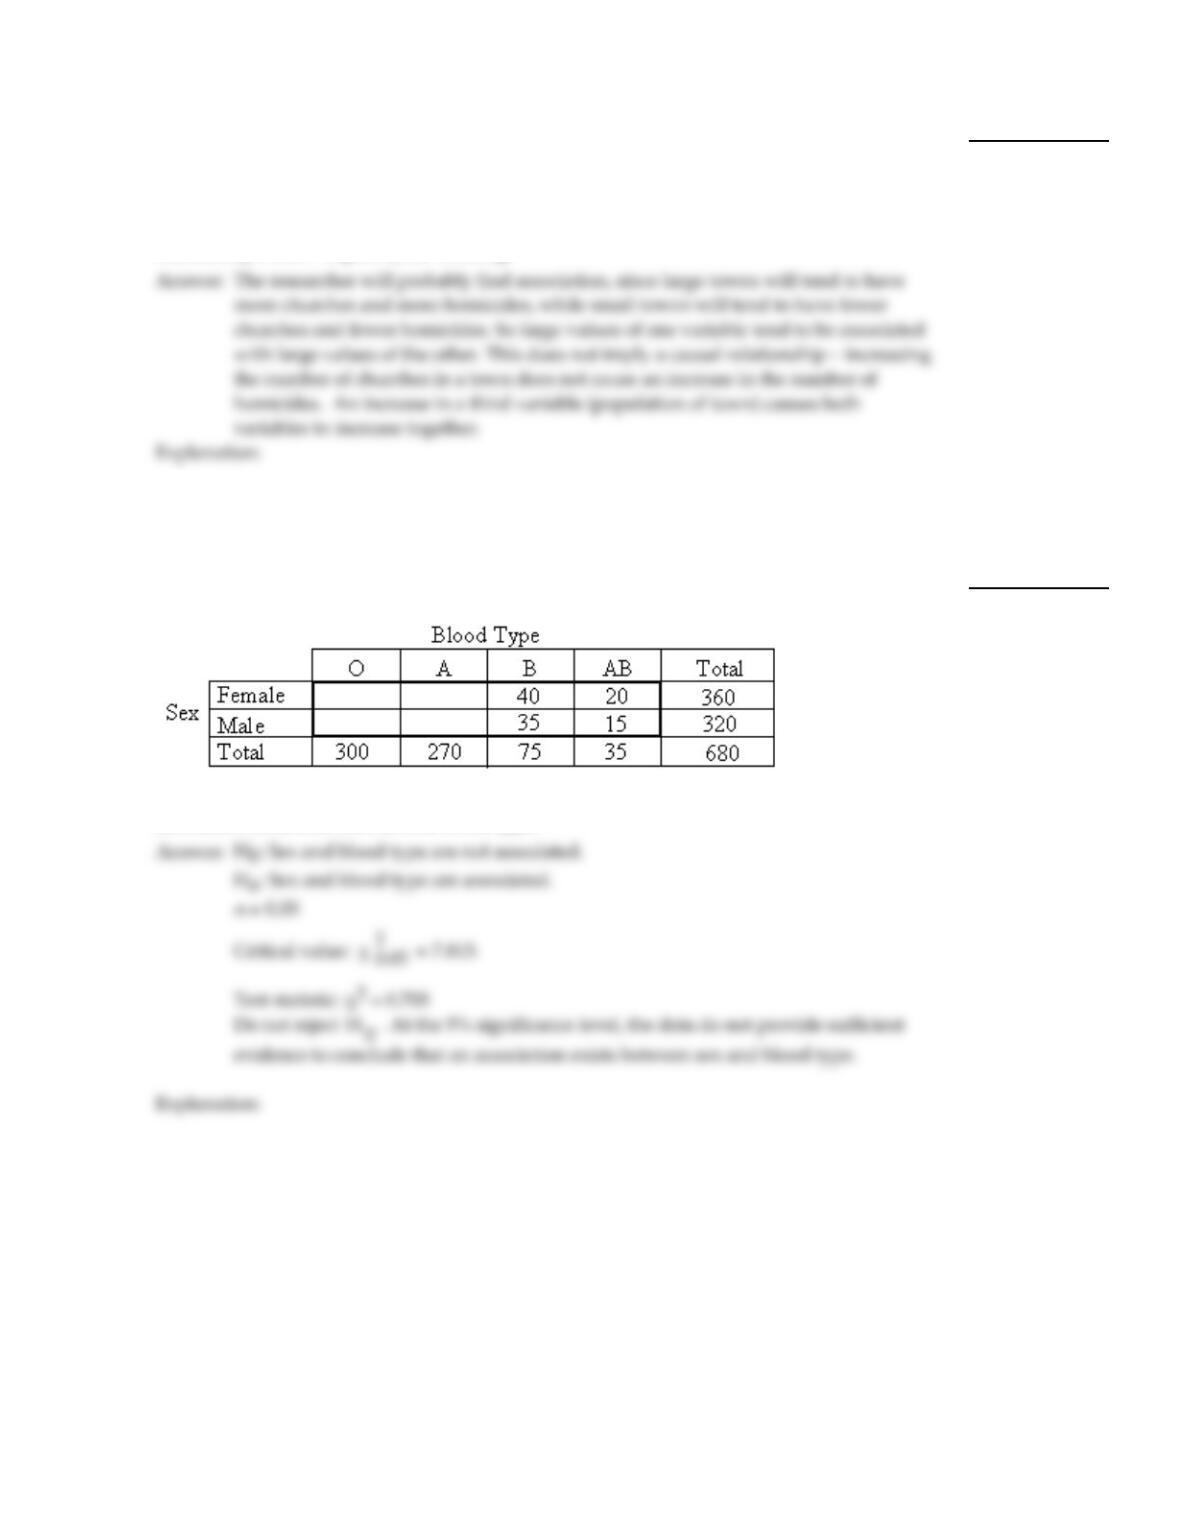
A researcher records for each of 500 randomly selected towns, the number of churches in
the town and the number of homicides in the town in the past ten years. The towns range
in size from a population of 1000 to a population of 1,000,000. He then performs a
chi–square test of independence for these two variables. Would you expect that he would
find association between the two variables? If so, should he conclude that a causal
relationship exists? Explain your thinking.
53)
Perform a chi–square independence test using the critical value approach, provided the conditions for using the test are
met. Be sure to state the hypotheses and the significance level, to obtain the expected frequencies, to obtain the critical
value, to compute the value of the test statistic, and to state your conclusion.
54)
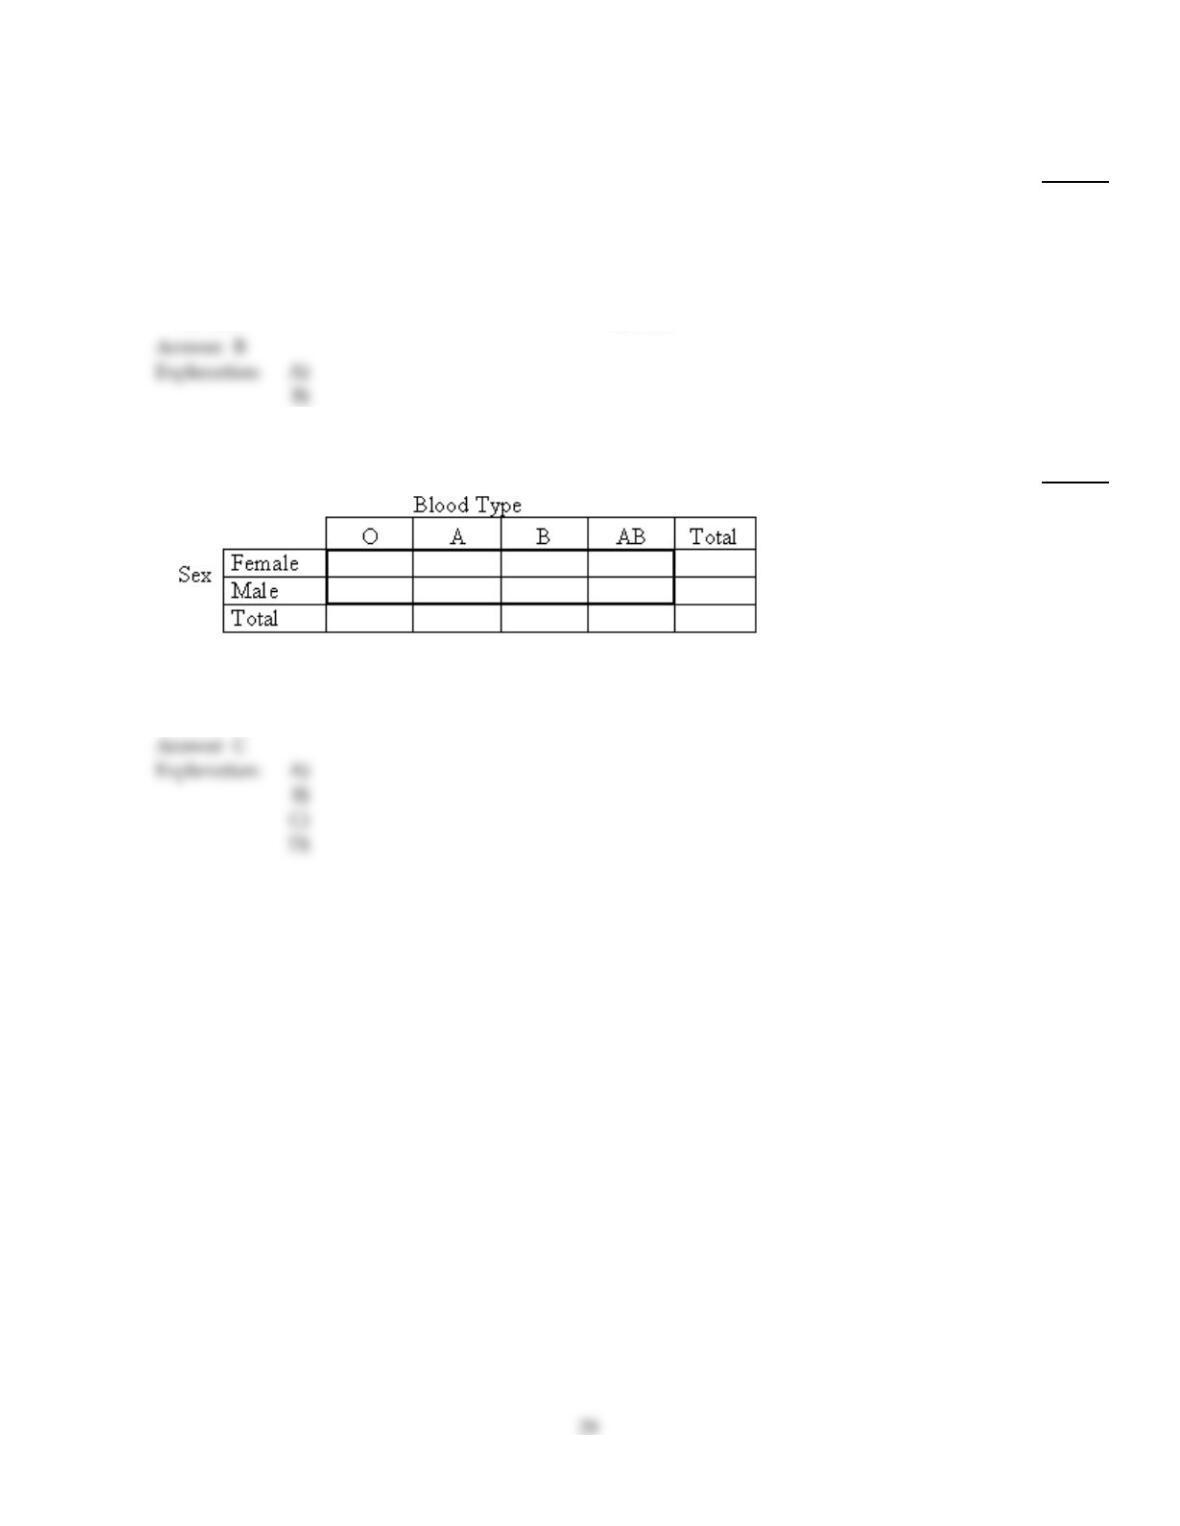
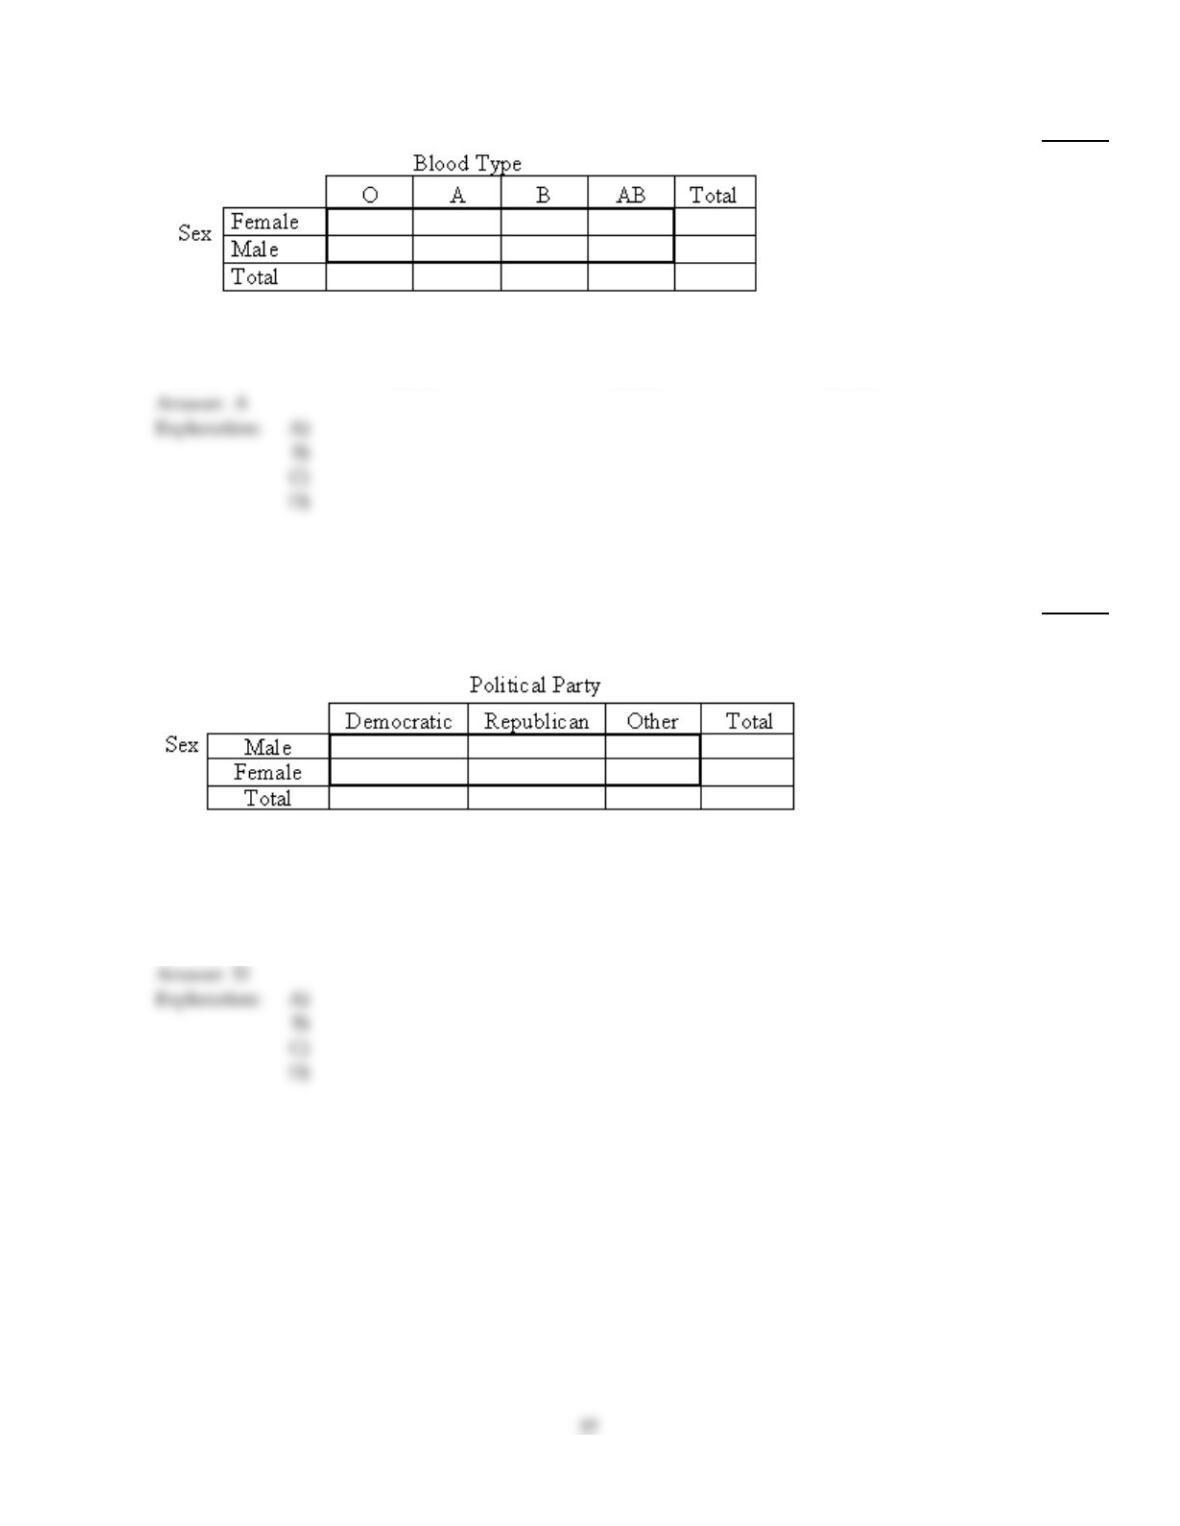
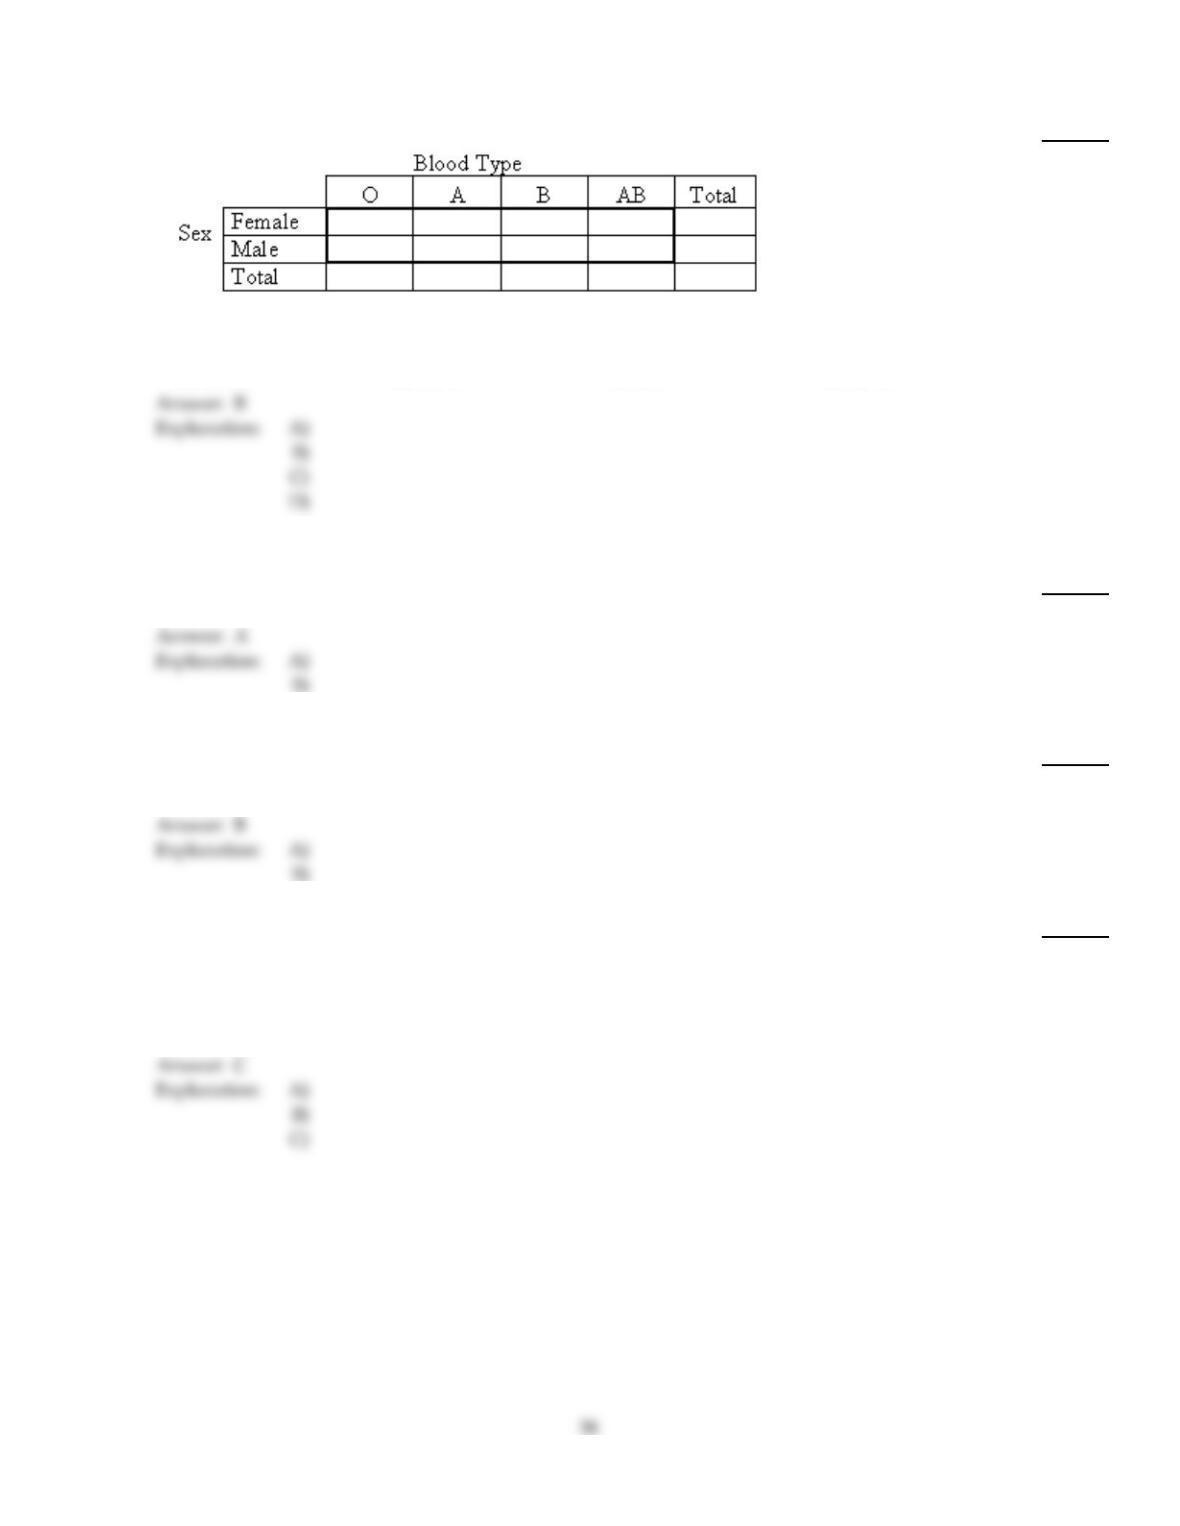
A researcher performed a study to determine whether an association exists between sex
and blood type. He obtained the following sample data.
154 146
146 124
At the 5% significance level, do the data provide sufficient evidence to conclude that an
association exists between sex and blood type?
54)
28
MULTIPLE CHOICE. Choose the one alternative that best completes the statement or answers the question.
Provide an appropriate response.
55)
A chi–square goodness–of–fit test is to be performed. The relative frequencies for the null
hypothesis and the sample size are given. True or false, the assumptions for using a chi–square
goodness–of–fit test are satisfied?
Sample size: n =90
Relative frequencies: 0.18 , 0.01, 0.3, 0.13, 0.38
55)
A)
True
B)
False
Use the contingency table to solve the problem.
56)
52 49 15 5121
48 42 10 4104
100 91 25 9225
The contingency table above shows the blood types of a sample of patients cross classified by sex.
How many of the people in the sample are either women or have blood type AB?
56)
A)
121
B)
130
C)
125
D)
5
57)
The following contingency table provides a joint frequency distribution for a group of retired
people by career and age at retirement.
940 71 41 161
10 47 70 47 174
58 176 274 187 695
How many of the people who retired between 61 and 65 were attorneys?
57)
A)
71
B)
70
C)
161
D)
274
Find the required 2–value.
58)
For a 2–curve with 24 degrees of freedom, find 2
0.95 .
58)
A)
13.848
B)
13.091
C)
36.415
D)
12.401
Find the specified conditional or marginal distribution for the given contingency table. Round to the nearest tenth of a
percent if needed.
59)
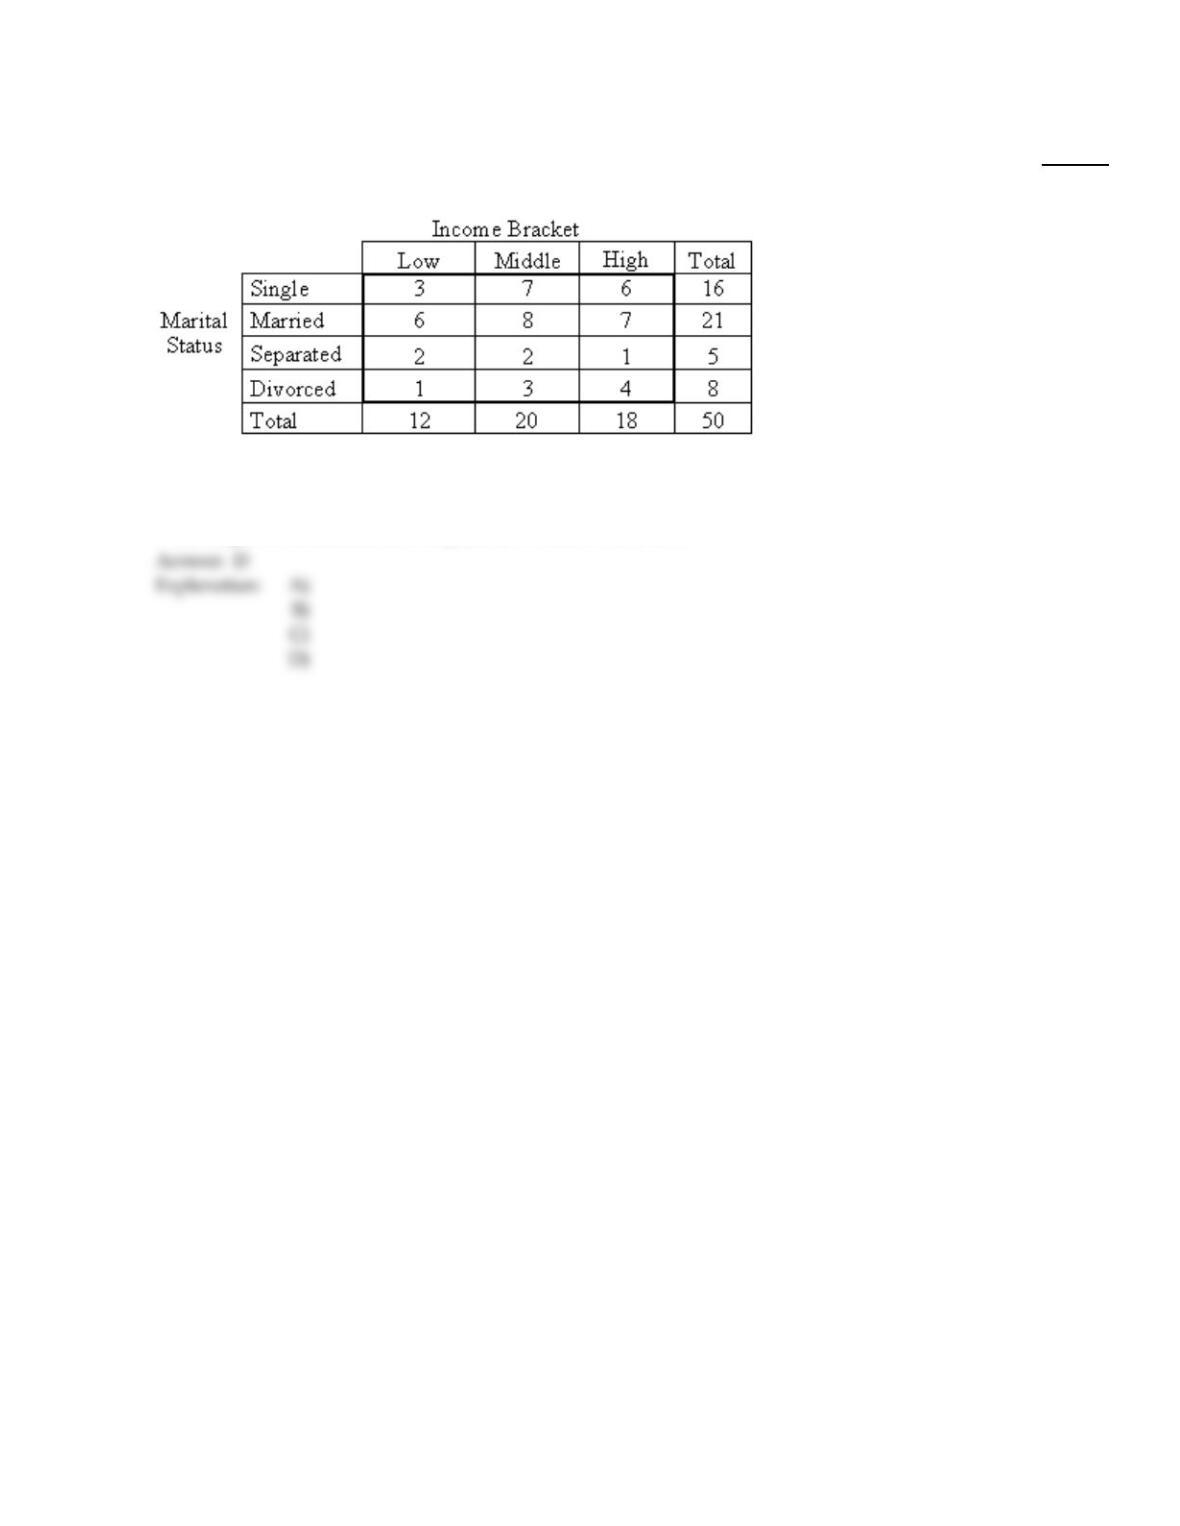
Use the given contingency table to find the conditional distribution of the
variable “marital status” for middle–income people.
59)
A)
Single: 25%; Married: 50%; Separated: 16.7%; Divorced: 8.3%
B)
Single: 32%; Married: 42%; Separated: 10%; Divorced: 16%
C)
Single: 43.8%; Married: 38.1%; Separated: 40%; Divorced: 37.5%
D)
Single: 35%; Married: 40%; Separated: 10%; Divorced: 15%
31
Use the contingency table to solve the problem.
60)
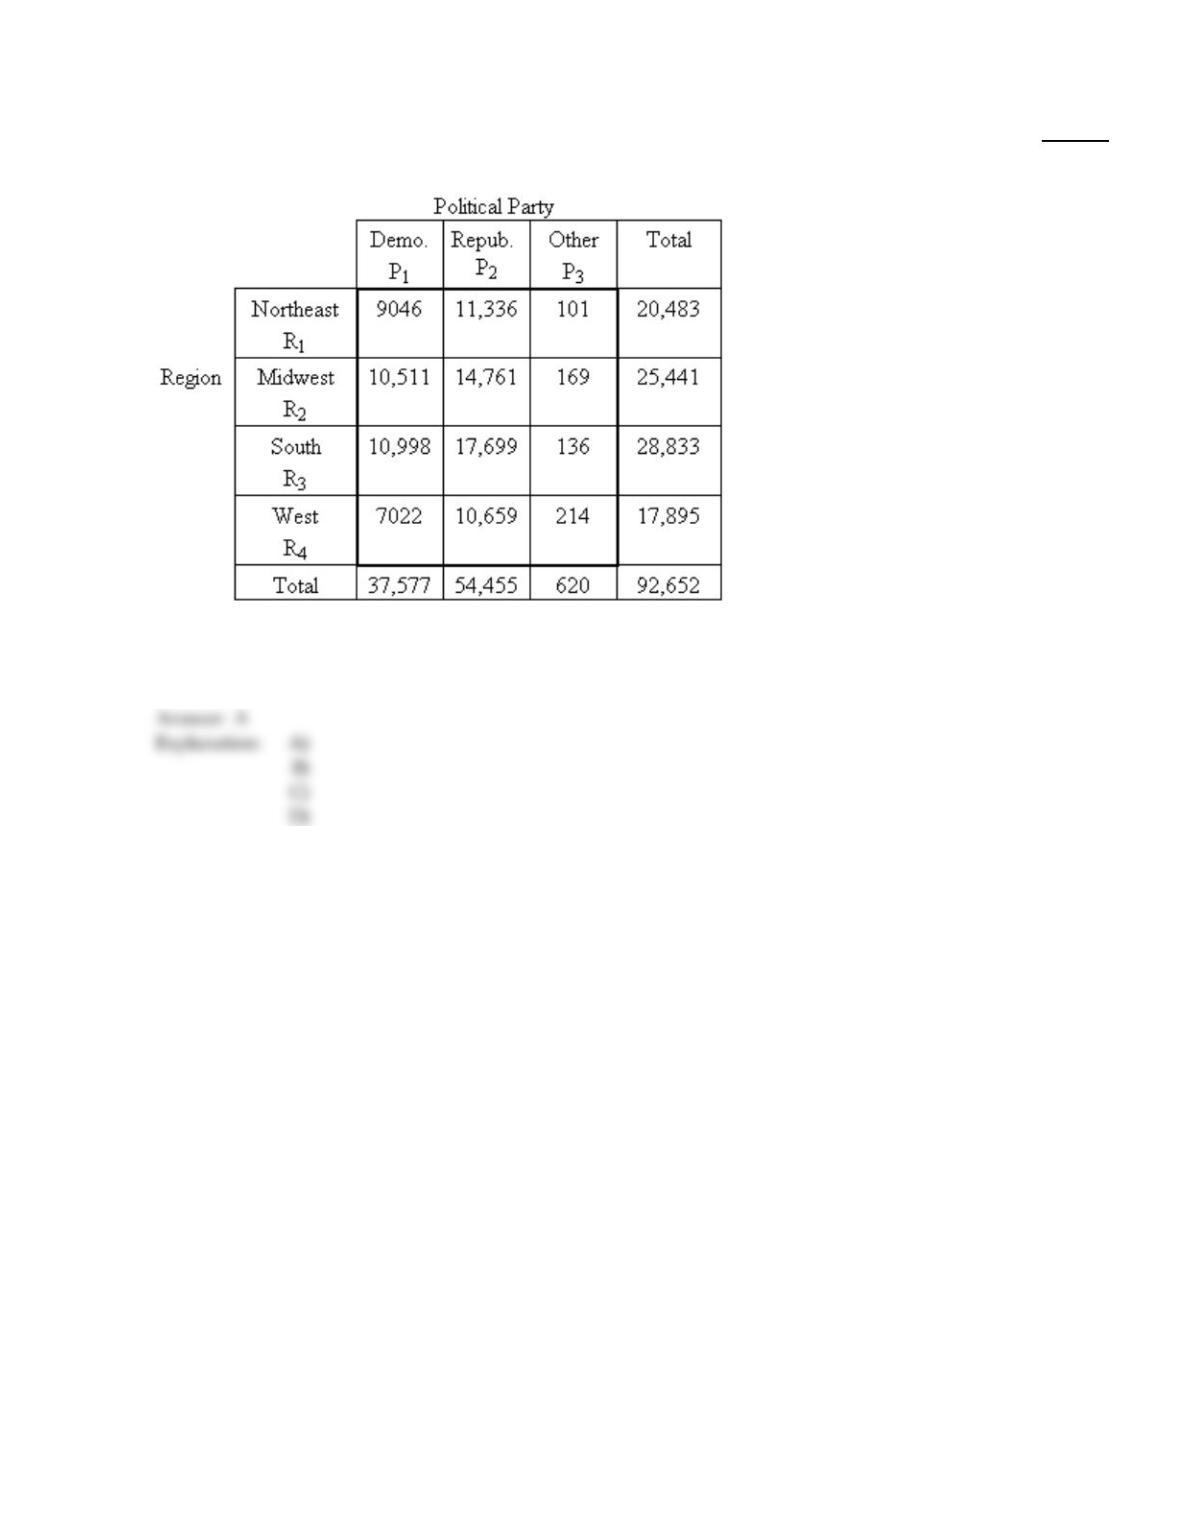
The following contingency table shows the popular votes cast in the 1984 presidential election cross
classified by region and political party. Data are in thousands, rounded to the nearest thousand.
What percentage of the people voted Democrat?
60)
A)
40.6%
B)
24.1%
C)
9.8%
D)
44.2%
Group the bivariate data into a contingency table.
32
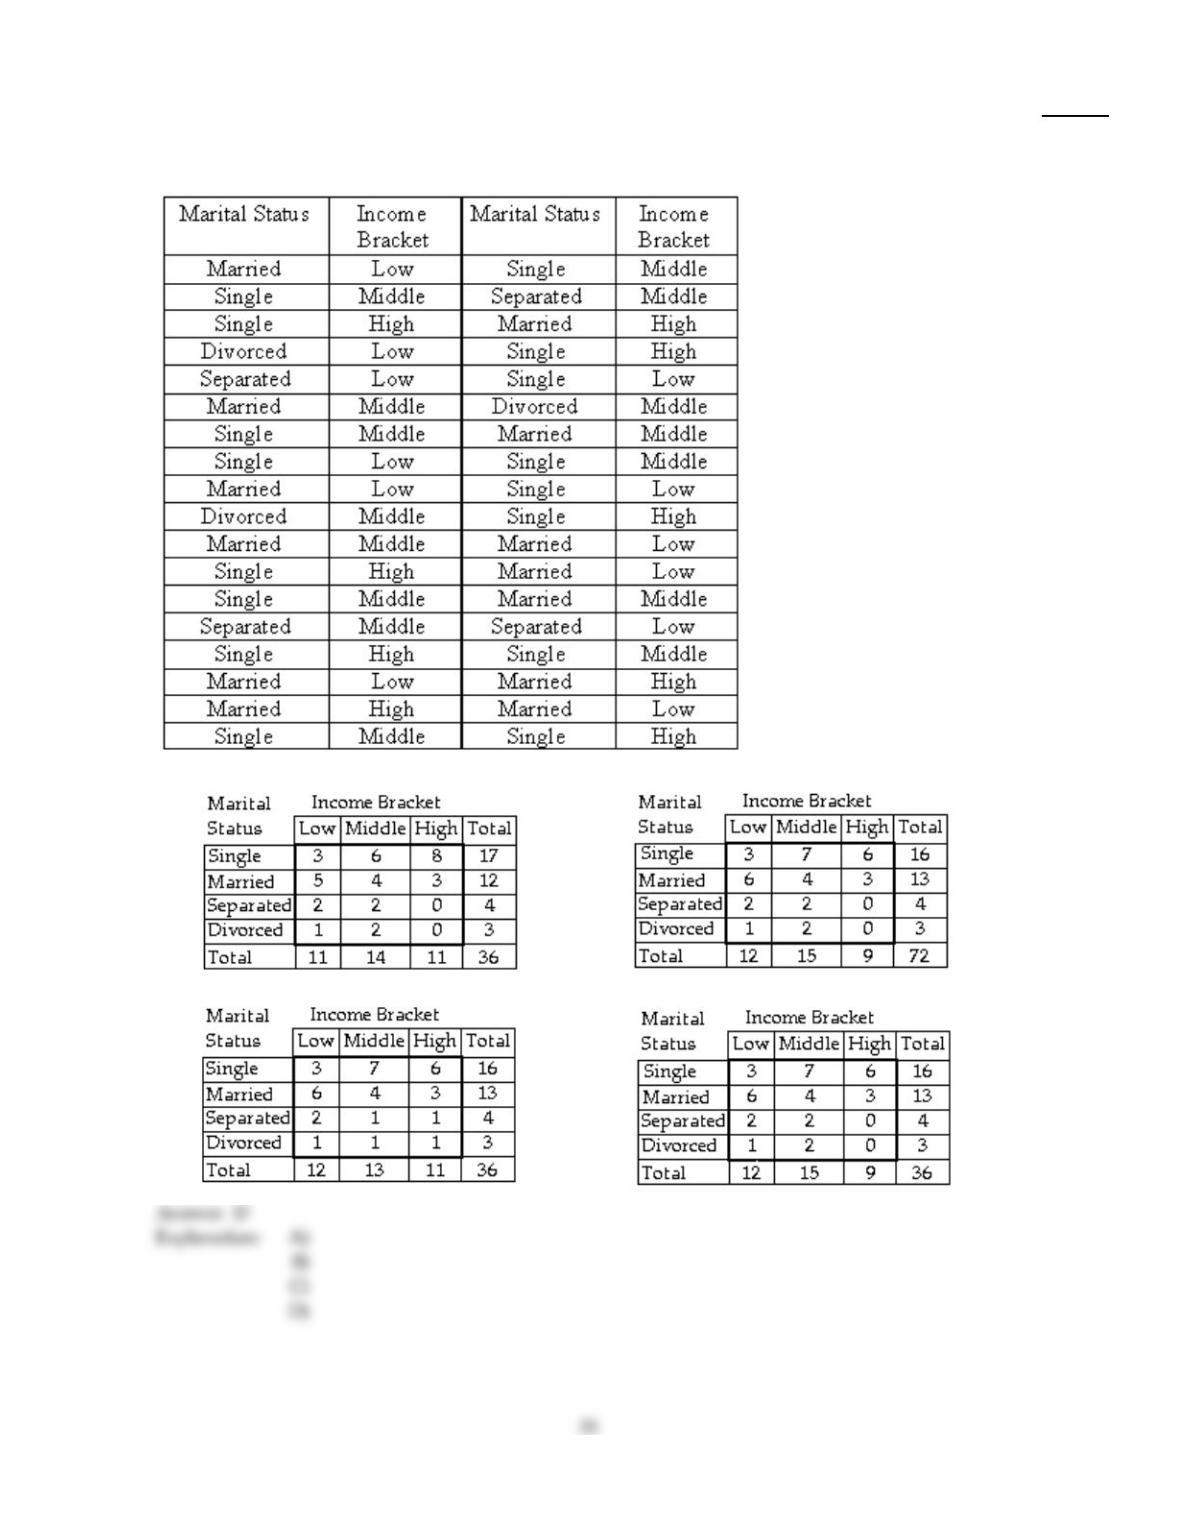
61)
The table below provides theoretical data on marital status and income bracket for a random
sample of adults aged between 20 and 30. Group the bivariate data for the two variables into a
contingency table.
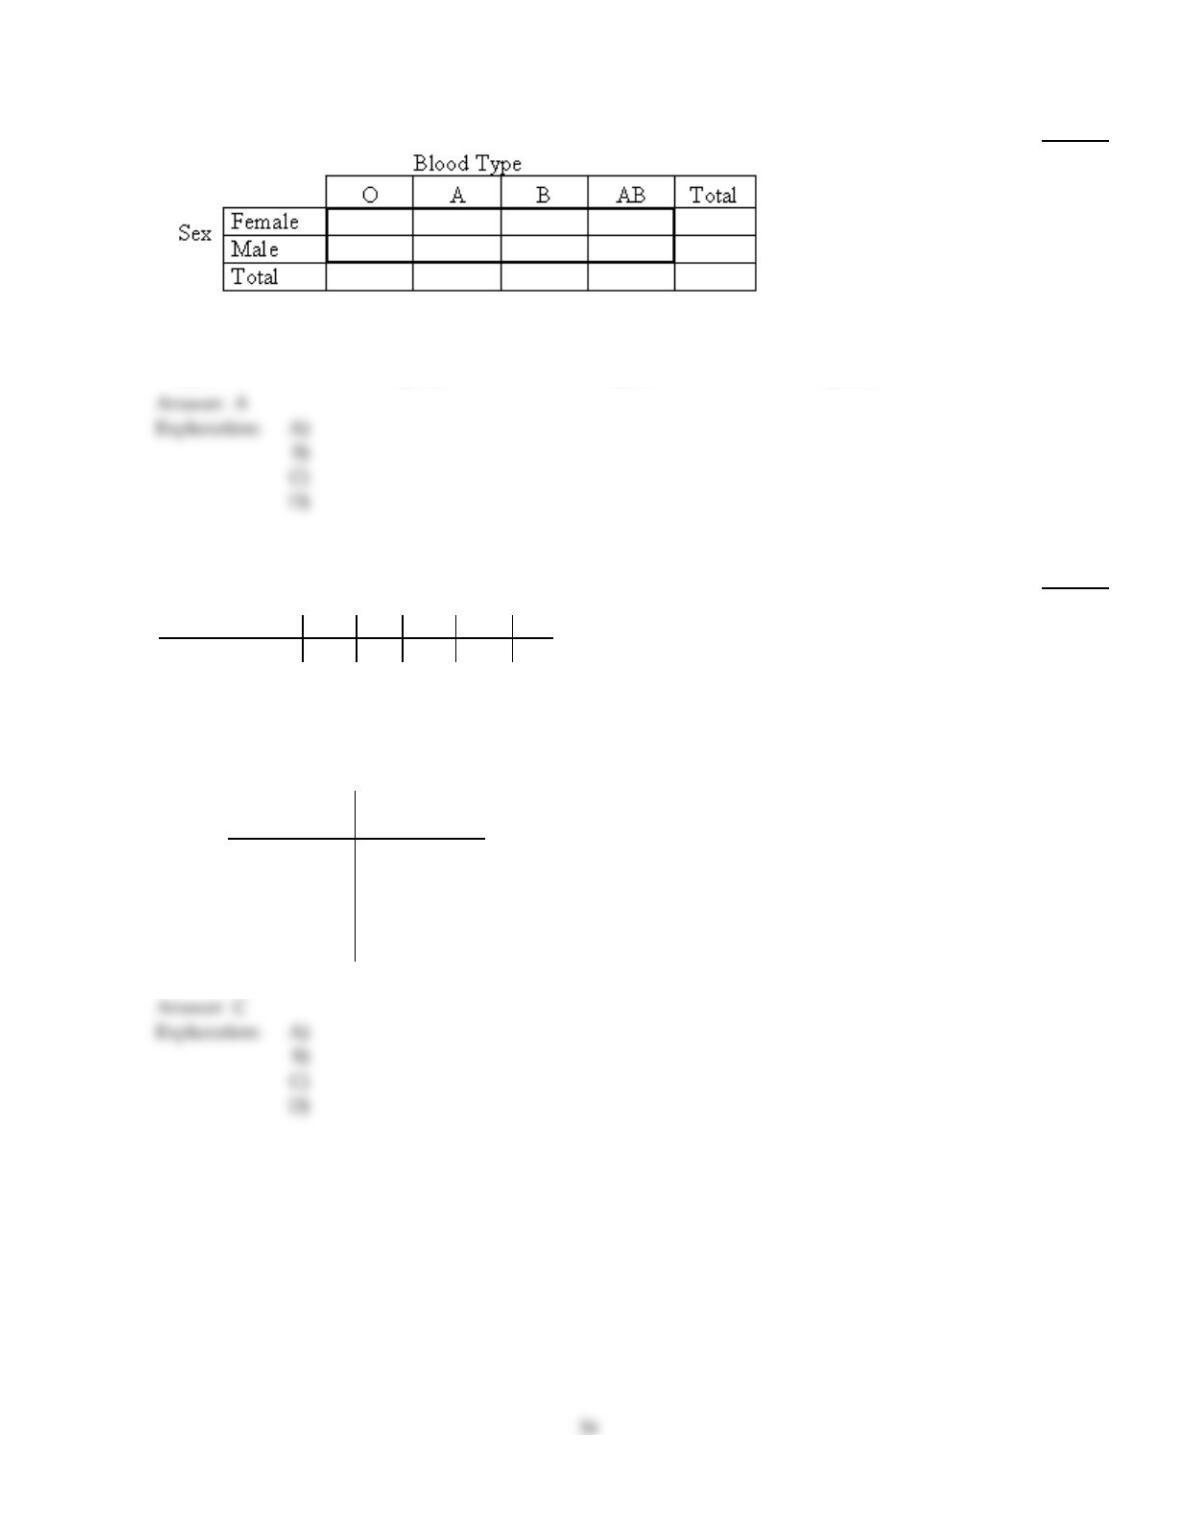
61)
A)
B)
C)
D)
Use the contingency table to solve the problem.
62)
51 42 13 5111
55 43 12 5115
106 85 25 10 226
The contingency table above shows the blood types of a sample of patients cross classified by sex.
How many of the men in the sample have blood type O?
62)
A)
55
B)
115
C)
51
D)
106
Find the value of the chi–square test statistic for the goodness–of–fit test.
63)
The following table is obtained from a random sample of 30 absences.
Day Mon Tue Wed Thur Fri
Number Absent 8 5 3 10 4
You wish to test the claim that the absences occur on the five days with equal frequency. What is the
value of the 2 test statistic? The observed frequencies and the expected frequencies are shown
below.
Observed
Frequency (O)
Expected
Frequency (E)
8 6
5 6
3 6
10 6
4 6
63)
A)
2=3.4
B)
2=8.5
C)
2=5.667
D)
2=4.25
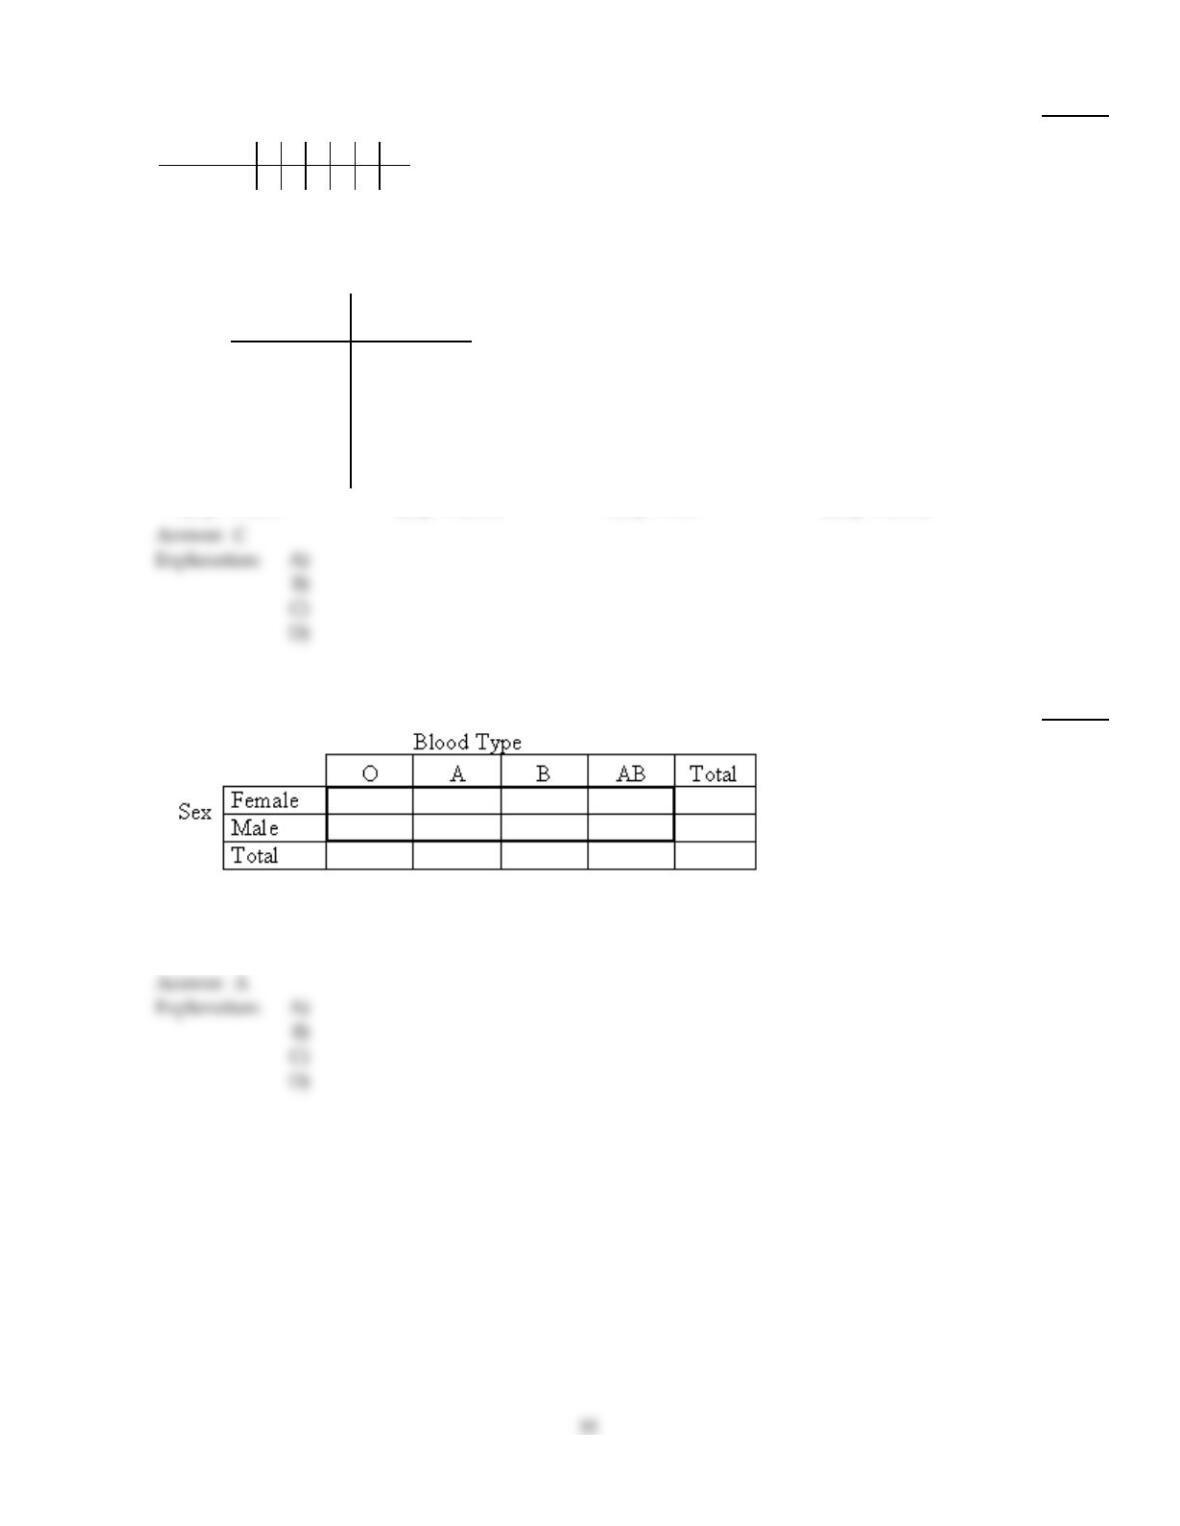
64)
You wish to test the claim that a die is fair. You roll it 48 times with the following results.
Number 1 2 3 4 5 6
Frequency 7 9 9 8 4 11
What is the value of the 2 test statistic? The observed frequencies and the expected frequencies are
shown below.
Observed
frequency (O)
Expected
frequency (E)
7 8
9 8
9 8
8 8
4 8
11 8
64)
A)
2=4.667
B)
2=2.154
C)
2=3.5
D)
2=2.545
Use the contingency table to solve the problem.
65)
44 43 15 7109
45 53 11 4113
89 96 26 11 222
The contingency table above shows the blood types of a sample of patients cross classified by sex.
How many men are in the sample?
65)
A)
113
B)
89
C)
222
D)
45
Find the specified conditional or marginal distribution for the given contingency table. Round to the nearest tenth of a
percent if needed.
66)
The contingency table below shows the income level for a random sample of adults cross classified
by sex.
26 28 862
22 24 551
48 52 13 113
Find the conditional distribution of the variable “sex” for the middle–income people.
66)
A)
Male: 45.2% ; Female: 47.1%
B)
Male: 53.8% ; Female: 46.2%
C)
Low: 42.5% ; Middle: 46% ; High: 11.5%
D)
Male: 54.9% ; Female: 45.1%
Provide an appropriate response.
67)
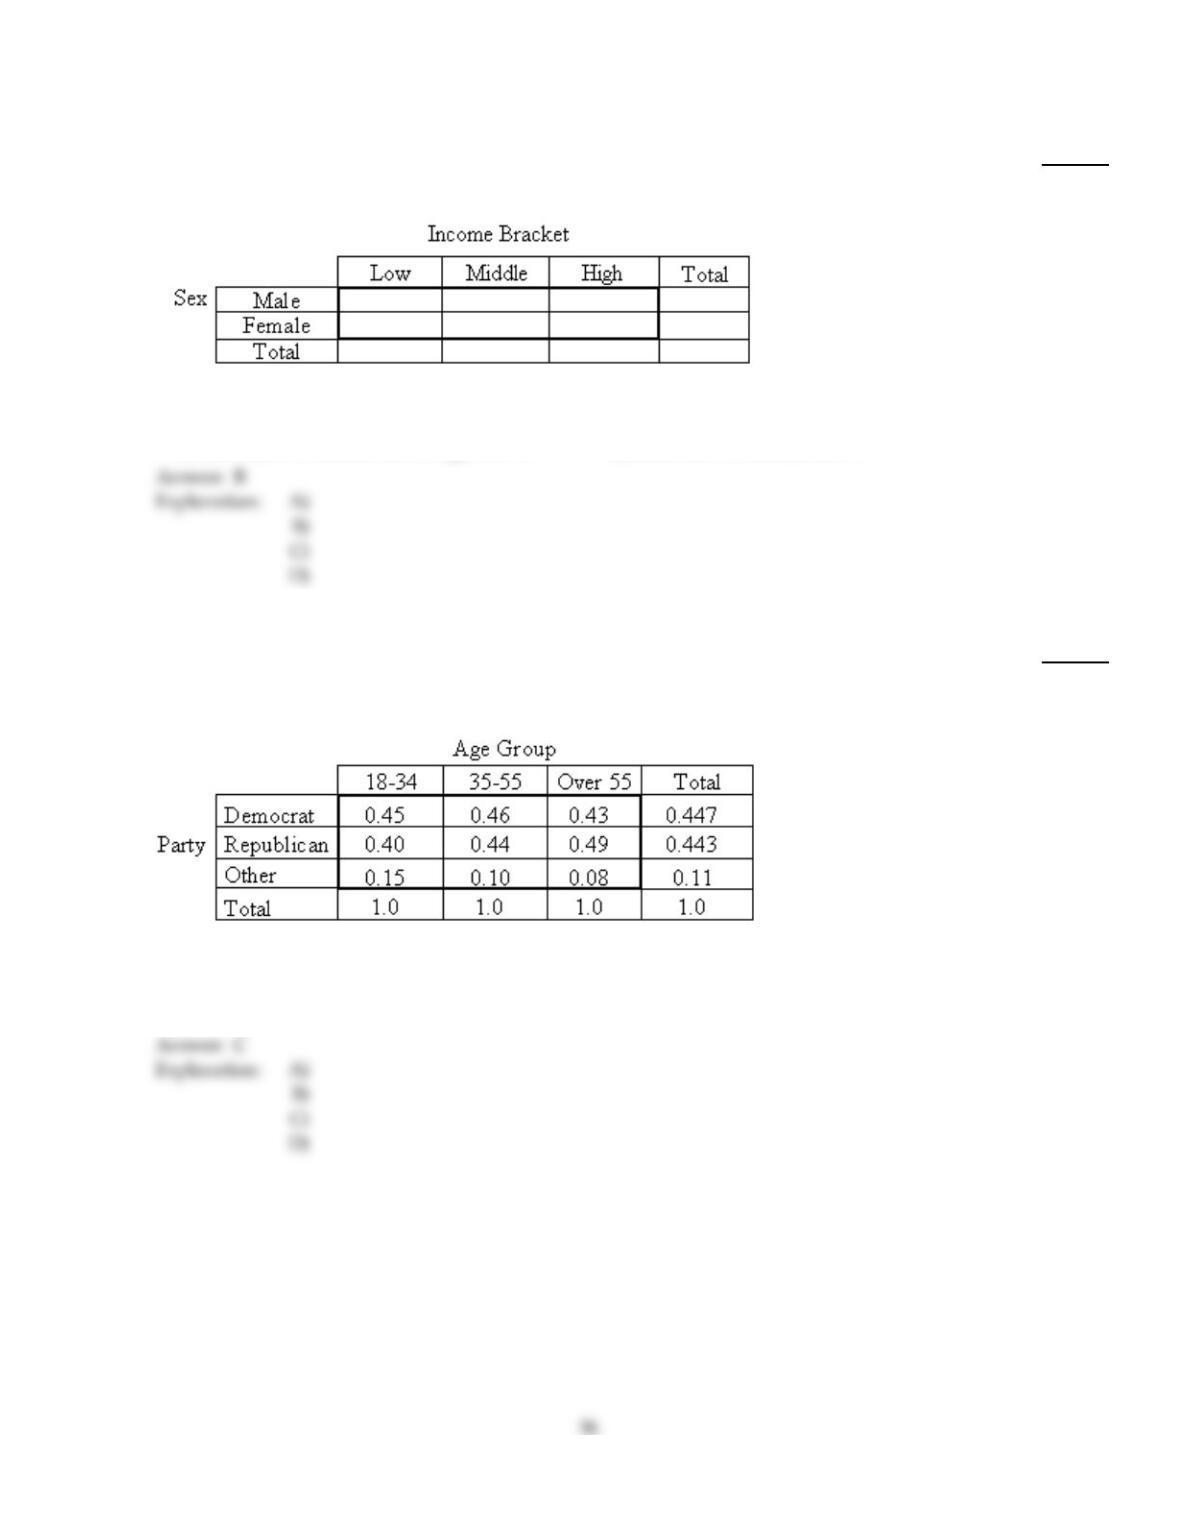
The table below shows the conditional distributions of the variable political party affiliation
corresponding to each age group for a certain population. What information is given by the
number 0.43?
67)
A)
43% of the population are Democrats over the age of 55.
B)
43% of Democrats are over 55.
C)
43% of those aged over 55 are Democrats.
D)
43% of the population are Democrats.
Use the contingency table to solve the problem.
68)
49 40 13 7109
44 50 11 5110
93 90 24 12 219
The contingency table above shows the blood types of a sample of patients cross classified by sex.
How many of the men in the sample do not have blood type O?
68)
A)
66
B)
44
C)
200
D)
110
Find the specified conditional or marginal distribution for the given contingency table. Round to the nearest tenth of a
percent if needed.
69)
During a poll, 87 people were randomly selected and asked their political party affiliation. The
contingency table below shows the results cross classified by political party affiliation and sex.
15 25 11 51
11 11 14 36
26 36 25 87
Find the conditional distribution of the variable “sex” for Democrats.
69)
A)
Male: 29.4% ; Female: 30.6%
B)
Democrats: 29.9% ; Republicans: 41.4% ; Other: 28.7%
C)
Male: 58.6% ; Female: 41.4%
D)
Male: 57.7% ; Female: 42.3%
Use the contingency table to solve the problem.
70)
49 42 11 6108
48 50 16 5119
97 92 27 11 227
The contingency table above shows the blood types of a sample of people cross classified by sex.
What percentage of those people with blood type A are women?
70)
A)
47.6%
B)
45.7%
C)
42%
D)
38.9%
Provide an appropriate response.
71)
True or false, the total area under a 2–curve is equal to 1?
71)
A)
True
B)
False
72)
True or false, for a 2–curve with 18 degrees of freedom, 2
0.95 = – 2
0.05 ?
72)
A)
True
B)
False
73)
When conducting a chi–square homogeneity test, the value of the test statistic exceeds the critical
value. What can be concluded?
73)
A)
Do not reject H0 at the given significance level.
B)
No conclusion can be made regarding H0 at the given significance level.
C)
Reject H0 at the given significance level.
Find the specified conditional or marginal distribution for the given contingency table. Round to the nearest tenth of a
percent if needed.
74)
During a poll, 20 people were randomly selected and asked their political party affiliation. The
contingency table below shows the results cross classified by political party affiliation and income
bracket.
56 45 55 156
58 51 49 158
20 14 10 44
134 110 114 358
Find the marginal distribution of political party affiliation.
74)
A)
Democrats: 41.8% ; Republicans: 43.3% ; Other: 14.9%
B)
Democrats: 43.6% ; Republicans: 44.1% ; Other: 12.3%
C)
Low: 37.4% ; Middle: 30.7% ; High: 31.8%
D)
Democrats: 35.9% ; Republicans: 36.7% ; Other: 45.5%
Provide an appropriate response.
75)
A chi–square homogeneity test is is to be conducted to decide whether five populations are
nonhomogeneous with respect to a variable that has seven possible values. What is the degrees of
freedom for the 2–statistic?
75)
A)
28
B)
30
C)
24
D)
35
D)
Group the bivariate data into a contingency table.
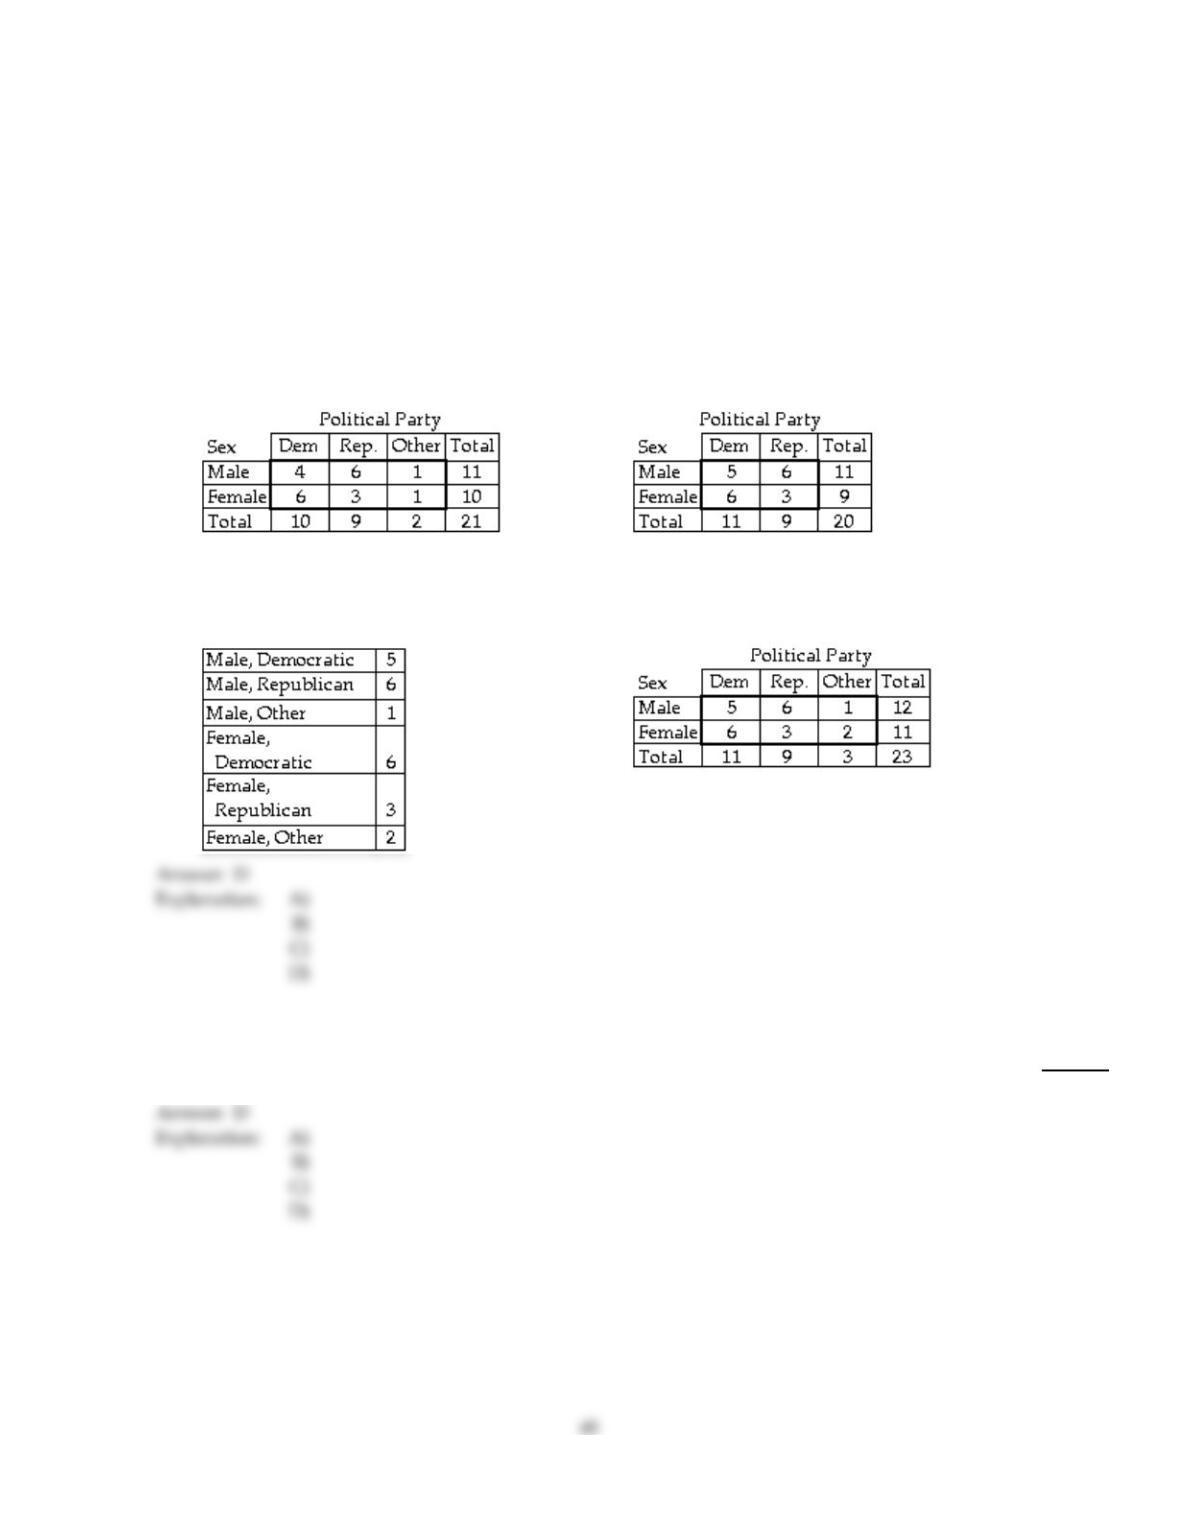
76)
The table below provides data on sex, political party affiliation, and income bracket for a sample of
people questioned during a poll. Group the bivariate data for the two variables “sex” and “political
party” into a contingency table.
Sex Political Party Income Bracket
M Rep High
F Dem Middle
F Dem Middle
M Dem Low
F Other Middle
M Rep Low
F Rep High
M Rep High
M Dem High
F Rep Low
M Dem High
F Rep Middle
76)
39
D)
F Dem Middle
M Dem Middle
M Rep Low
F Dem High
M Rep Low
F Other High
M Other Middle
F Dem Low
M Dem Middle
M Rep Low
FDem Middle
A)
B)
C)
D)
Find the required 2–value.
77)
For a 2–curve with 3 degrees of freedom, find the 2–value having area 0.025 to its right.
77)
A)
0.216
B)
7.378
C)
7.815
D)
9.348