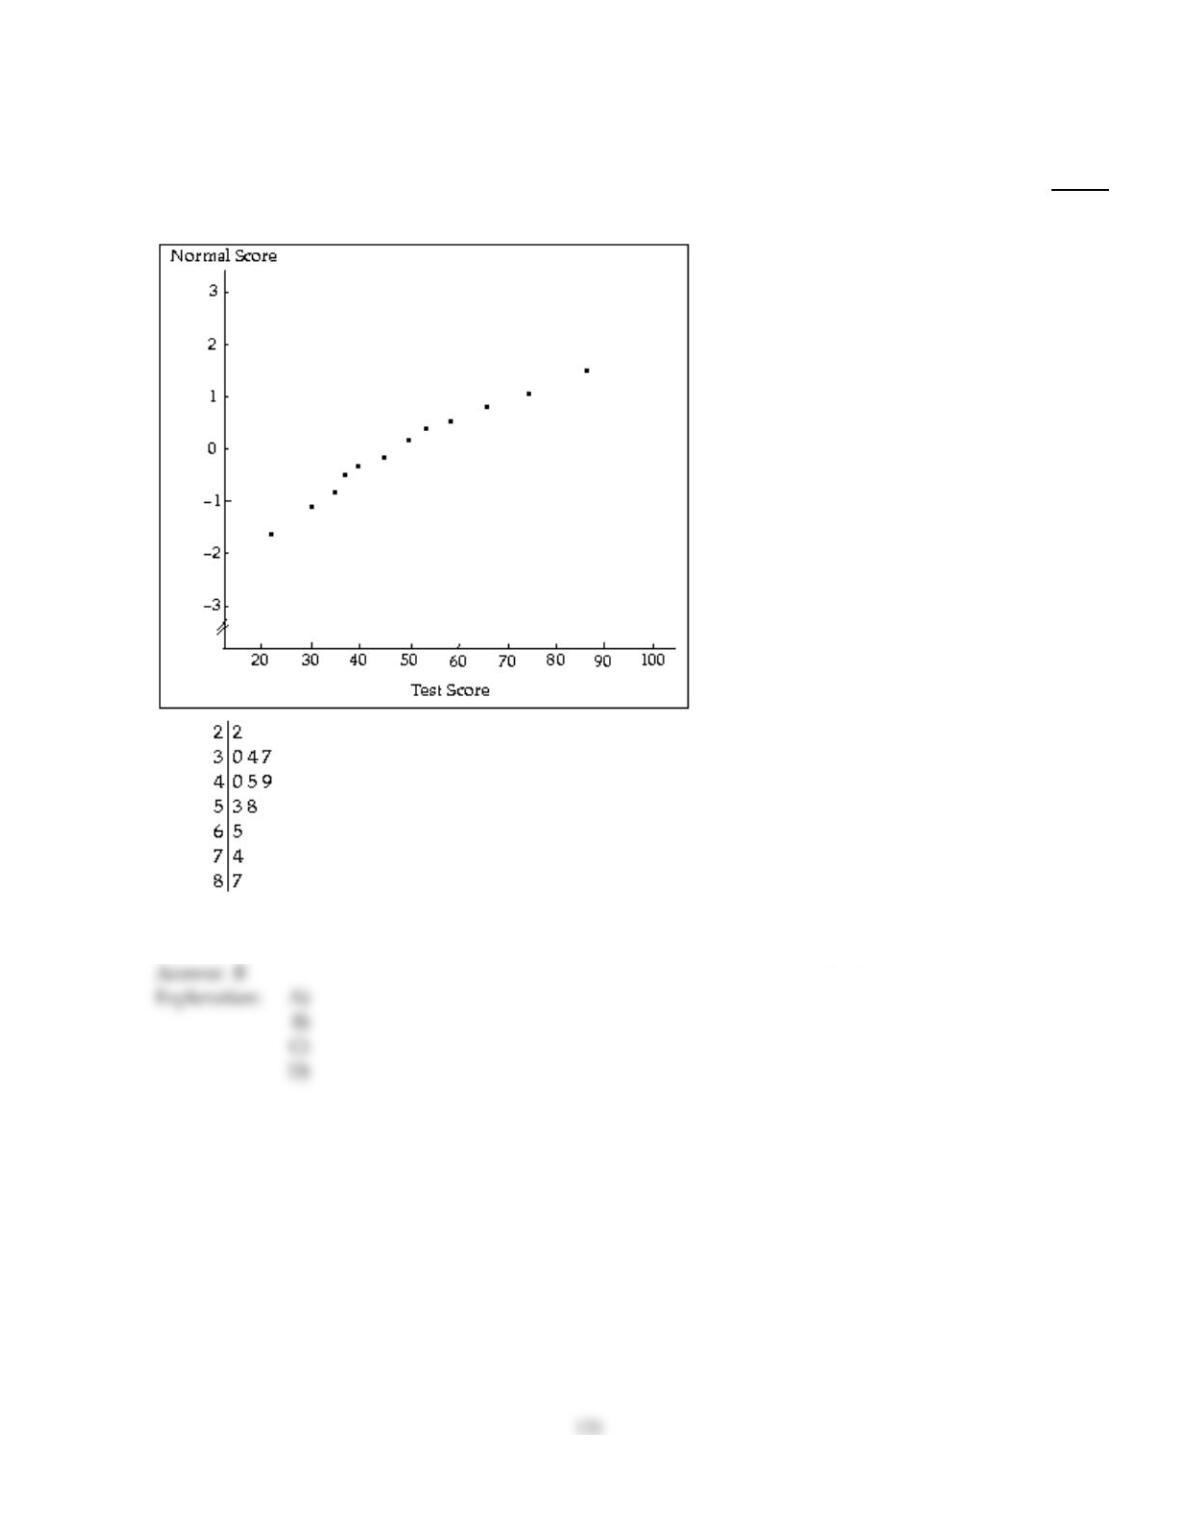
Two graphical displays are given for a set of data. A hypothesis test is to be performed for the mean of the population
from which the data were obtained. Use the graphs to determine whether a z–test, a t–test, a Wilcoxon signed–rank test, or
none of these is appropriate.
280)
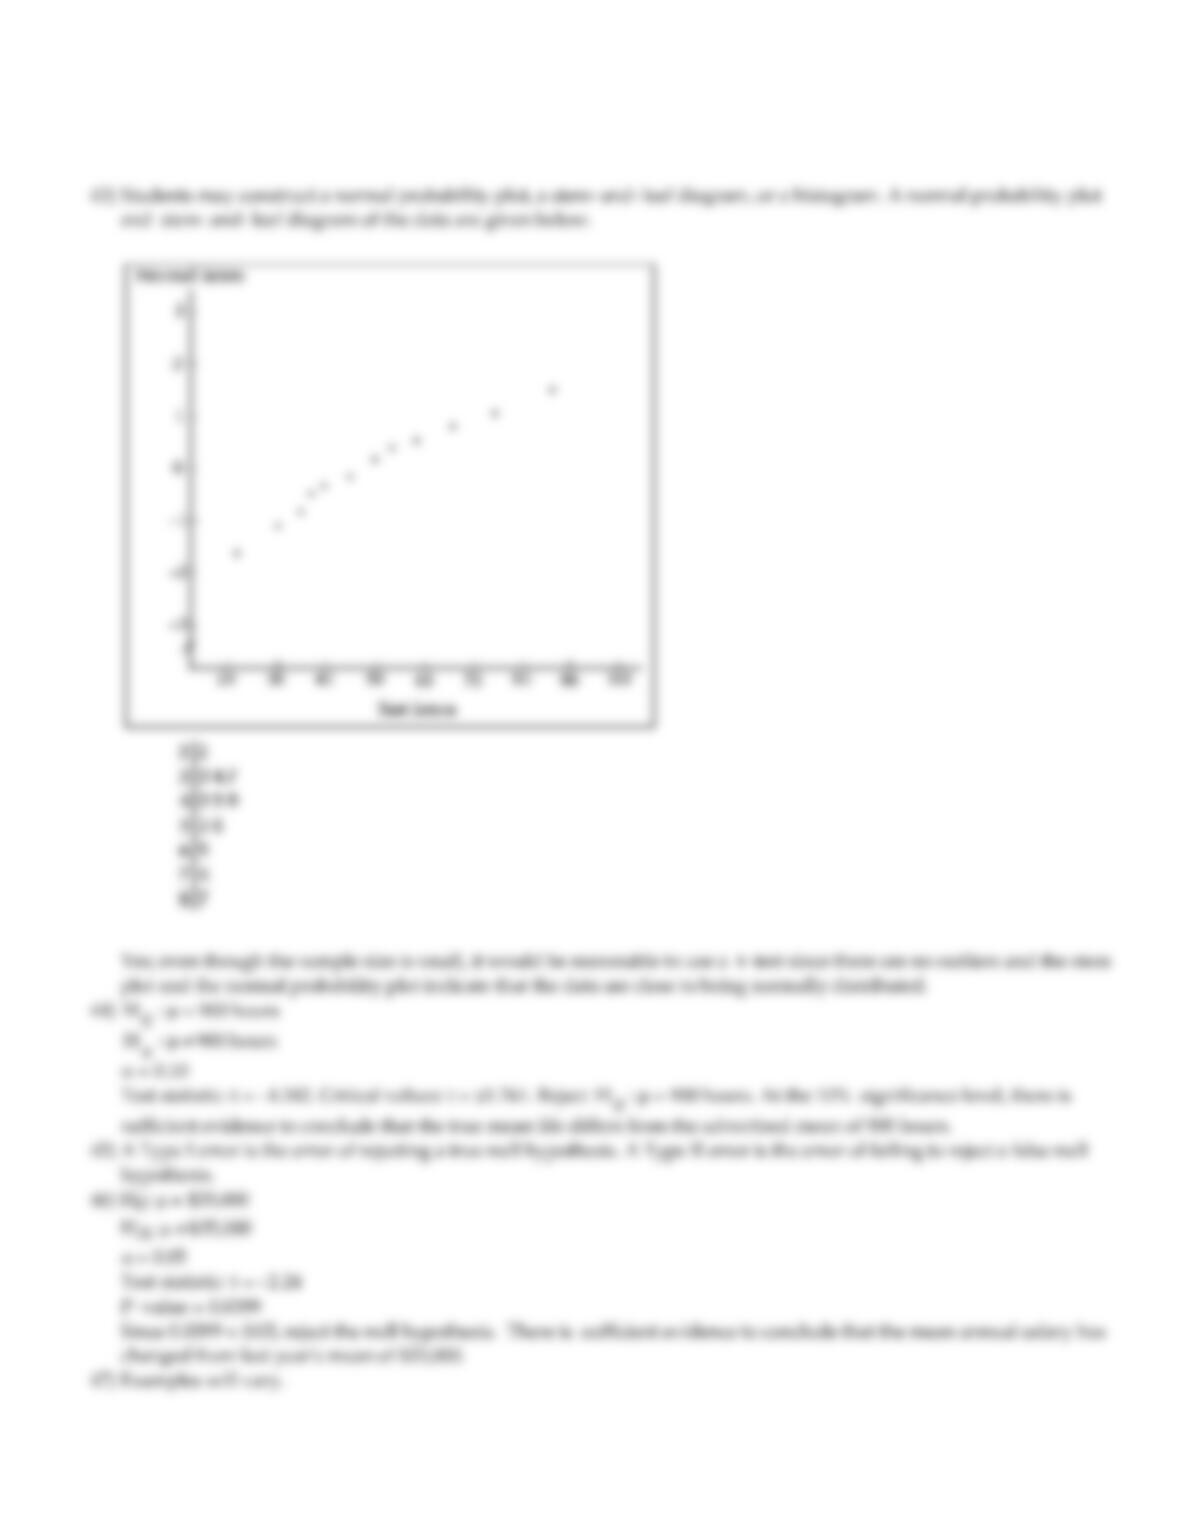
A normal probability plot and a stem–and–leaf diagram of the data are given below. is
unknown. Which procedure is appropriate?
280)
A)
Wilcoxon signed–rank test
B)
t–test
C)
z–test
D)
None of these tests is appropriate.
B

A z–test is to be performed for a population mean. Express the decision criterion for the hypothesis test in terms of x.
That is, determine for what values of x the null hypothesis would be rejected.
281)
A hypothesis test is to be performed to determine whether the mean hematocrit (percentage by
volume of the blood occupied by red blood cells) for women differs from the mean hematocrit for
men which is known to be 47%. Preliminary data analyses indicate that it is reasonable to apply a
z–test. The hypotheses are
H0: µ= 47%
Ha: µ 47%.
Assume that the population standard deviation is 2.8%. The sample size is 63. The significance
level is 0.01. Express the decision criterion for the hypothesis test in terms of x.
281)
A)
Reject H0 if x>47.91% or x<46.09%.
B)
Reject H0 if x> 2.575 or x< – 2.575.
C)
Reject H0 if x>54.21% or x<39.79%.
D)
Reject H0 if 46.09% <x<47.91%.
A hypothesis test is to be performed. Determine the null and alternative hypotheses.
282)
The maximum acceptable level of a certain toxic chemical in vegetables has been set at 0.9 parts per
million (ppm). A consumer health group measured the level of the chemical in a random sample of
tomatoes obtained from one producer to determine whether the mean level of the chemical in these
tomatoes exceeds the recommended limit.
282)
A)
H0: µ= 0.9 ppm
Ha: µ 0.9 ppm
B)
H0: µ< 0.9 ppm
Ha: µ> 0.9 ppm
C)
H0: µ> 0.9 ppm
Ha: µ= 0.9 ppm
D)
H0: µ= 0.9 ppm
Ha: µ> 0.9 ppm
Determine the critical value(s) for a one–mean z–test.
283)
A right–tailed test with =0.09.
283)
A)
±1.3546
B)
1.96
C)
±1.96
D)
1.3546
The significance level and P–value of a hypothesis test are given. Decide whether the null hypothesis should be rejected.
284)
= 0.05, P–value = 0.058
284)
A)
Reject the null hypothesis.
B)
Do not reject the null hypothesis.

A sample mean, sample standard deviation, and sample size are given. Use the one–mean t–test to perform the required
hypothesis test about the mean, µ, of the population from which the sample was drawn. Use the P–value approach. Also,
assess the strength of the evidence against the null hypothesis.
285)
x= 22,298, s = 14,200, n = 17, H0: µ= 30,000, Ha: µ
30,000 = 0.05.
285)
A)
Test statistic: t = – 2.24. P–value = 0.0200. Reject the null hypothesis. There is sufficient
evidence to conclude that the mean is different from 30,000. The evidence against the null
hypothesis is strong.
B)
Test statistic: t = – 2.24. P–value = 0.0250. Reject the null hypothesis. There is sufficient
evidence to conclude that the mean is different from 30,000. The evidence against the null
hypothesis is strong.
C)
Test statistic: t = – 2.24. P–value = 0.9601. Do not reject the null hypothesis. There is not
sufficient evidence to conclude that the mean is different from 30,000. The evidence against
the null hypothesis is weak or none.
D)
Test statistic: t = – 2.24. P–value = 0.0399. Reject the null hypothesis. There is sufficient
evidence to conclude that the mean is different from 30,000. The evidence against the null
hypothesis is strong.
123
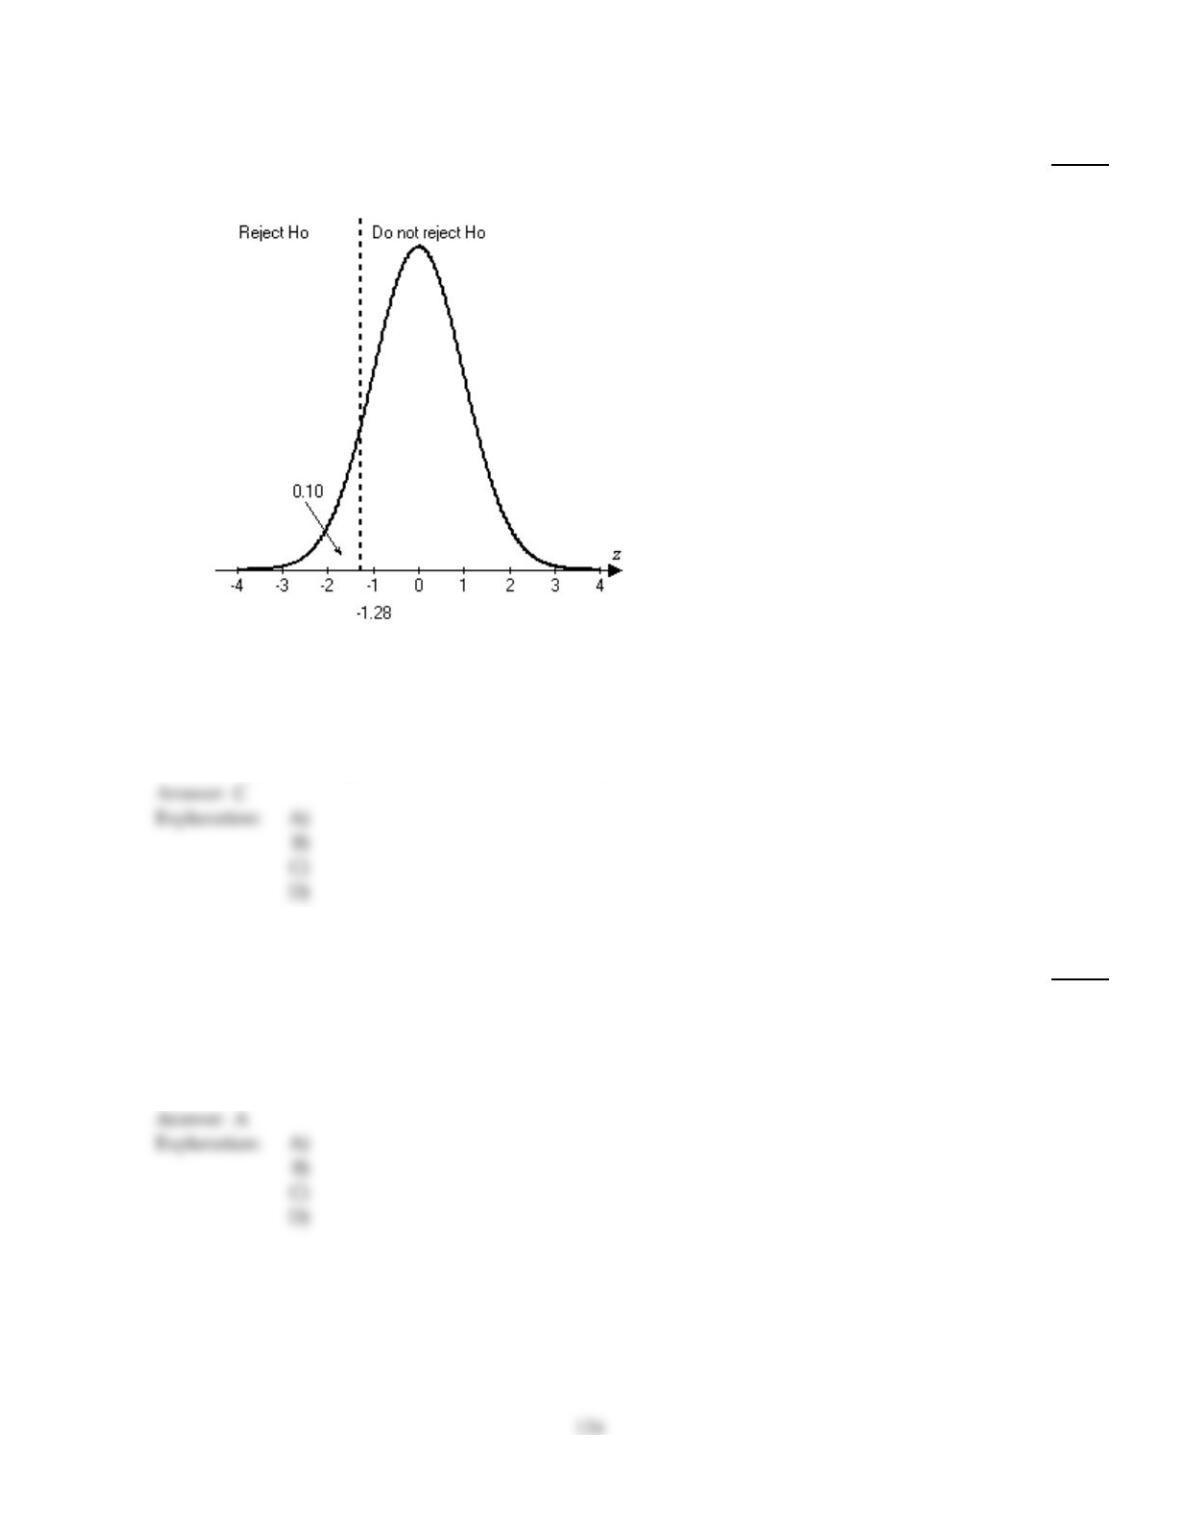
The graph portrays the decision criterion for a one–mean z–test. The curve in the graph is the normal curve for the test
statistic under the assumption that the null hypothesis is true. Use the graph to solve the problem.
286)
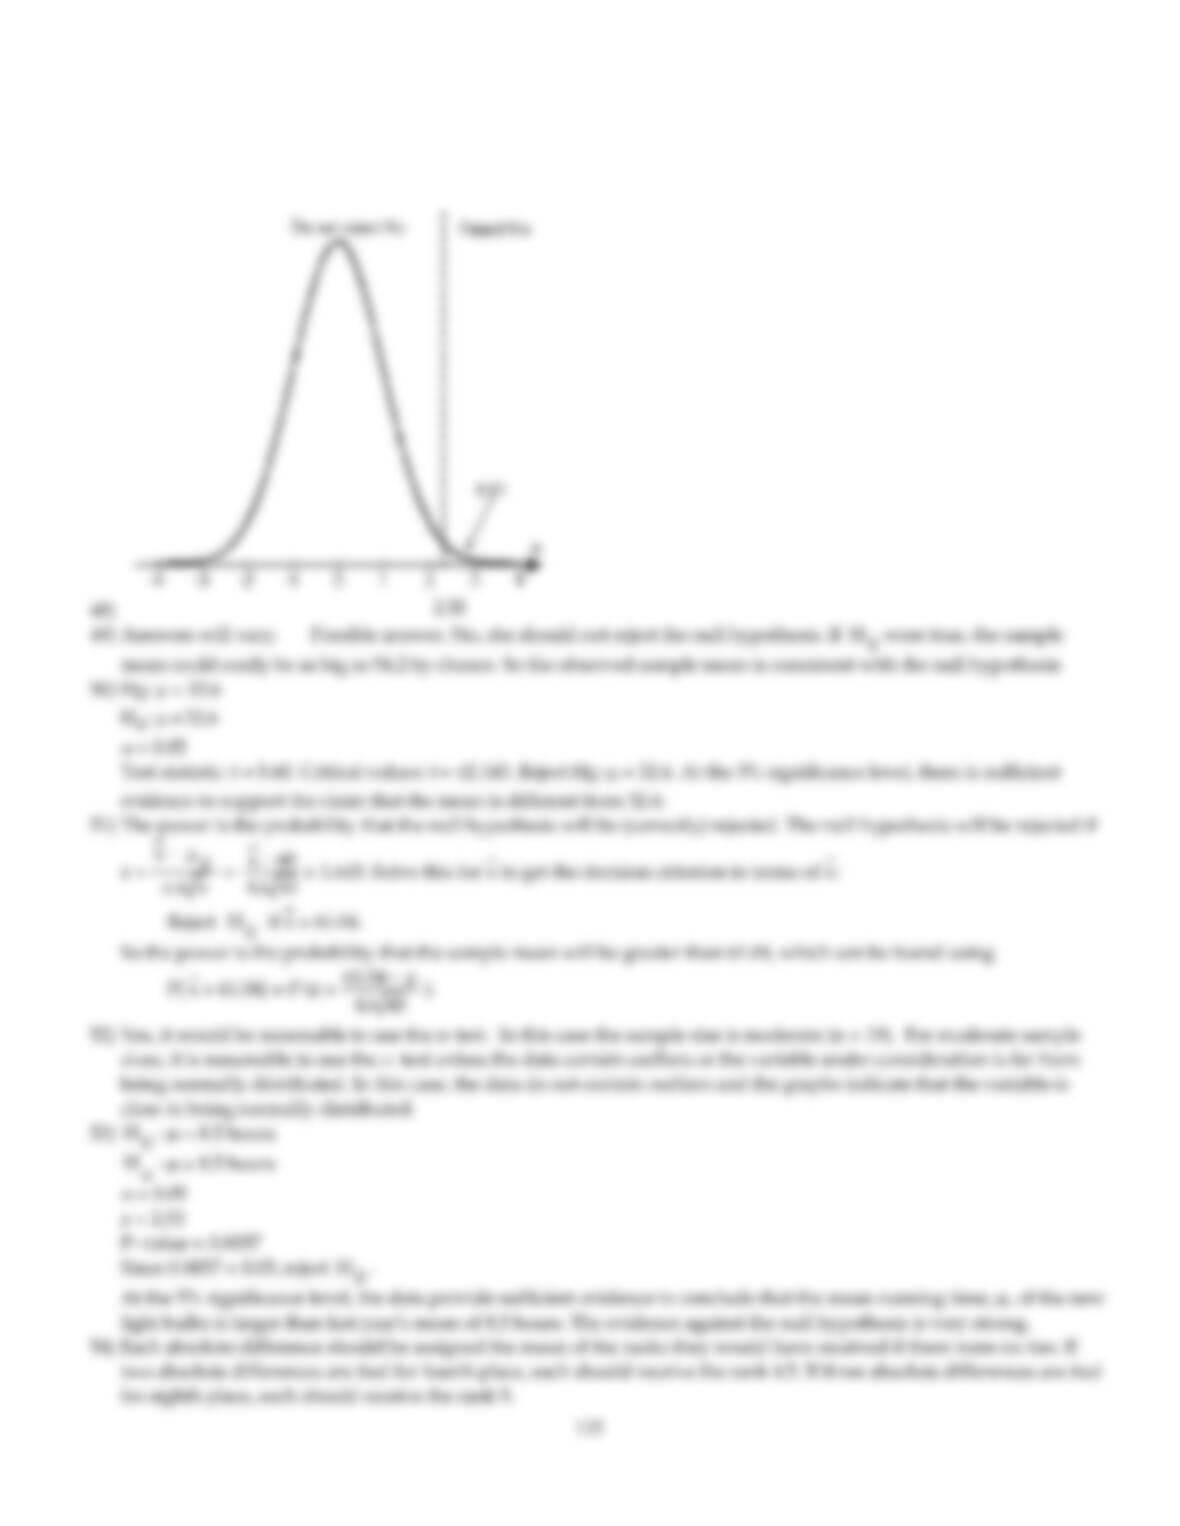
A graphical display of the decision criterion follows.
Identify the hypothesis test as two–tailed, left–tailed, or right–tailed.
286)
A)
Two–tailed
B)
Right–tailed
C)
Left–tailed
D)
There is not enough information to answer the question.
Provide an appropriate response.
287)
A one–sample z–test for a population mean is performed. Suppose that the P–value for the test is
0.04. For what significance levels (values of ) can the null hypothesis be rejected?
287)
A)
For all values of greater than or equal to 0.04
B)
For = 0.04
C)
For = 0.05, 0.10
D)
For all values of smaller than 0.04
Explanation:
Explanation:

The value obtained for the test statistic, z, in a one–mean z–test is given. Also given is whether the test is two tailed, left
tailed, or right tailed. Determine the P–value.
288)
A left–tailed test:
z = 1.71
288)
A)
0.9128
B)
0.0436
C)
0.0872
D)
0.9564
A sample mean, sample standard deviation, and sample size are given. Use the one–mean t–test to perform the required
hypothesis test about the mean, µ, of the population from which the sample was drawn. Use the P–value approach. Also,
assess the strength of the evidence against the null hypothesis.
289)
x= 137, s = 14.2, n = 20, H0: µ= 132, Ha: µ
132, = 0.1
289)
A)
Test statistic: t = 1.57. P–value = 0.0582. Reject H0. There is sufficient evidence to conclude
that the mean is different from 132. The evidence against the null hypothesis is moderate.
B)
Test statistic: t = 1.57. P–value = 0.1164. Do not reject H0. There is not sufficient evidence to
conclude that the mean is different from 132. The evidence against the null hypothesis is
weak or none.
C)
Test statistic: t = 1.57. P–value = 0.1318. Do not reject H0. There is not sufficient evidence to
conclude that the mean is different from 132. The evidence against the null hypothesis is
weak or none.
D)
Test statistic: t = 1.57. P–value = 0.0659. Reject H0. There is sufficient evidence to conclude
that the mean is different from 132. The evidence against the null hypothesis is moderate.
Determine the critical value(s) for a one–mean z–test.
290)
A left–tailed test with =0.05 .
290)
A)
–1.645
B)
±1.96
C)
±1.645
D)
–1.96

A sample mean, sample standard deviation, and sample size are given. Use the one–mean t–test to perform the required
hypothesis test about the mean, µ, of the population from which the sample was drawn. Use the critical–value approach.
291)
x=21 , s =7.4, n = 11, H0: µ= 18.7, Ha: µ 18.7, = 0.05
291)
A)
Test statistic: t =1.03. Critical values: t = ±2.201. Reject H0. There is sufficient evidence to
conclude that the mean is different from 18.7.
B)
Test statistic: t =1.03. Critical values: t = ±2.228. Do not reject H0. There is not sufficient
evidence to conclude that the mean is different from 18.7.
C)
Test statistic: t =1.03. Critical values: t = ±2.201. Do not reject H0. There is not sufficient
evidence to conclude that the mean is different from 18.7.
D)
Test statistic: t =1.03. Critical values: t = ±1.96. Reject H0. There is sufficient evidence to
conclude that the mean is different from 18.7.
The P–value for a hypothesis test is given. Determine whether the strength of the evidence against the null hypothesis is
weak/none, moderate, strong, or very strong.
292)
P = 0.036
292)
A)
Strong
B)
Moderate
C)
Very strong
D)
Weak or none
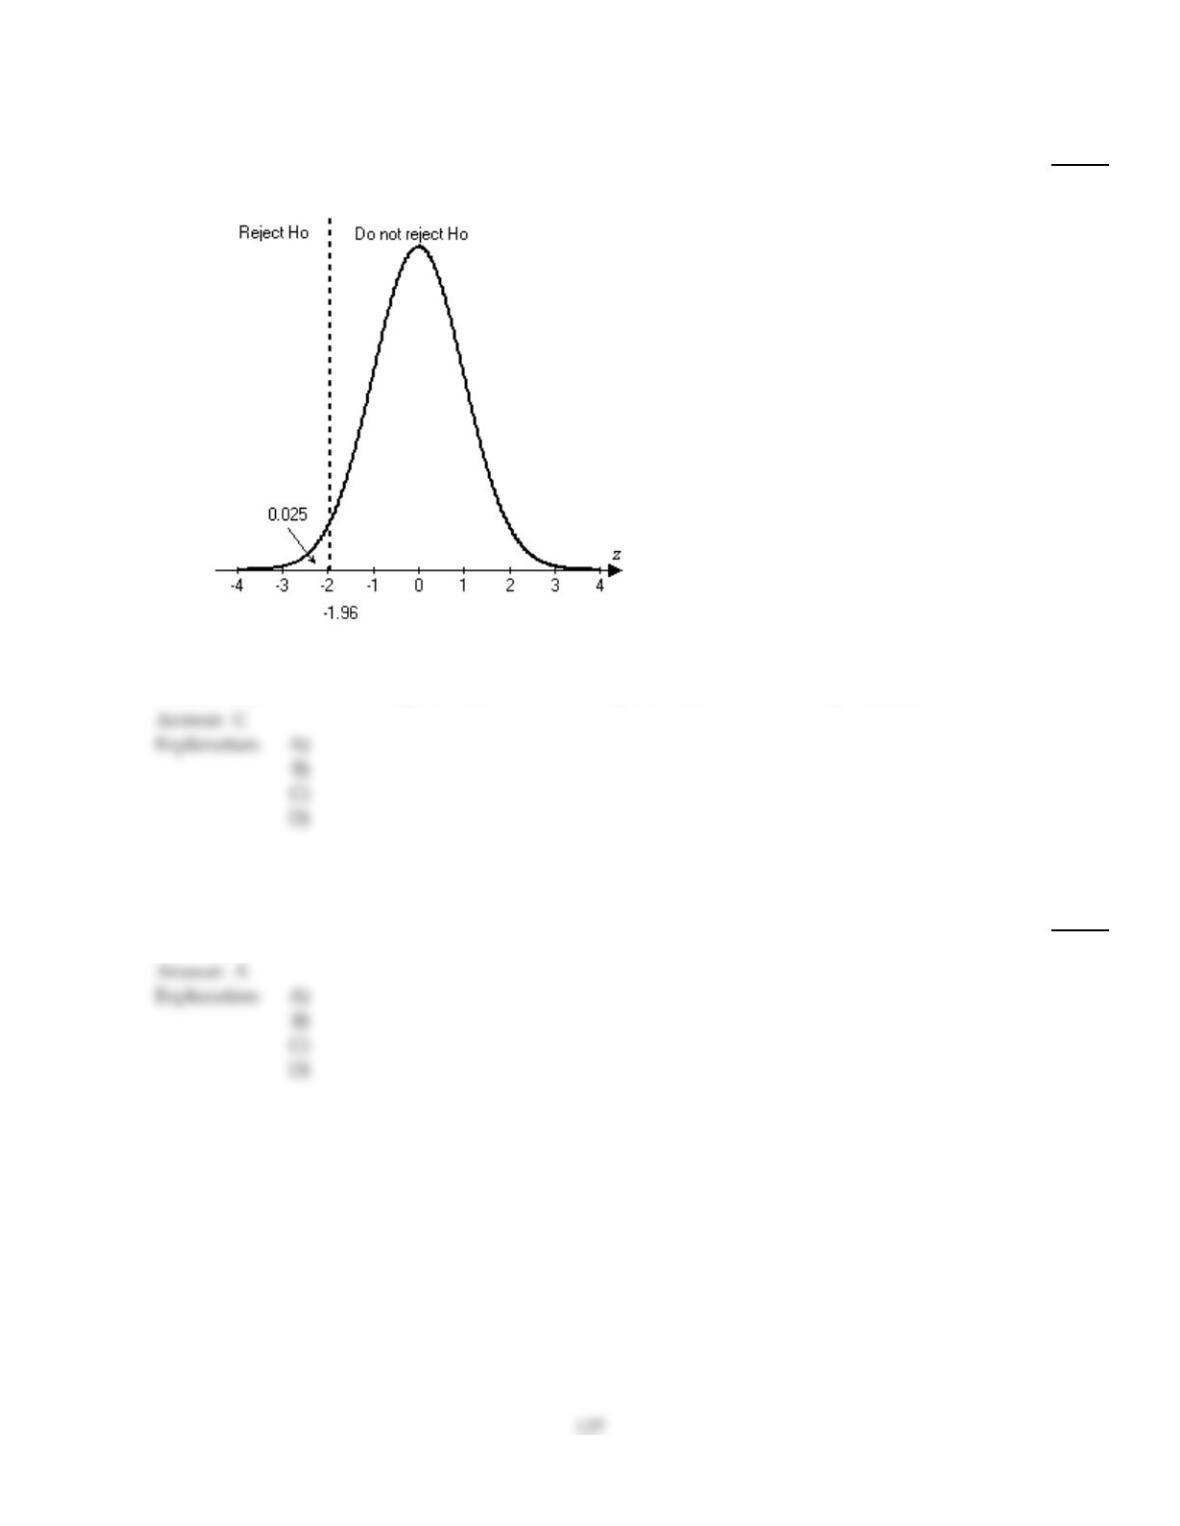
The graph portrays the decision criterion for a one–mean z–test. The curve in the graph is the normal curve for the test
statistic under the assumption that the null hypothesis is true. Use the graph to solve the problem.
293)
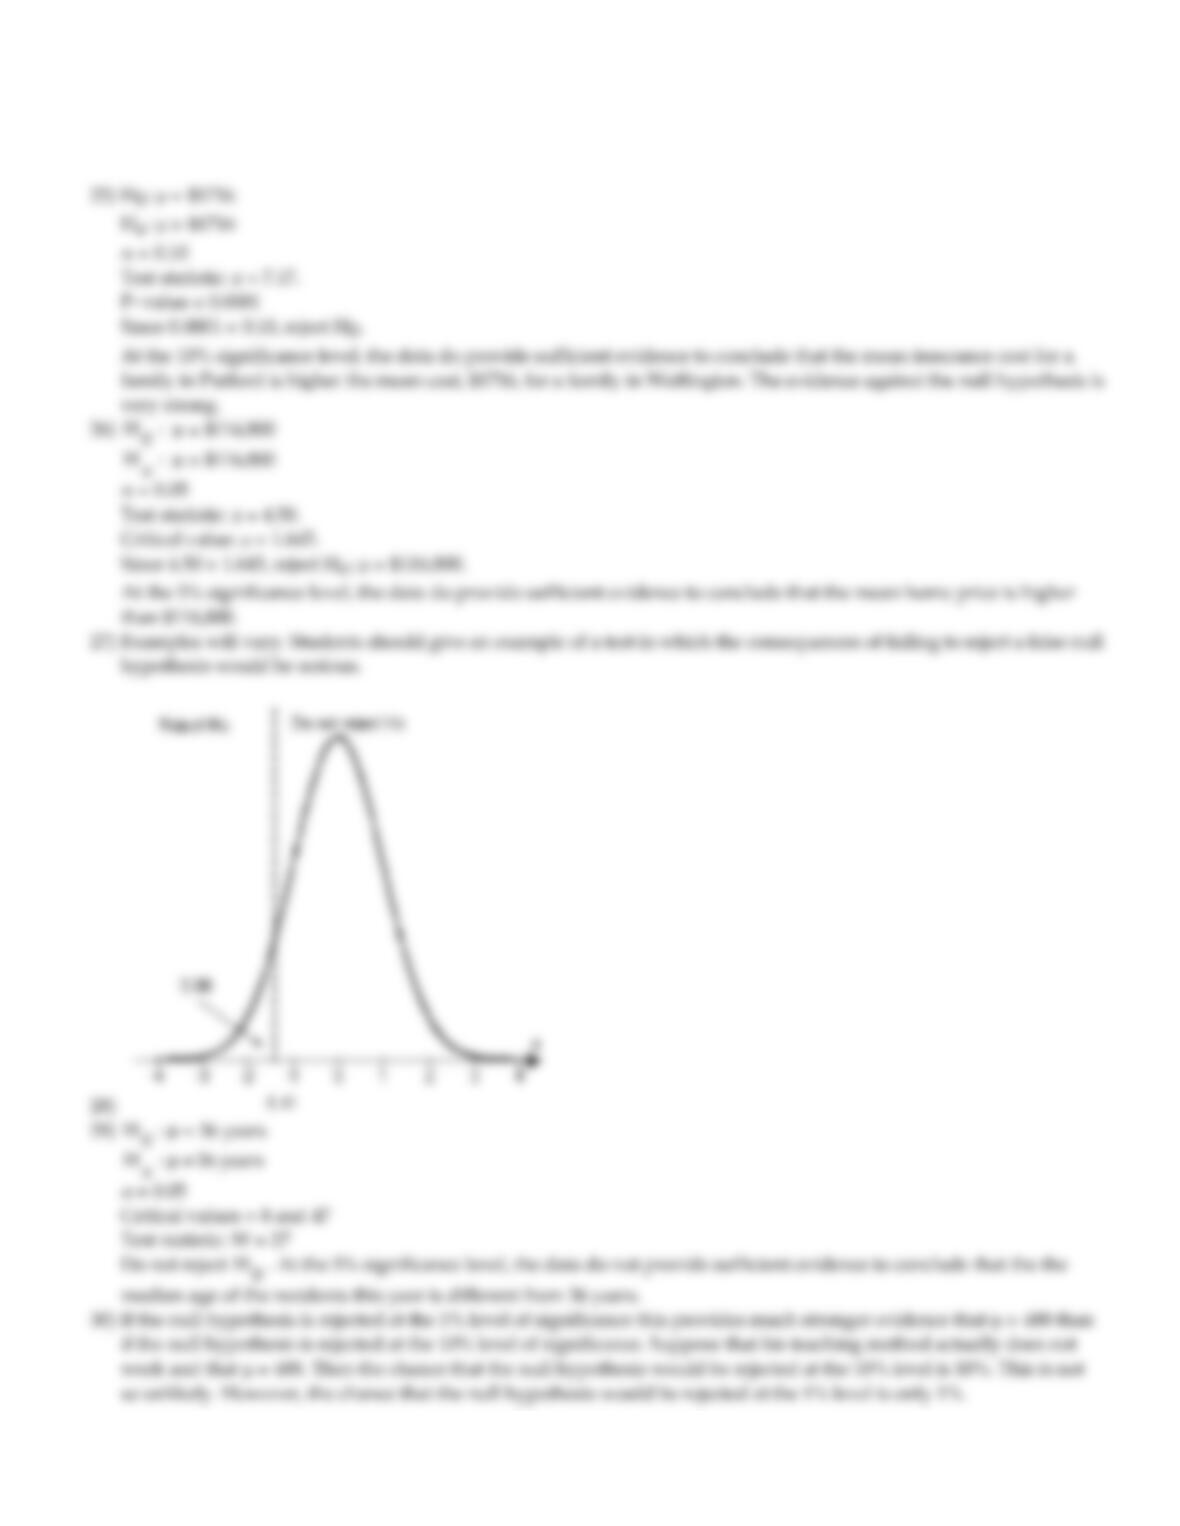
A graphical display of the decision criterion follows.
Determine the rejection region.
293)
A)
z 1.96
B)
z –1.96
C)
z –1.96
D)
z 0.025
The P–value for a hypothesis test is given. Determine whether the strength of the evidence against the null hypothesis is
weak/none, moderate, strong, or very strong.
294)
P = 0.0093
294)
A)
Very strong
B)
Moderate
C)
Strong
D)
Weak or none
Answer Key
Testname: C9
128
Answer Key
Testname: C9
129
Answer Key
Testname: C9
130
Answer Key
Testname: C9
131
Answer Key
Testname: C9
132
Answer Key
Testname: C9
133
Answer Key
Testname: C9
134
Answer Key
Testname: C9
Answer Key
Testname: C9
136