Determine the percentage of variation in the observed values of the response variable that is explained by the regression.
Round to the nearest tenth of a percent if needed.
50)
x 34.9 12.1 32.7 48.2 35.1
y 6 3 6 3 5
50)
A)
15.5%
B)
13.8%
C)
2.4%
D)
16.5%
Determine the y–intercept and slope of the linear equation.
51)
y =10x
51)
A)
y–intercept = 0, slope = – 10
B)
y–intercept =10, slope =10
C)
y–intercept = 0, slope =10
D)
y–intercept =10, slope = 0
C
Compute the coefficient of determination. Round your answer to four decimal places.
52)
^
The regression equation for the data below is y= 3x.
x 2 4 5 6
y 7 11 13 20
52)
A)
0.9420
B)
0.4839
C)
0.7265
D)
0.8873
D
C
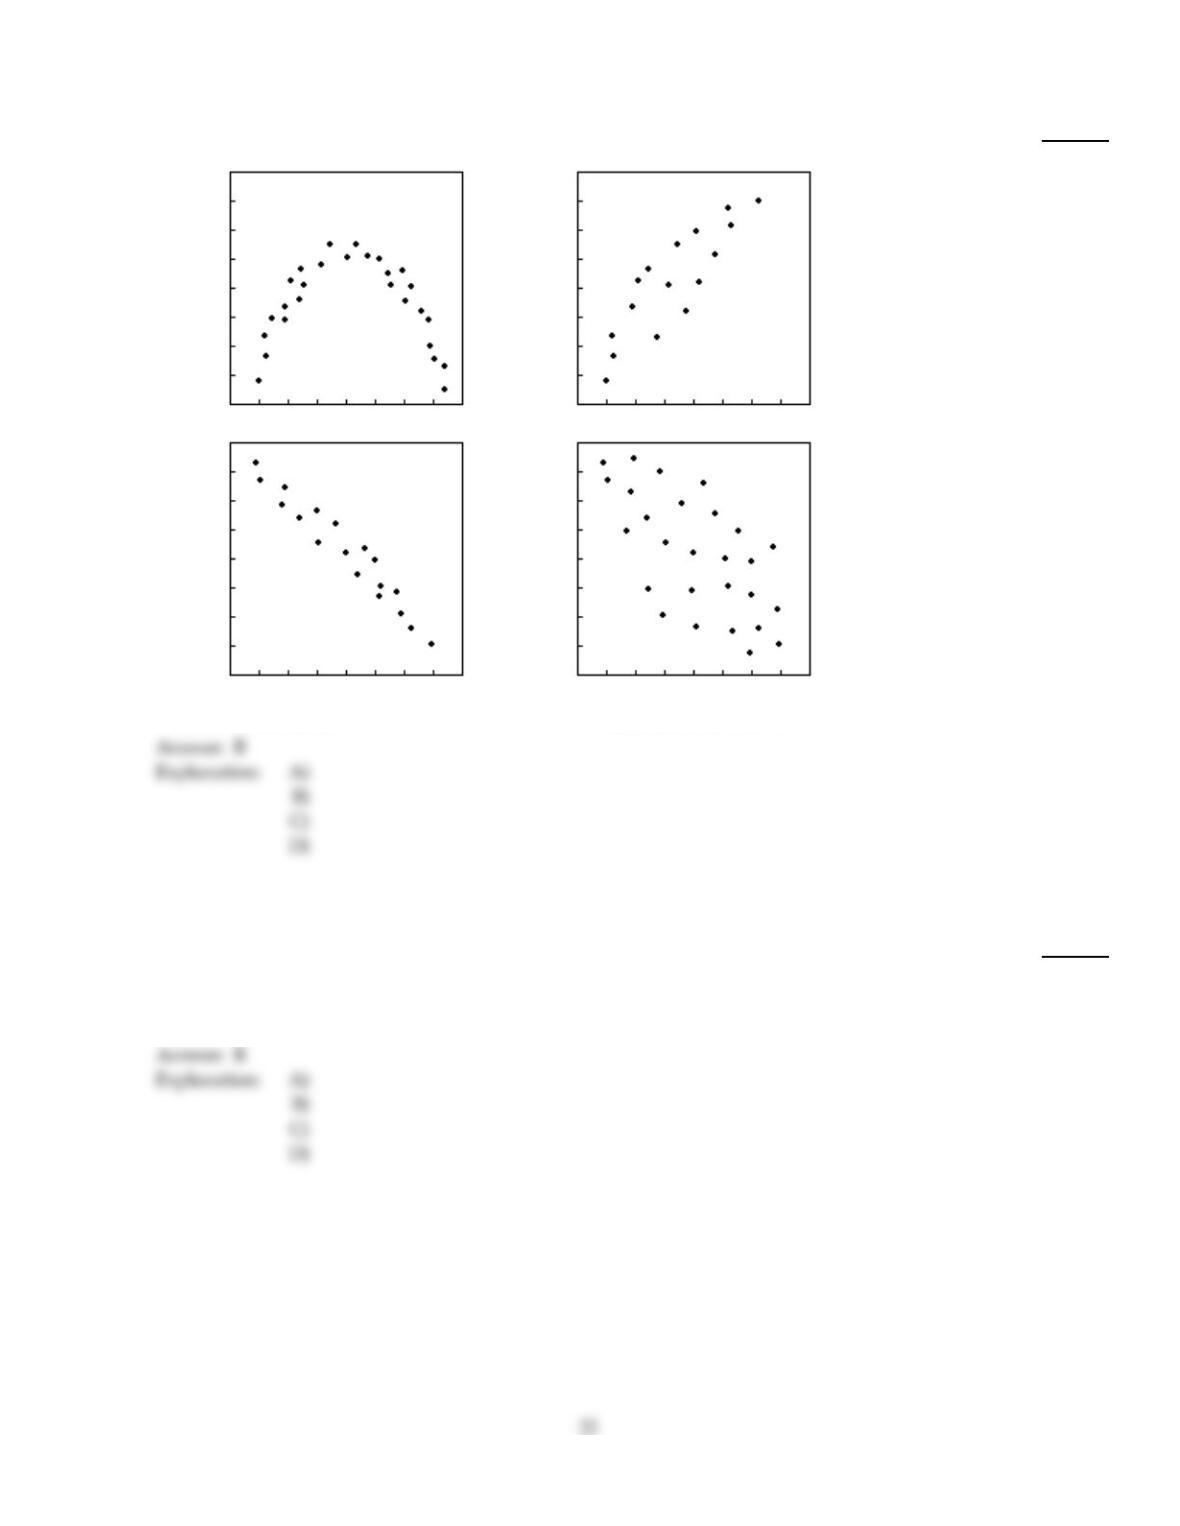
Provide an appropriate response.
53)
For which of the following sets of data points can you reasonably determine a regression line?
1) 2)
3) 4)
53)
A)
2, 3, and 4
B)
2 and 3
C)
All of the above
D)
None of the above
Use the regression equation to predict the y–value corresponding to the given x–value. Round your answer to the nearest
tenth.
54)
^
The regression equation relating dexterity scores (x) and productivity scores (y) for ten randomly
selected employees of a company is y= 5.50 + 1.91x. Predict the productivity score for an employee
whose dexterity score is 21.
54)
A)
117.4
B)
45.6
C)
58.2
D)
56.3
Compute the specified sum of squares.
55)
^
The data below consist of heights (x), in meters, and masses (y), in kilograms, of 6 randomly
selected adults. The regression equation is y= – 181.342 + 144.46x.
x 1.61 1.72 1.78 1.80 1.67 1.88
y54 62 70 84 61 92
SSR
55)
A)
100.06
B)
979.44
C)
1149.2
D)
1079.5
A set of data points and the equations of two lines are given. For each line, determine e2. Then, determine which line
fits the set of data points better, according to the least–squares criterion.
56)
x 1 2 4 4
y 2 3 5 4
Line A: y = 1 + 0.9x
Line B: y = 0.8 + 1.1x
56)
A)
Line A: e2= 0.57
Line B: e2= 1.49
Line B fits the set of data points better.
B)
Line A: e2= 0.57
Line B: e2= 1.49
Line A fits the set of data points better.
C)
Line A: e2= 1.31
Line B: e2= 1.57
Line A fits the set of data points better.
D)
Line A: e2= 1.31
Line B: e2= 1.57
Line B fits the set of data points better.
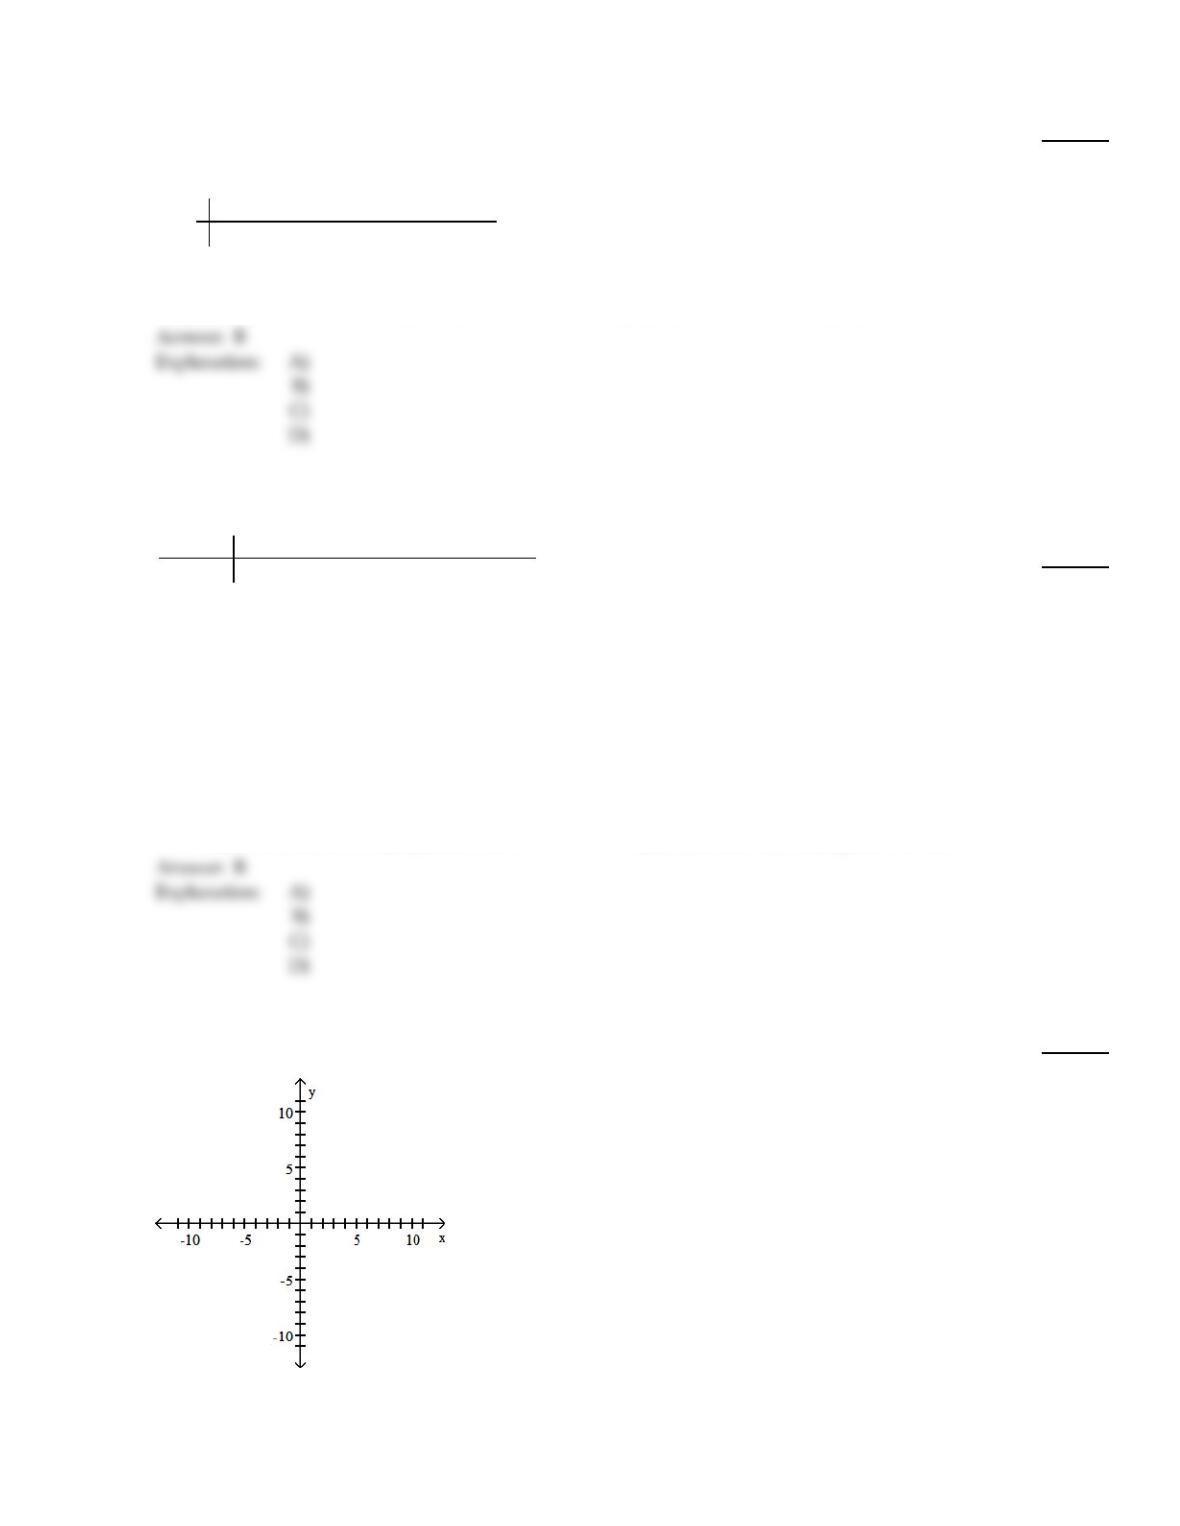
You are given information about a straight line. Use two points to graph the equation.
57)
The equation of the line is y =7.
57)
23
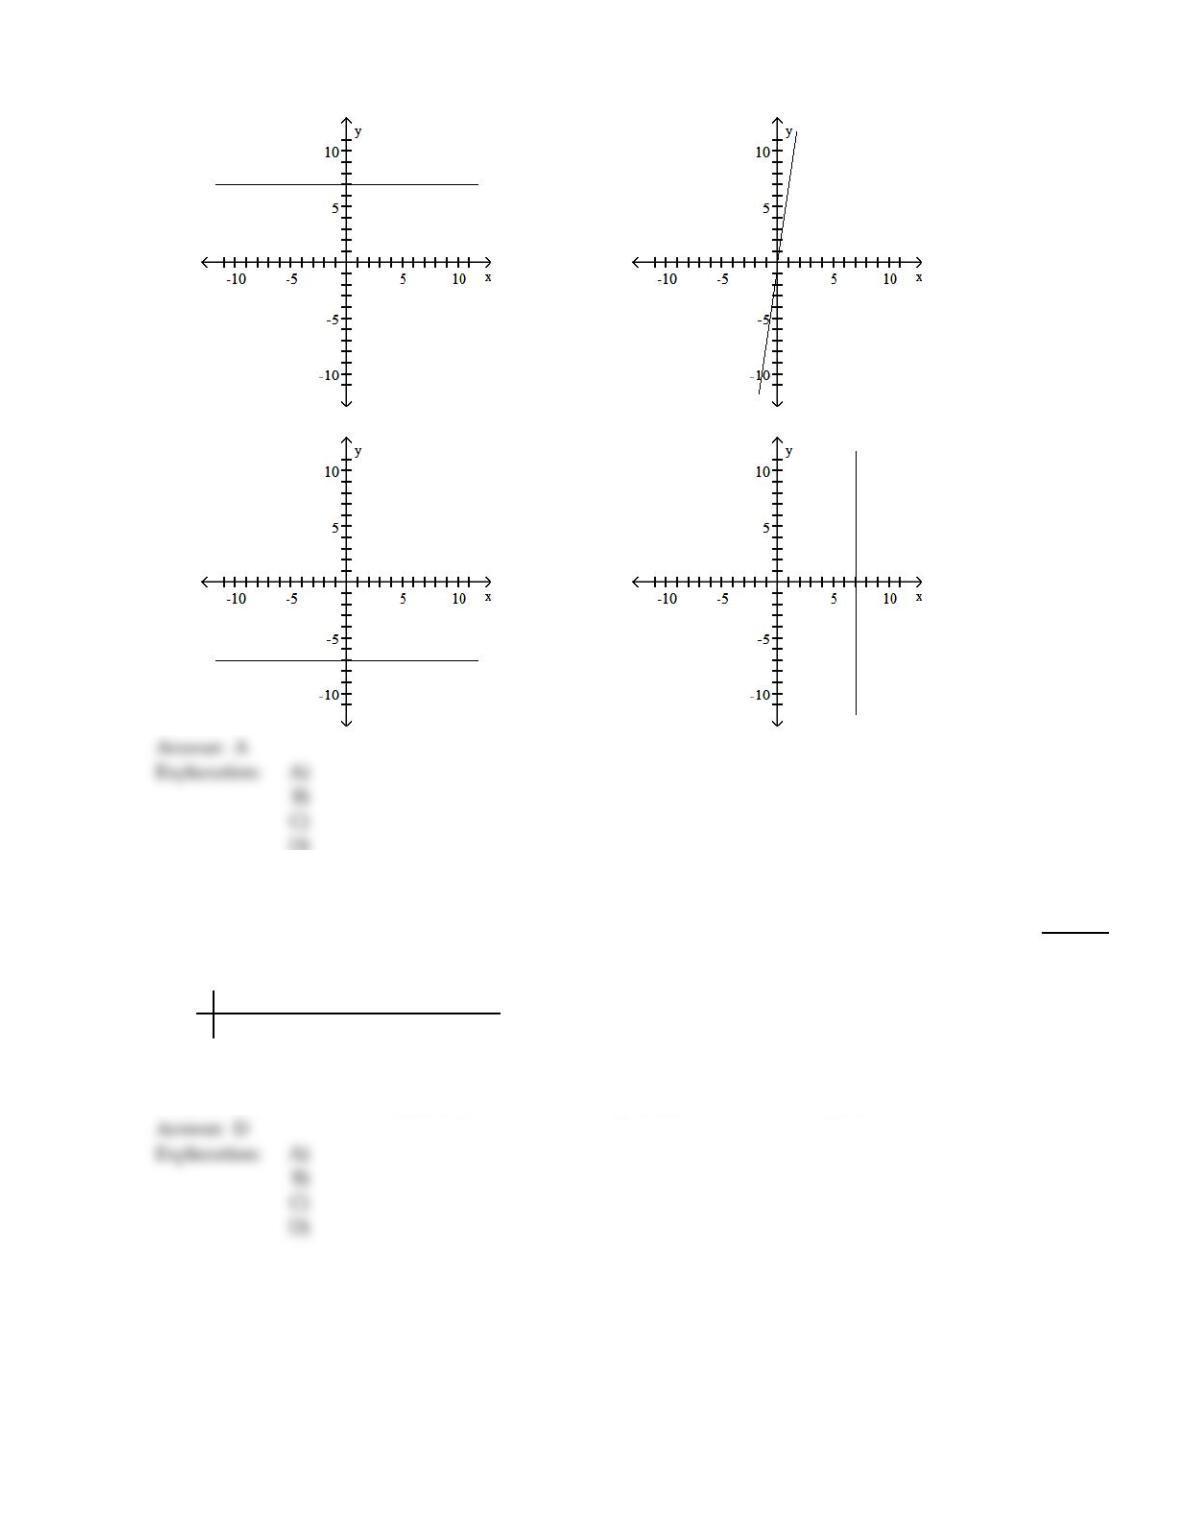
A)
B)
C)
D)
D)
Compute the specified sum of squares.
58)
^
The data below consist of heights (x), in meters, and masses (y), in kilograms, of 6 randomly
selected adults. The regression equation is y= – 181.342 + 144.46x.
x 1.61 1.72 1.78 1.80 1.67 1.88
y 54 62 70 84 61 92
SSE
58)
A)
119.30
B)
979.44
C)
1079.5
D)
100.06
D)
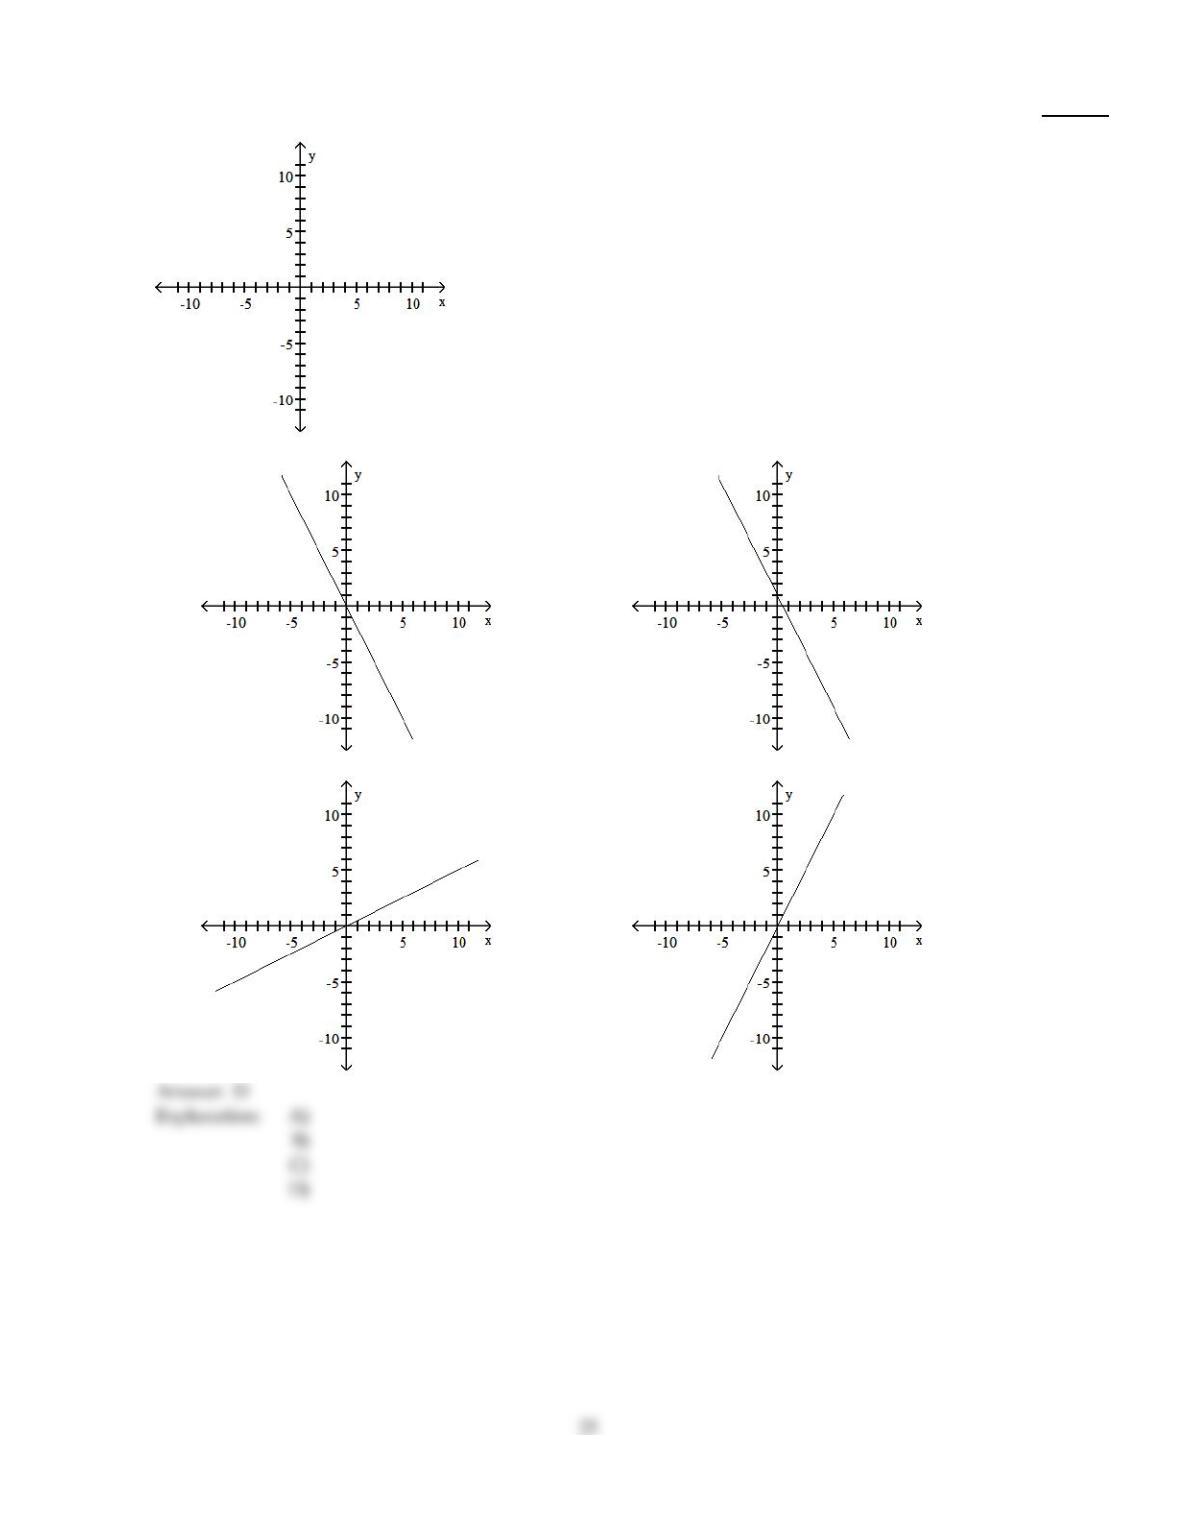
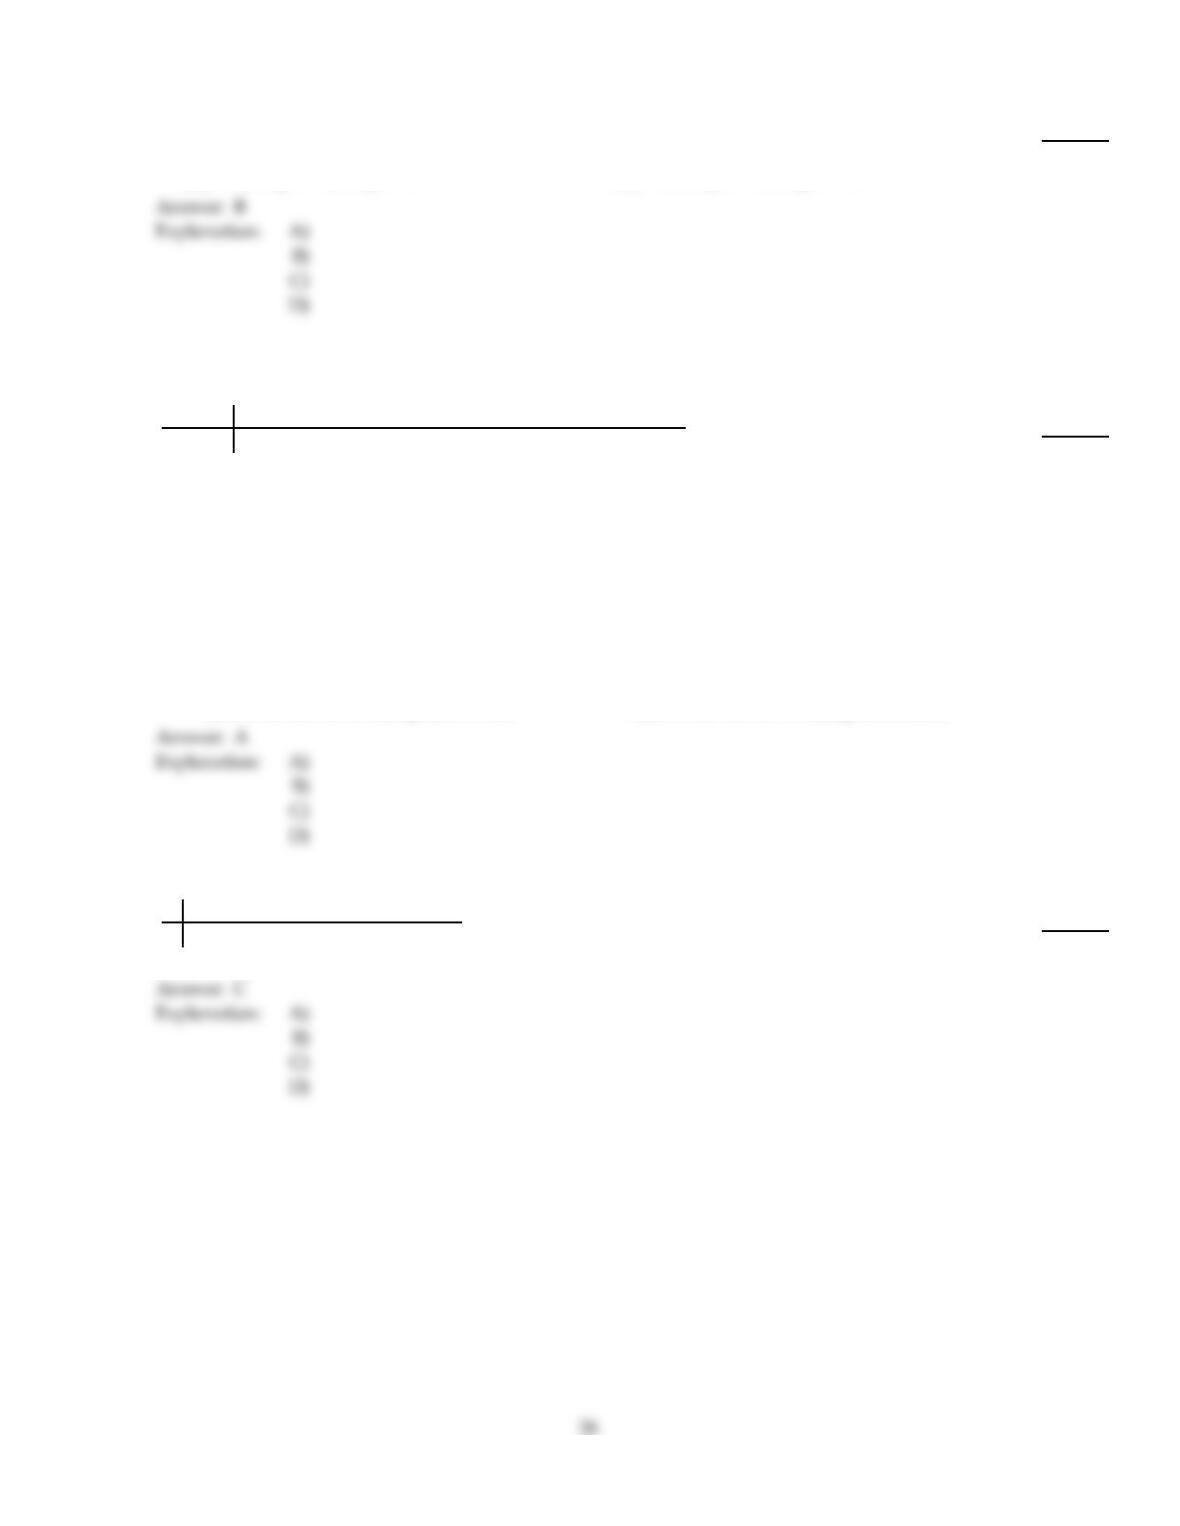
You are given information about a straight line. Use two points to graph the equation.
24
59)
The equation of the line is y =2x.
59)
A)
B)
C)
D)
Determine the y–intercept and slope of the linear equation.
60)
y =12 –6x
60)
A)
y–intercept =6, slope =12
B)
y–intercept =12, slope = – 6
C)
y–intercept =12, slope =6
D)
y–intercept = – 6, slope =12
A set of data points and the equations of two lines are given. For each line, determine e2. Then, determine which line
fits the set of data points better, according to the least–squares criterion.
61)
x 0 2 4 4 6 7
y 1 4 9 11 14 15
Line A: y = 1.0 + 2.2x
Line B: y = 1.2 + 2.1x
61)
A)
Line A: e2= 6.04
Line B: e2= 5.17
Line B fits the set of data points better.
B)
Line A: e2= 4.86
Line B: e2= 4.70
Line A fits the set of data points better.
C)
Line A: e2= 4.86
Line B: e2= 4.70
Line B fits the set of data points better.
D)
Line A: e2= 6.04
Line B: e2= 5.17
Line A fits the set of data points better.
A
Obtain the linear correlation coefficient for the data. Round your answer to three decimal places.
62)
x 57 53 59 61 53 56 60
y 156 164 163 177 159 175 151
62)
A)
–0.054
B)
0.214
C)
0.109
D)
–0.078
C
B
Compute the coefficient of determination. Round your answer to four decimal places.
63)
^
The cost of advertising (x), in thousands of dollars, and the number of products sold (y), in
thousands, for eight randomly selected product lines are shown below.
x 9 2 3 4 2 5 9 10
y 85 52 55 68 67 86 83 73
The regression equation is y= 2.78846x + 55.7885.
63)
A)
0.7077
B)
0.5009
C)
–0.0707
D)
0.2353
The y–intercept and slope, respectively, of a straight line are given. Find the equation of the line.
64)
–3.4 and 9.7
64)
A)
y =3.4 +9.7x
B)
y +9.7x = – 3.4
C)
y = – 3.4x +9.7
D)
y = – 3.4 +9.7x
65)
–2.3 and 0
65)
A)
y = – 2.3x
B)
y =2.3
C)
y –2.3x = 0
D)
y = – 2.3
Provide an appropriate response.
66)
For the linear equation y =5+4x, explain what the y–intercept and slope represent in terms of the
graph of the equation.
66)
A)
The y–intercept, b0=5, gives the y–value at which the straight line y =5+4x intersects the
y–axis. The slope, b1=4, indicates that the x–value increases by 4 units for every increase in y
of 1 unit.
B)
The y–intercept, b0=5, gives the y–value at which the straight line y =5+4x intersects the
y–axis. The slope, b1=4, indicates that the y–value increases by 4 units for every increase in x
of 1 unit.
C)
The y–intercept, b0=5, gives the y–value at which the straight line y =5+4x intersects the
x–axis. The slope, b1=4, indicates that the x–value increases by 4 units for every increase in y
of 1 unit.
D)
The y–intercept, b0=4, gives the y–value at which the straight line y =5+4x intersects the
y–axis. The slope, b1=5, indicates that the y–value increases by 5 units for every increase in x
of 1 unit.
You are given information about a straight line. Determine whether the line slopes upward, slopes downward, or is
horizontal.
67)
The y–intercept is –0.2 and the slope is 12.
67)
A)
Is horizontal
B)
Slopes downward
C)
Slopes upward
Determine the regression equation for the data. Round the final values to three significant digits, if necessary.
68)
x 3 5 7 15 16
y 8 11 714 20
68)
A)
^
y= 4.07 + 0.753x
B)
^
y= 4.07 + 0.850x
C)
^
y= 5.07 + 0.753x
D)
^
y= 5.07 + 0.850x
Compute the specified sum of squares.
69)
^
The data below consist of test scores (y) and hours of preparation (x) for 5 randomly selected
students. The regression equation is y= 44.8447 + 3.52427x.
x 5 2 9 6 10
y 64 48 72 73 80
SST
69)
A)
498.103
B)
511.724
C)
87.4757
D)
599.200
The y–intercept and slope, respectively, of a straight line are given. Find the equation of the line.
70)
4.9 and –1
70)
A)
y –4.9x = 1
B)
y =4.9x – 1
C)
y =4.9 – x
D)
y =4.9 + x
71)
–6 and 10
71)
A)
y +10x = – 6
B)
y = – 6x +10
C)
y =6+10x
D)
y = – 6+10x
You are given information about a straight line. Determine whether the line slopes upward, slopes downward, or is
horizontal.
72)
The y–intercept is 0 and the slope is –3.7.
72)
A)
Slopes upward
B)
Is horizontal
C)
Slopes downward
Solve the problem.
73)
A study was conducted to compare the average time spent in the lab each week versus course
grade for computer students. The results are recorded in the table below.
Number of hours spent in lab Grade (percent)
10 96
11 51
16 62
958
789
15 81
16 46
10 51
State how useful the regression equation appears to be for making predictions.
73)
A)
Moderately useful
B)
Extremely useful
C)
Not very useful
D)
Not enough information
Compute the coefficient of determination. Round your answer to four decimal places.
74)
A regression equation is obtained for a set of data points. It is found that the total sum of squares is
103.2, the regression sum of squares is 94.8, and the error sum of squares is 8.4.
74)
A)
0.0886
B)
0.9186
C)
0.0814
D)
1.0886
Provide an appropriate response.
75)
True or false? Every straight line can be represented by an equation of the form y =b0+b1x.
75)
A)
True
B)
False
30
Solve the problem.
76)
The paired data below consist of the temperatures on randomly chosen days and the amount a
certain kind of plant grew (in millimeters):
x 62 76 50 51 71 46 51 44 79
y36 39 50 13 33 33 17 616
Find the SSR.
76)
A)
243
B)
64.328
C)
242.951
D)
0
You are given information about a straight line. Determine whether the line slopes upward, slopes downward, or is
horizontal.
77)
The equation of the line is y =14 –15x.
77)
A)
Slopes downward
B)
Is horizontal
C)
Slopes upward
Determine the percentage of variation in the observed values of the response variable that is explained by the regression.
Round to the nearest tenth of a percent if needed.
78)
x 5 10 4 6 10 9
y 64 86 69 86 59 87
78)
A)
0%
B)
22.4%
C)
5.0%
D)
67.8%
You are given information about a straight line. Determine whether the line slopes upward, slopes downward, or is
horizontal.
79)
The equation of the line is y = – 9.5x.
79)
A)
Is horizontal
B)
Slopes downward
C)
Slopes upward
31
Provide an appropriate response.
80)
For the linear equation y =14 –20x, explain what the y–intercept and slope represent in terms of
the graph of the equation.
80)
A)
The y–intercept, b0= – 20, gives the y–value at which the straight line y =14 –20x intersects
the y–axis. The slope, b1=14, indicates that the y–value increases by 14 units for every
increase in x of 1 unit.
B)
The y–intercept, b0=14, gives the y–value at which the straight line y =14 –20x intersects the
y–axis. The slope, b1=20, indicates that the y–value increases by 20 units for every increase
in x of 1 unit.
C)
The y–intercept, b0=14, gives the y–value at which the straight line y =14 –20x intersects the
y–axis. The slope, b1= – 20, indicates that the y–value decreases by 20 units for every increase
in x of 1 unit.
D)
The y–intercept, b0=14, gives the y–value at which the straight line y =14 –20x intersects the
y–axis. The slope, b1= – 20, indicates that the x–value decreases by 20 units for every increase
in y of 1 unit.
Solve the problem.
81)
A study was conducted to compare the average time spent in the lab each week versus course
grade for computer students. The results are recorded in the table below.
Number of hours spent in lab Grade (percent)
10 96
11 51
16 62
958
789
15 81
16 46
10 51
Find the coefficient of determination.
81)
A)
0.462
B)
0.335
C)
0.017
D)
0.112
Obtain the linear correlation coefficient for the data. Round your answer to three decimal places.
82)
Managers rate employees according to job performance (x) and attitude (y). The results for several
randomly selected employees are given below.
x
y
59 63 65 69 58 77 76 69 70 64
72 67 78 82 75 87 92 83 87 78
82)
A)
0.916
B)
0.863
C)
0.610
D)
0.729
Solve the problem.
83)
The paired data below consist of the temperatures on randomly chosen days and the amount a
certain kind of plant grew (in millimeters):
x 62 76 50 51 71 46 51 44 79
y36 39 50 13 33 33 17 616
Find the SSE.
83)
A)
243
B)
1748.328
C)
1619.672
D)
242.951
Provide an appropriate response.
84)
True or false? The straight–line graph of the linear equation y =b0+b1x passes through the origin
if b0= 0.
84)
A)
True
B)
False
Use the regression equation to predict the y–value corresponding to the given x–value. Round your answer to the nearest
tenth.
85)
^
Eight pairs of data yield the regression equation y= 55.8 + 2.79x. Predict y for x =9.9.
85)
A)
71.1
B)
57.8
C)
555.2
D)
83.4
33
86)
^
The regression equation relating attitude rating (x) and job performance rating (y) for ten randomly
selected employees of a company is y= 11.7 + 1.02x. Predict the job performance rating for an
employee whose attitude rating is 75.
86)
A)
12.6
B)
88.2
C)
80.1
D)
86.9
Determine the y–intercept and slope of the linear equation.
87)
y =5.6 – x
87)
A)
y–intercept =5.6, slope = – 1
B)
y–intercept =5.6, slope = 0
C)
y–intercept =5.6, slope = x
D)
y–intercept =5.6, slope = 1
A
Compute the specified sum of squares.
88)
^
The regression equation for the data below is y= 6.18286 + 4.33937x.
x 9 7 2 3 4 22 17
y 43 35 16 21 23 102 81
SSR
88)
A)
6421.83
B)
6531.37
C)
13.4790
D)
6544.86
B
Obtain the linear correlation coefficient for the data. Round your answer to three decimal places.
89)
The data below show the test scores (y) of 6 randomly selected students and the number of hours
(x) they studied for the test.
x 5 10 4 6 10 9
y 64 86 69 86 59 87
89)
A)
0.678
B)
–0.678
C)
0.224
D)
–0.224
C
B
Provide an appropriate response.
90)
Which of the following statements concerning the linear correlation coefficient are true?
A: If the linear correlation coefficient for two variables is zero, then there is no relationship between
the variables.
B: If the slope of the regression line is negative, then the linear correlation coefficient is negative.
C: The value of the linear correlation coefficient always lies between –1 and 1.
D: A linear correlation coefficient of 0.62 suggests a stronger linear relationship than a linear
correlation coefficient of –0.82.
90)
A)
A and D
B)
B and C
C)
C and D
D)
A and B
Use the regression equation to predict the y–value corresponding to the given x–value. Round your answer to the nearest
tenth.
91)
^
Nine pairs of data yield the regression equation y= 19.4 + 0.93x. Predict y for x =51.
91)
A)
66.8
B)
79.6
C)
64.7
D)
57.8
Obtain the linear correlation coefficient for the data. Round your answer to three decimal places.
92)
x 37.4 44.5 12.5 14.2 19.5
y 8 7 7 5 8
92)
A)
0
B)
0.403
C)
–0.359
D)
–0.403
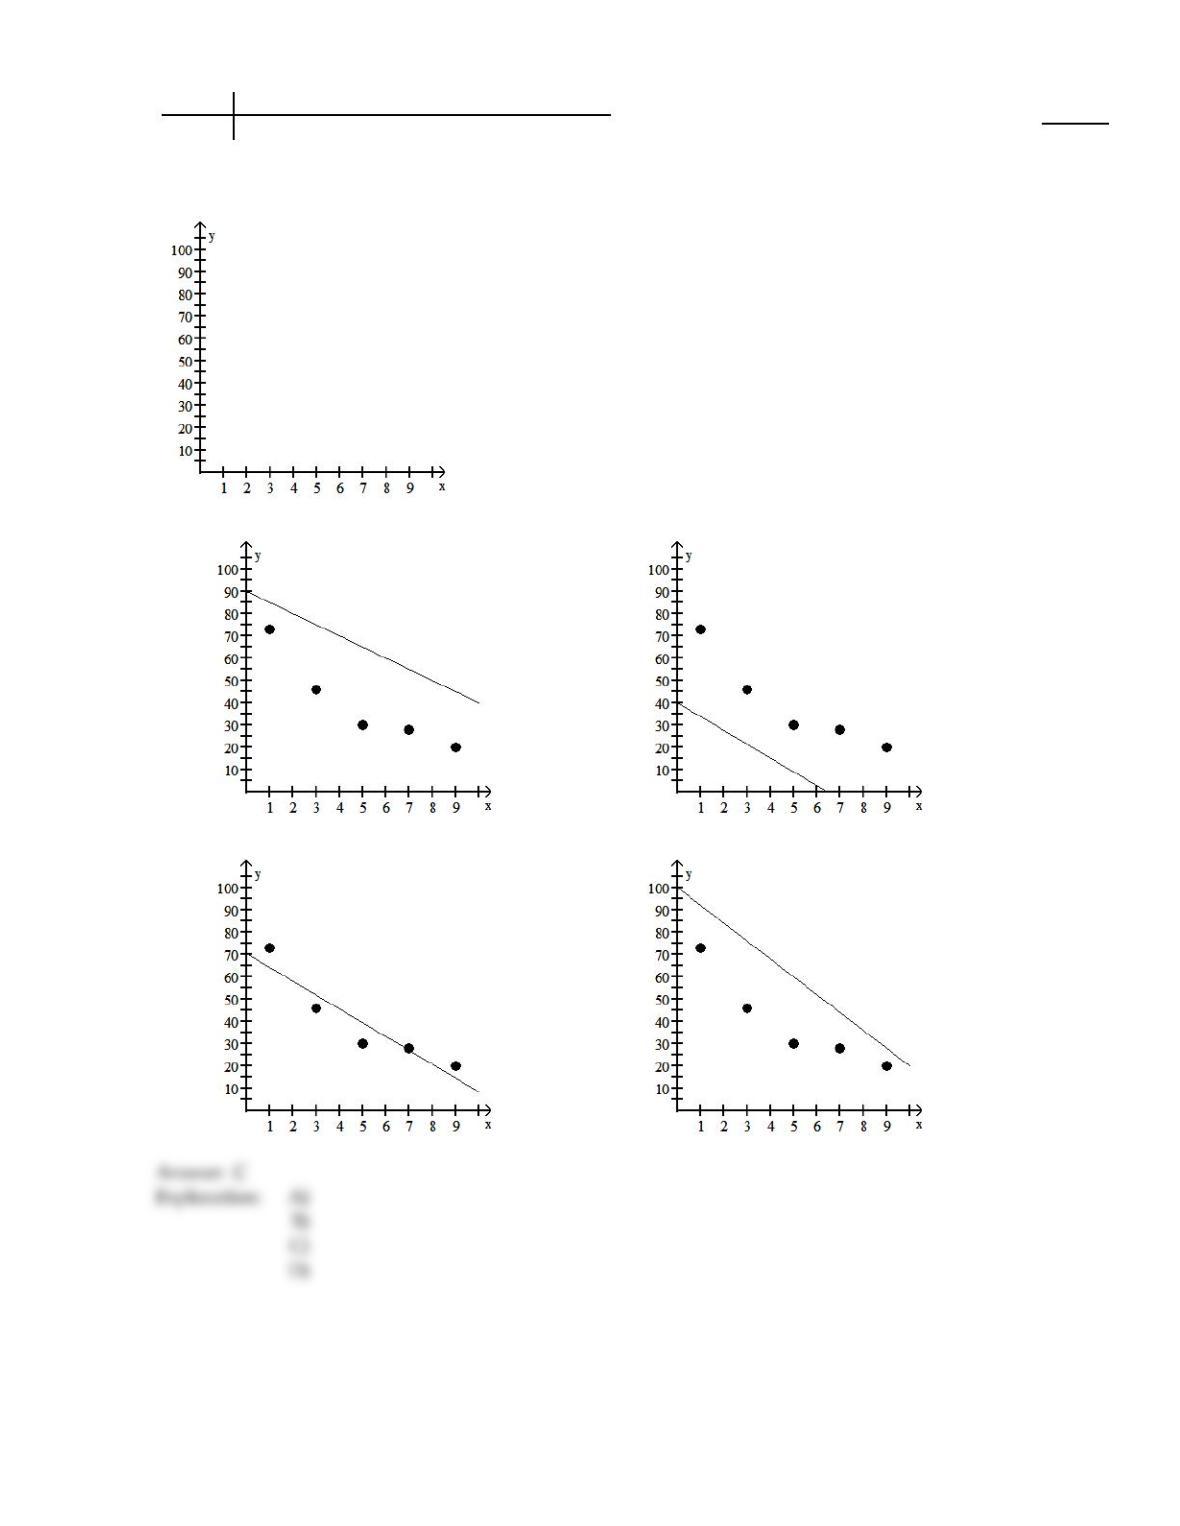
The regression equation for the given data points is provided. Graph the regression equation and the data points.
35
93)
^
x 1 3 5 7 9
y73 46 30 28 20
y= 70.4 – 6.2x
93)
A)
B)
C)
D)
You are given information about a straight line. Use two points to graph the equation.
36
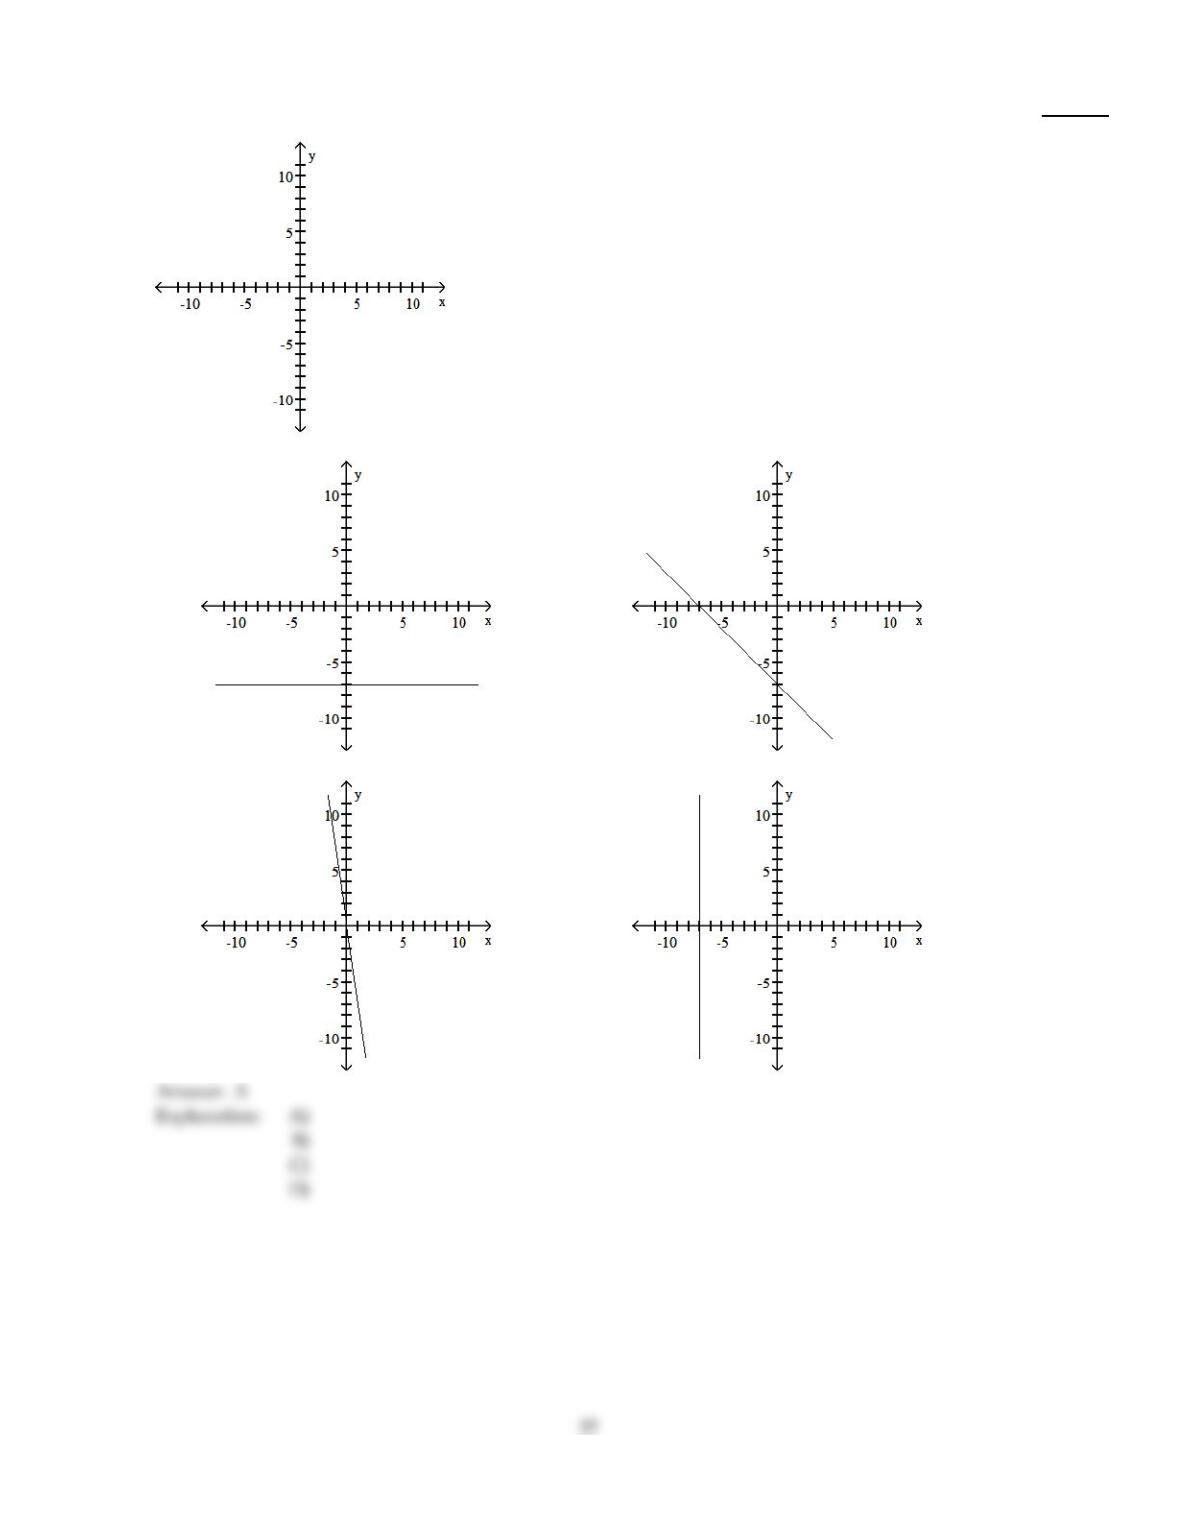
94)
The y–intercept is –7 and the slope is 0.
94)
A)
B)
C)
D)
The y–intercept and slope, respectively, of a straight line are given. Find the equation of the line.
95)
0 and –7.4
95)
A)
y =7.4x
B)
y = – 7.4
C)
y = – 7.4x
D)
y =7.4
Provide an appropriate response.
96)
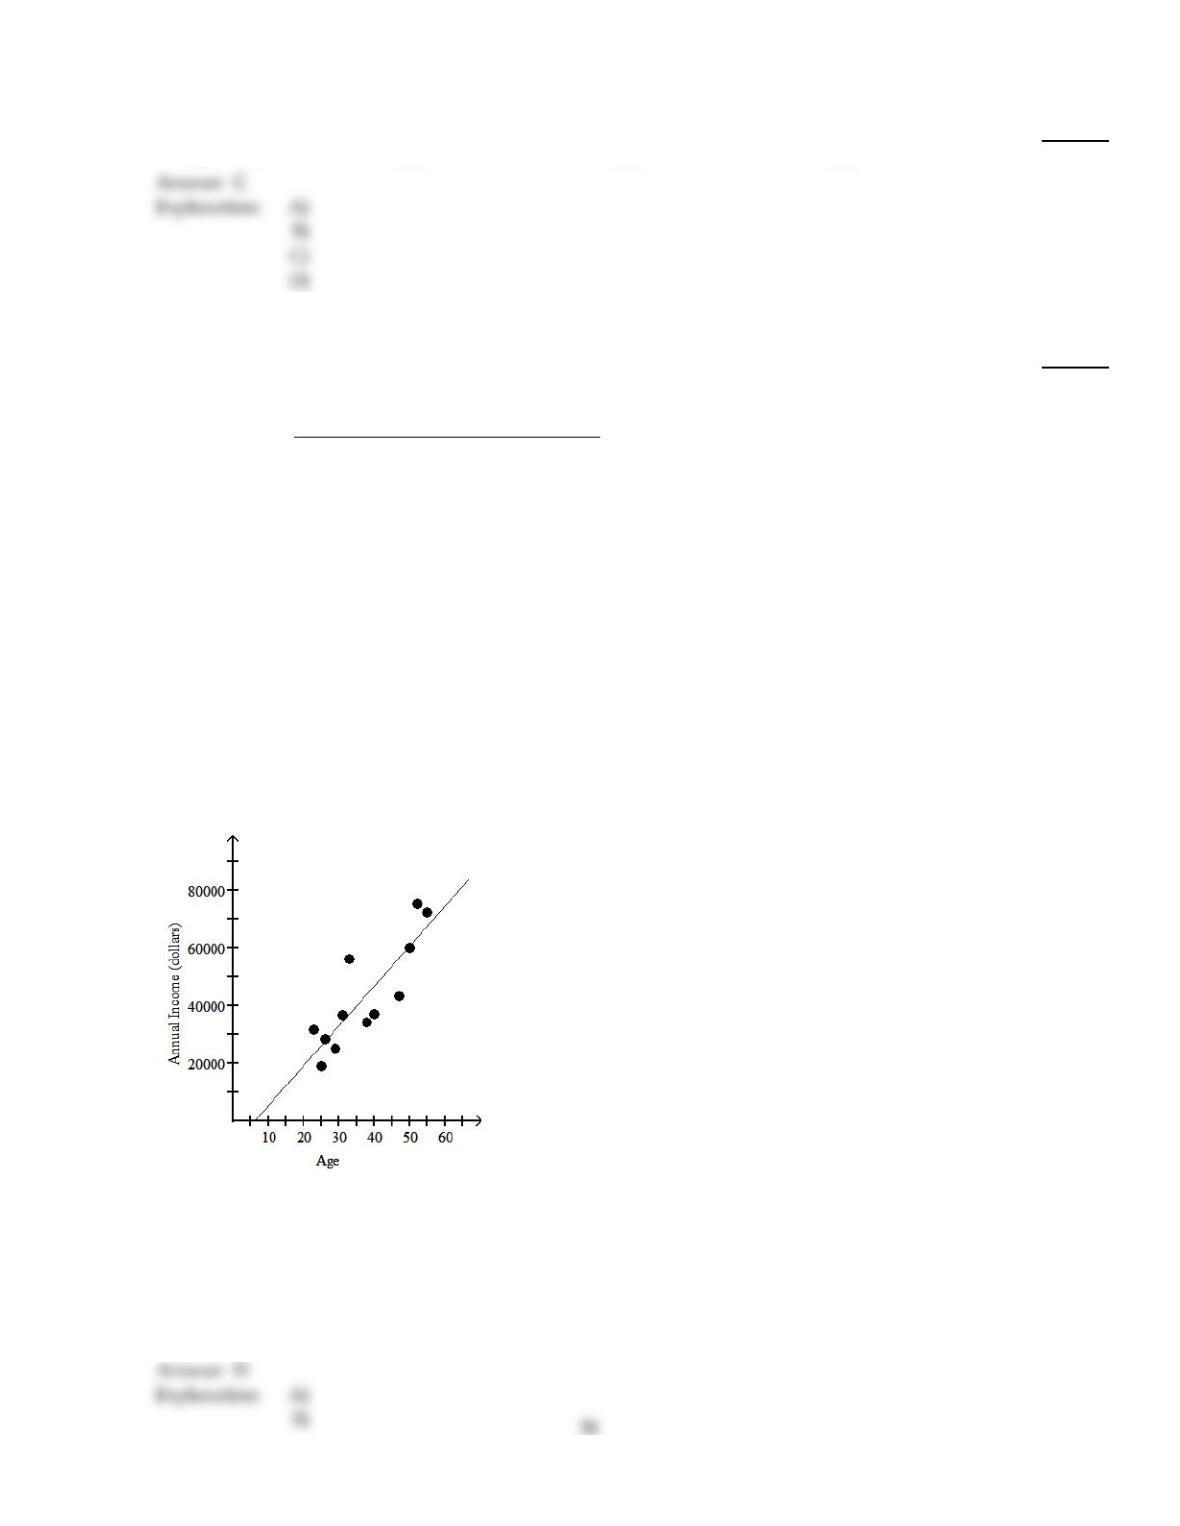
The table below shows the age and annual income of 12 randomly selected college graduates all
living in the city of Seattle.
Age Annual Income (dollars)
26 28,520
31 36,750
55 72,155
47 43,225
38 34,197
50 60,030
29 25,005
23 31,625
33 55,975
40 37,064
52 75,082
25 19,055
The scatterplot and regression line are graphed below:
Would it be reasonable to use the regression equation to predict the annual income of a college
graduate in Seattle who is 90 years old? Explain your answer.
96)
A)
Yes; the regression line fits the data quite closely.
B)
No; regression equations can not be used to predict values for which there is no input data.
C)
No; the regression line does not fit the data very closely.
D)
No; 90 year olds are outside the age range of the data.
Obtain the linear correlation coefficient for the data. Round your answer to three decimal places.
97)
The data below show the cost of advertising (x), in thousands of dollars, and the number of
products sold (y), in thousands, for each of eight randomly selected product lines.
x 9 2 3 4 2 5 9 10
y 85 52 55 68 67 86 83 73
97)
A)
0.235
B)
0.246
C)
0.708
D)
–0.071
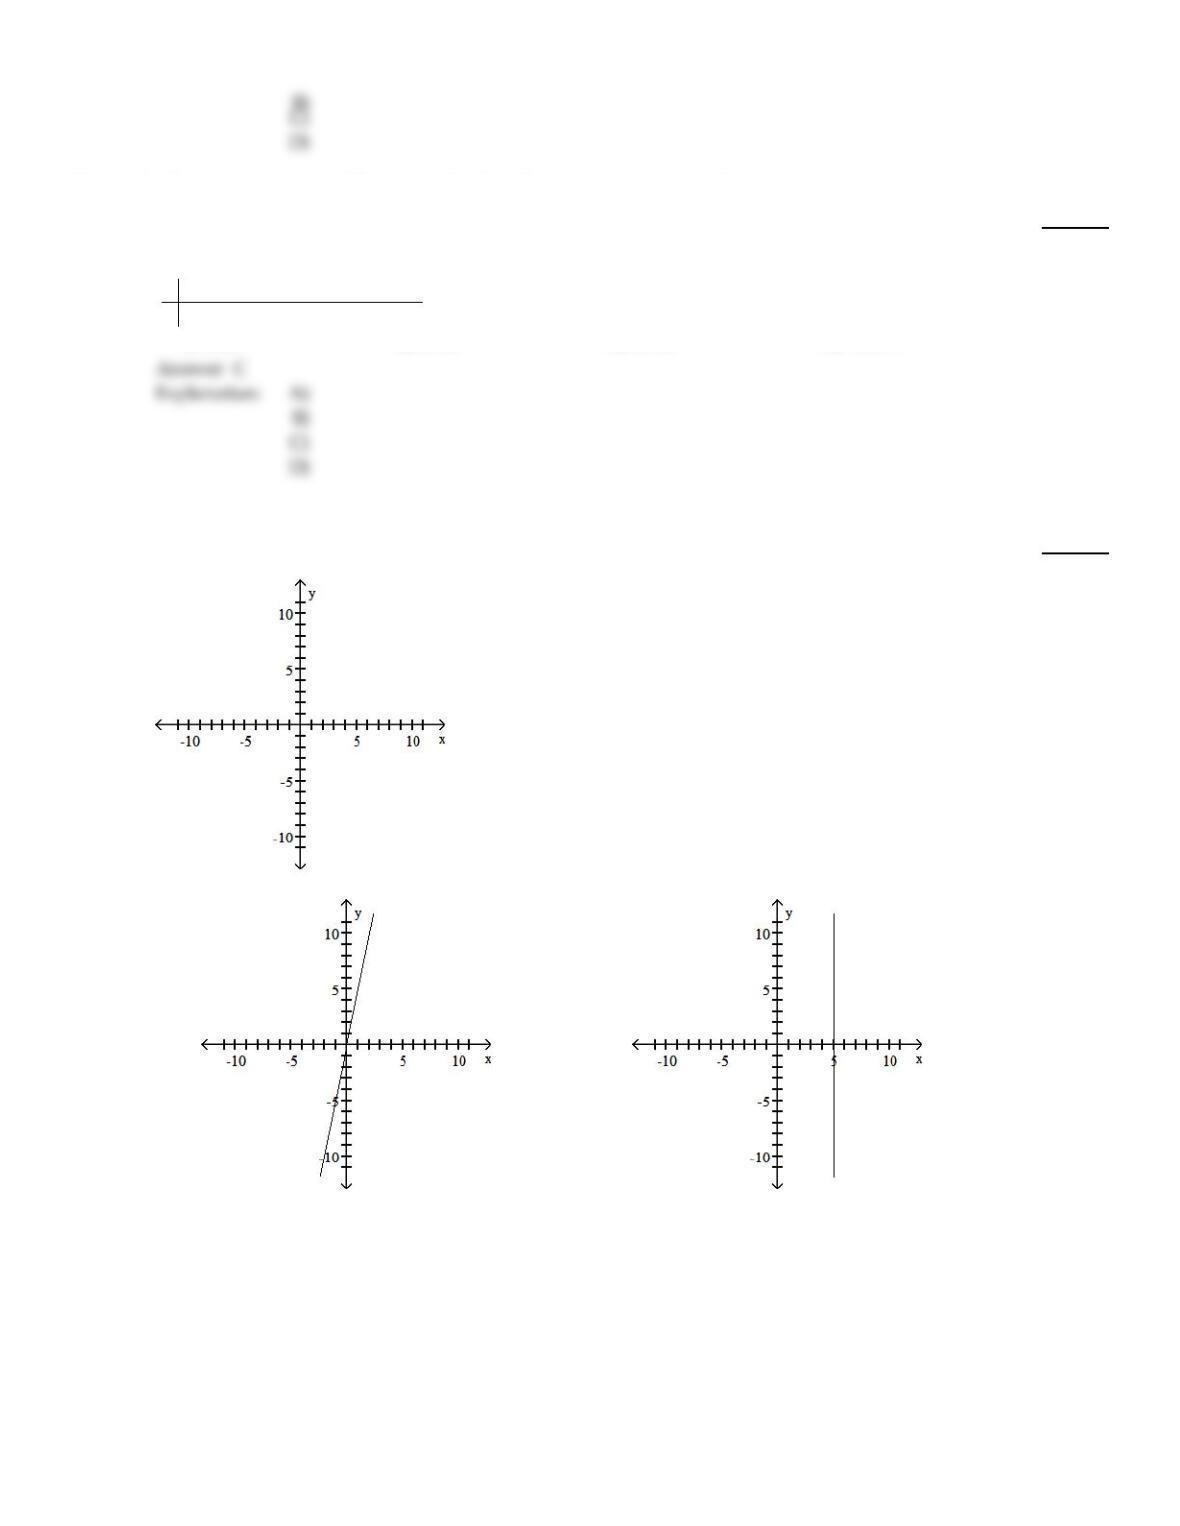
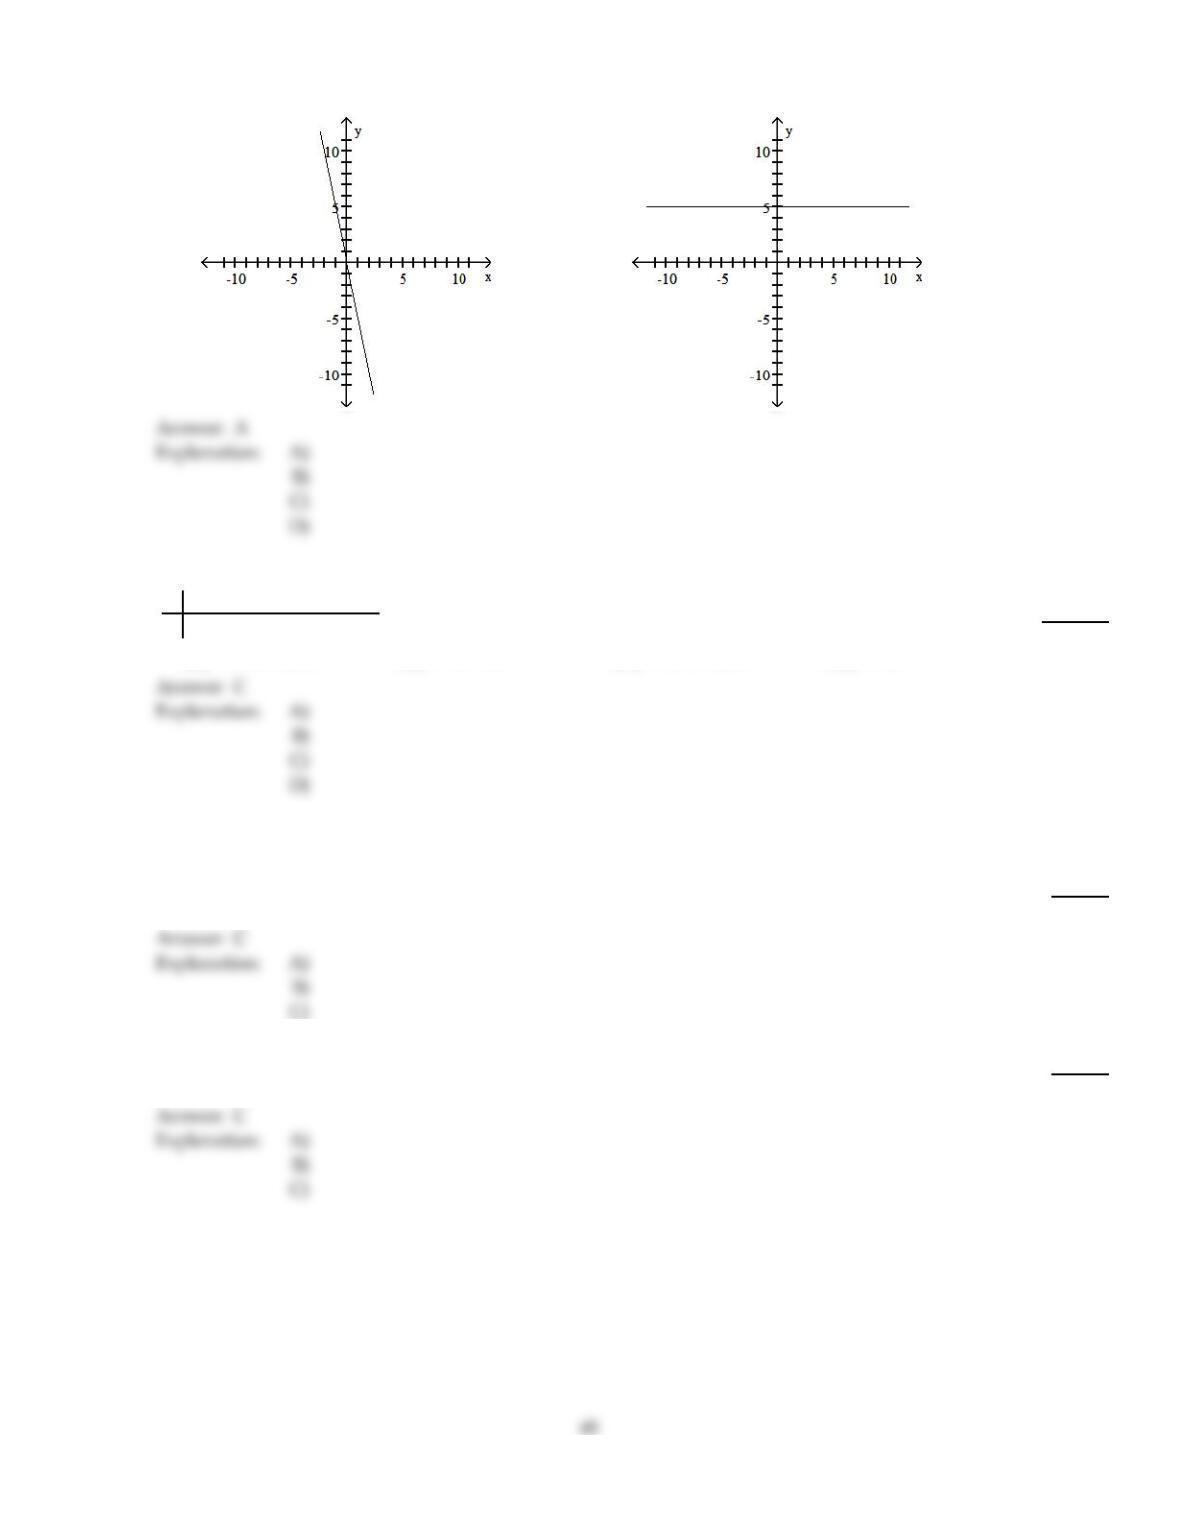
You are given information about a straight line. Use two points to graph the equation.
98)
The y–intercept is 0 and the slope is 5.
98)
A)
B)
39
C)
D)
Determine the regression equation for the data. Round the final values to three significant digits, if necessary.
99)
x 1.2 1.4 1.6 1.8 2.0
y54 53 55 54 56
99)
A)
^
y= 55.3 + 2.4x
B)
^
y= 50 + 3x
C)
^
y= 50.4 + 2.5x
D)
^
y= 54
You are given information about a straight line. Determine whether the line slopes upward, slopes downward, or is
horizontal.
100)
The equation of the line is y =4.
100)
A)
Slopes downward
B)
Slopes upward
C)
Is horizontal
101)
The equation of the line is y =3.58 – x.
101)
A)
Slopes upward
B)
Is horizontal
C)
Slopes downward