Obtain the linear correlation coefficient for the data. Round your answer to three decimal places.
102)
A study was conducted to compare the number of hours spent in the computer lab on an
assignment (x) and the grade on the assignment (y), for each of eight randomly selected students in
a computer class. The results are recorded in the table below.
x y
10 96
11 51
16 62
9 58
7 89
15 81
16 46
10 51
102)
A)
0.017
B)
–0.284
C)
0.462
D)
–0.335
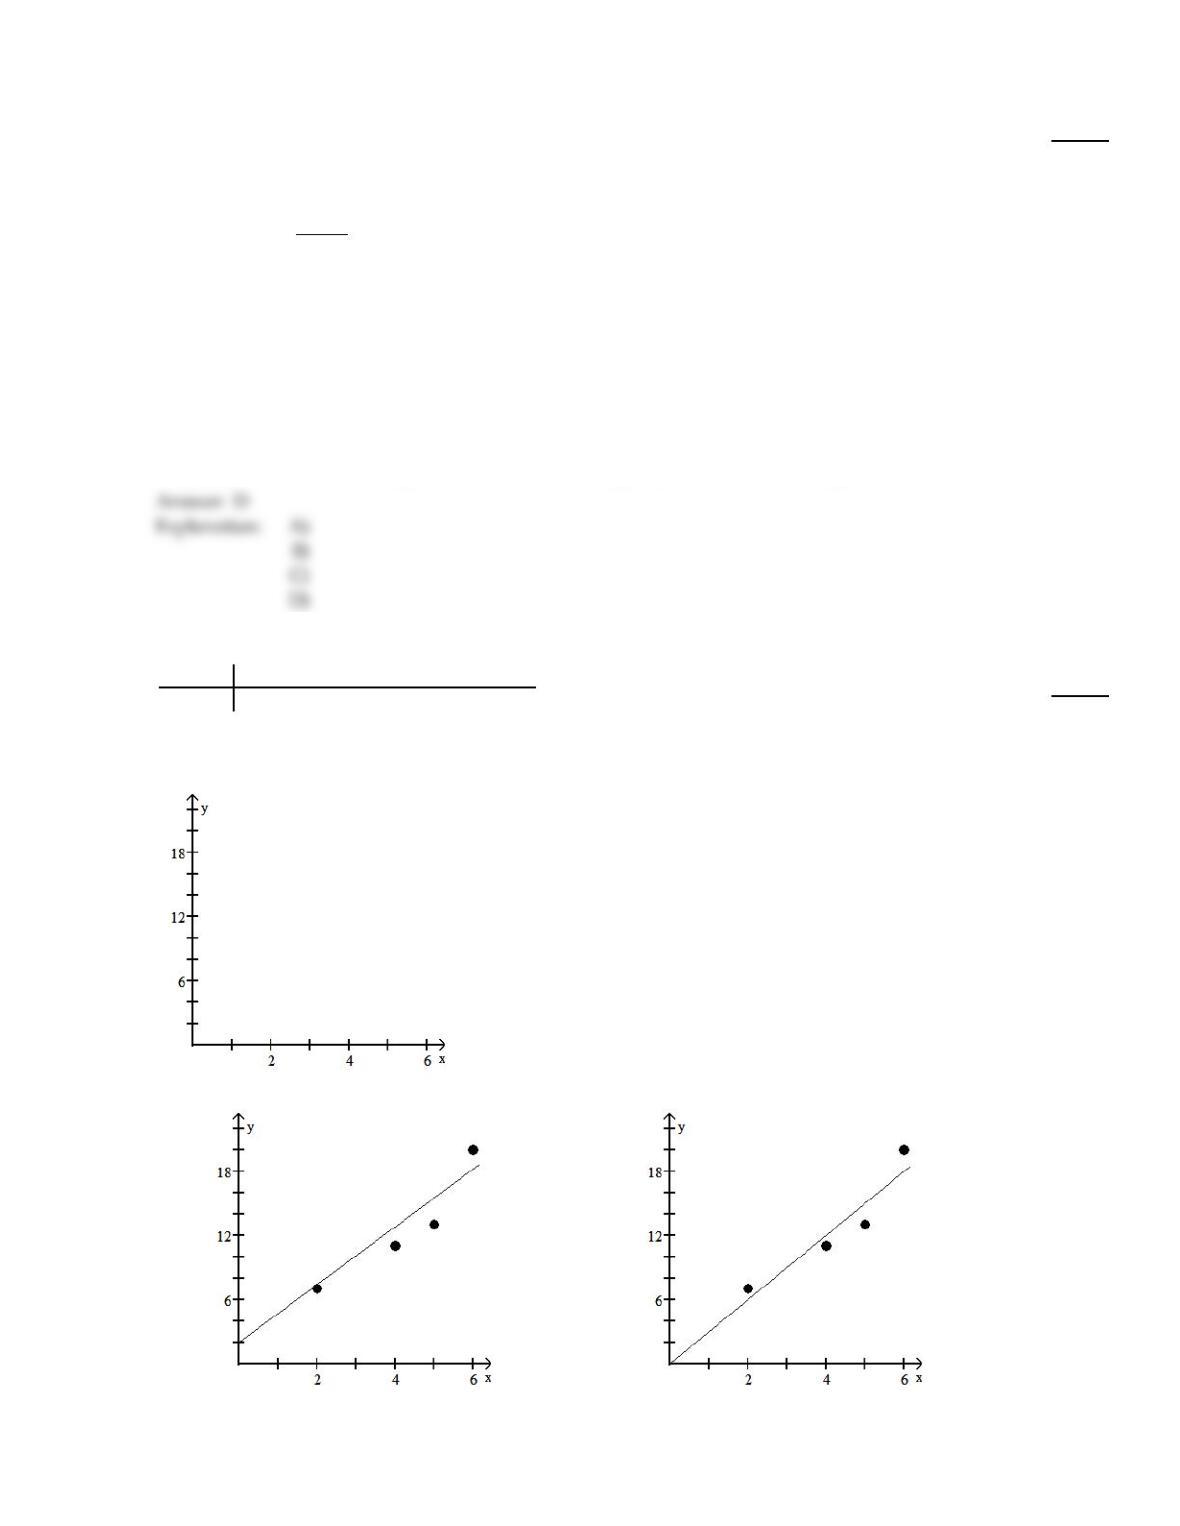
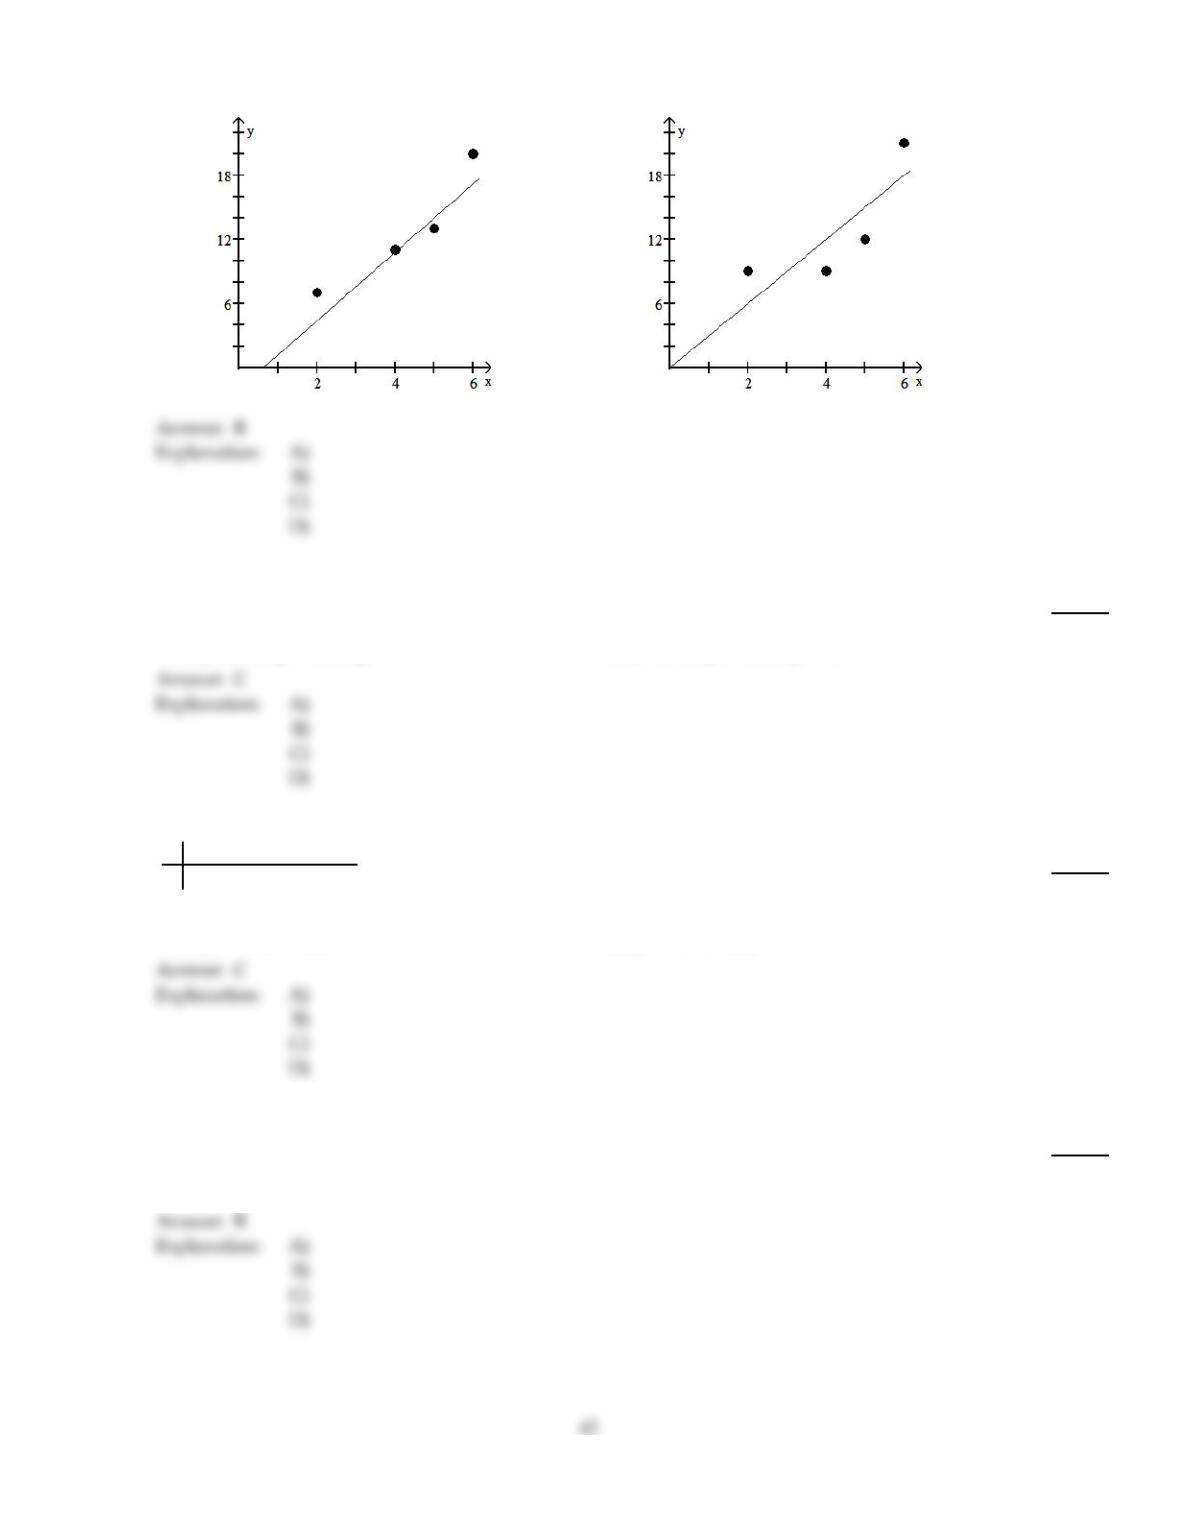
The regression equation for the given data points is provided. Graph the regression equation and the data points.
103)
^
x 2 4 5 6
y 7 11 13 20
y= 3.0x
103)
A)
B)
41
C)
D)
Determine the y–intercept and slope of the linear equation.
104)
y =4
104)
A)
y–intercept = – 4, slope = 0
B)
y–intercept =4, slope = 1
C)
y–intercept =4, slope = 0
D)
y–intercept = 0, slope =4
C
Determine the regression equation for the data. Round the final values to three significant digits, if necessary.
105)
x 24 26 28 30 32
y15 13 20 16 24
105)
A)
^
y= 11.8 + 0.950x
B)
^
y= – 11.8 + 0.950x
C)
^
y= – 11.8 + 1.05x
D)
^
y= 11.8 + 1.05x
C
Determine the y–intercept and slope of the linear equation.
106)
y =3.7x
106)
A)
y–intercept =3.7, slope = 0
B)
y–intercept = 0, slope =3.7
C)
y–intercept = 0, slope = – 3.7
D)
y–intercept =3.7, slope =3.7
B
B
A set of data points and the equations of two lines are given. For each line, determine e2. Then, determine which line
fits the set of data points better, according to the least–squares criterion.
107)
x 0 1 3 3 5
y 7 6 5 4 2
Line A: y = 7.5 – 0.9x
Line B: y = 8.0 – 1.1x
107)
A)
Line A: e2= 2.29
Line B: e2= 2.64
Line B fits the set of data points better.
B)
Line A: e2= 2.29
Line B: e2= 2.64
Line A fits the set of data points better.
C)
Line A: e2= 3.12
Line B: e2= 3.49
Line B fits the set of data points better.
D)
Line A: e2= 0.87
Line B: e2= 0.53
Line B fits the set of data points better.
Determine the y–intercept and slope of the linear equation.
108)
y =3.9 – 63.2x
108)
A)
y–intercept = – 63.2, slope =3.9
B)
y–intercept =3.9, slope = – 63.2
C)
y–intercept =3.9, slope =63.2
D)
y–intercept =63.2, slope =3.9
B
Compute the specified sum of squares.
109)
^
The regression equation for the data below is y= 3.000x.
x 2 4 5 6
y 7 11 13 20
SST
109)
A)
78.75
B)
88.75
C)
92.25
D)
10.00
B
B
Determine the regression equation for the data. Round the final values to three significant digits, if necessary.
110)
x 6 8 20 28 36
y 2 4 13 20 30
110)
A)
^
y= – 2.79 + 0.897x
B)
^
y= – 3.79 + 0.801x
C)
^
y= – 2.79 + 0.950x
D)
^
y= – 3.79 + 0.897x
111)
x 2 4 5 6
y 7 11 13 20
111)
A)
^
y= 0.15 + 3x
B)
^
y= 3x
C)
^
y= 2.8x
D)
^
y= 0.15 + 2.8x
Compute the coefficient of determination. Round your answer to four decimal places.
112)
A regression equation is obtained for a set of data points. It is found that the total sum of squares is
28.406, the regression sum of squares is 15.290, and the error sum of squares is 13.116.
112)
A)
0.4617
B)
0.8578
C)
0.5383
D)
1.8578
Compute the specified sum of squares.
113)
^
The data below consist of heights (x), in meters, and masses (y), in kilograms, of 6 randomly
selected adults. The regression equation is y= – 181.342 + 144.46x.
x 1.61 1.72 1.78 1.80 1.67 1.88
y54 62 70 84 61 92
SST
113)
A)
979.44
B)
1079.5
C)
100.06
D)
1119.3
Determine the y–intercept and slope of the linear equation.
114)
y = – 2+ 8x
114)
A)
y–intercept = – 2, slope =8
B)
y–intercept =8, slope = – 2
C)
y–intercept =8, slope =2
D)
y–intercept =2, slope =8
Provide an appropriate response.
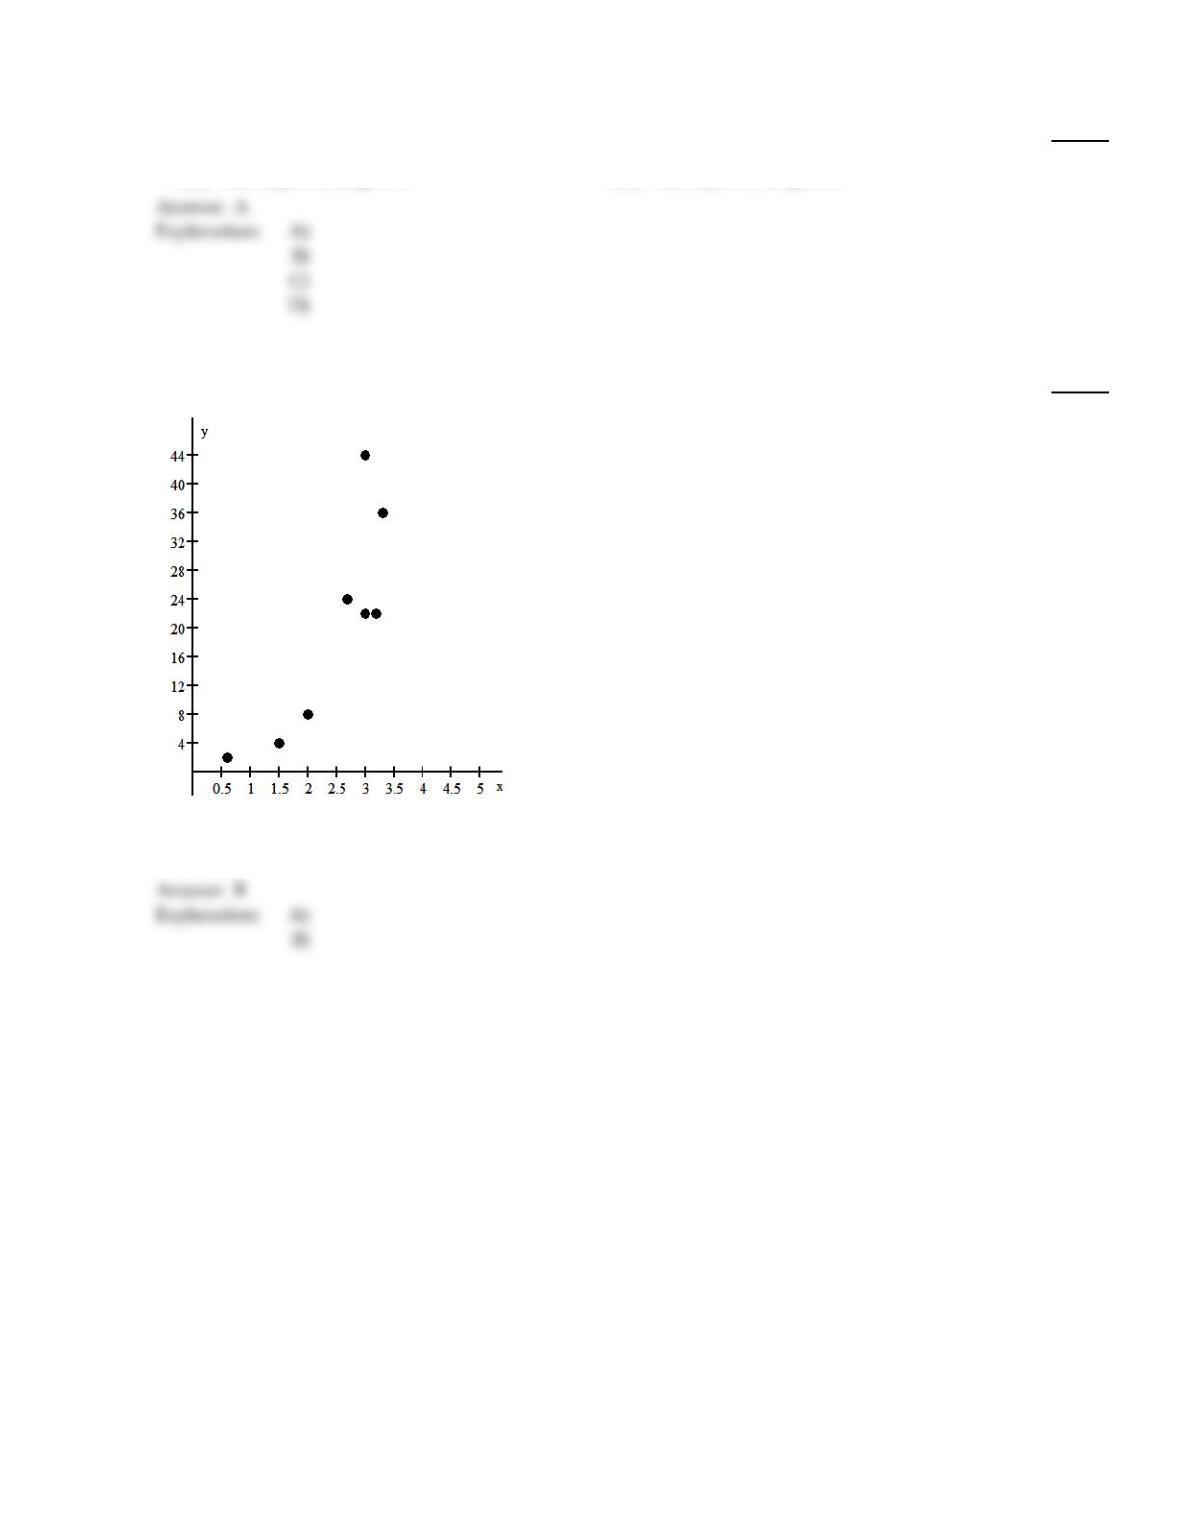
115)
The relationship between two quantities x and y is examined, and the association is shown in the
scatterplot below.
Could a regression line be reasonably used to describe this data?.
115)
A)
Yes
B)
No
B
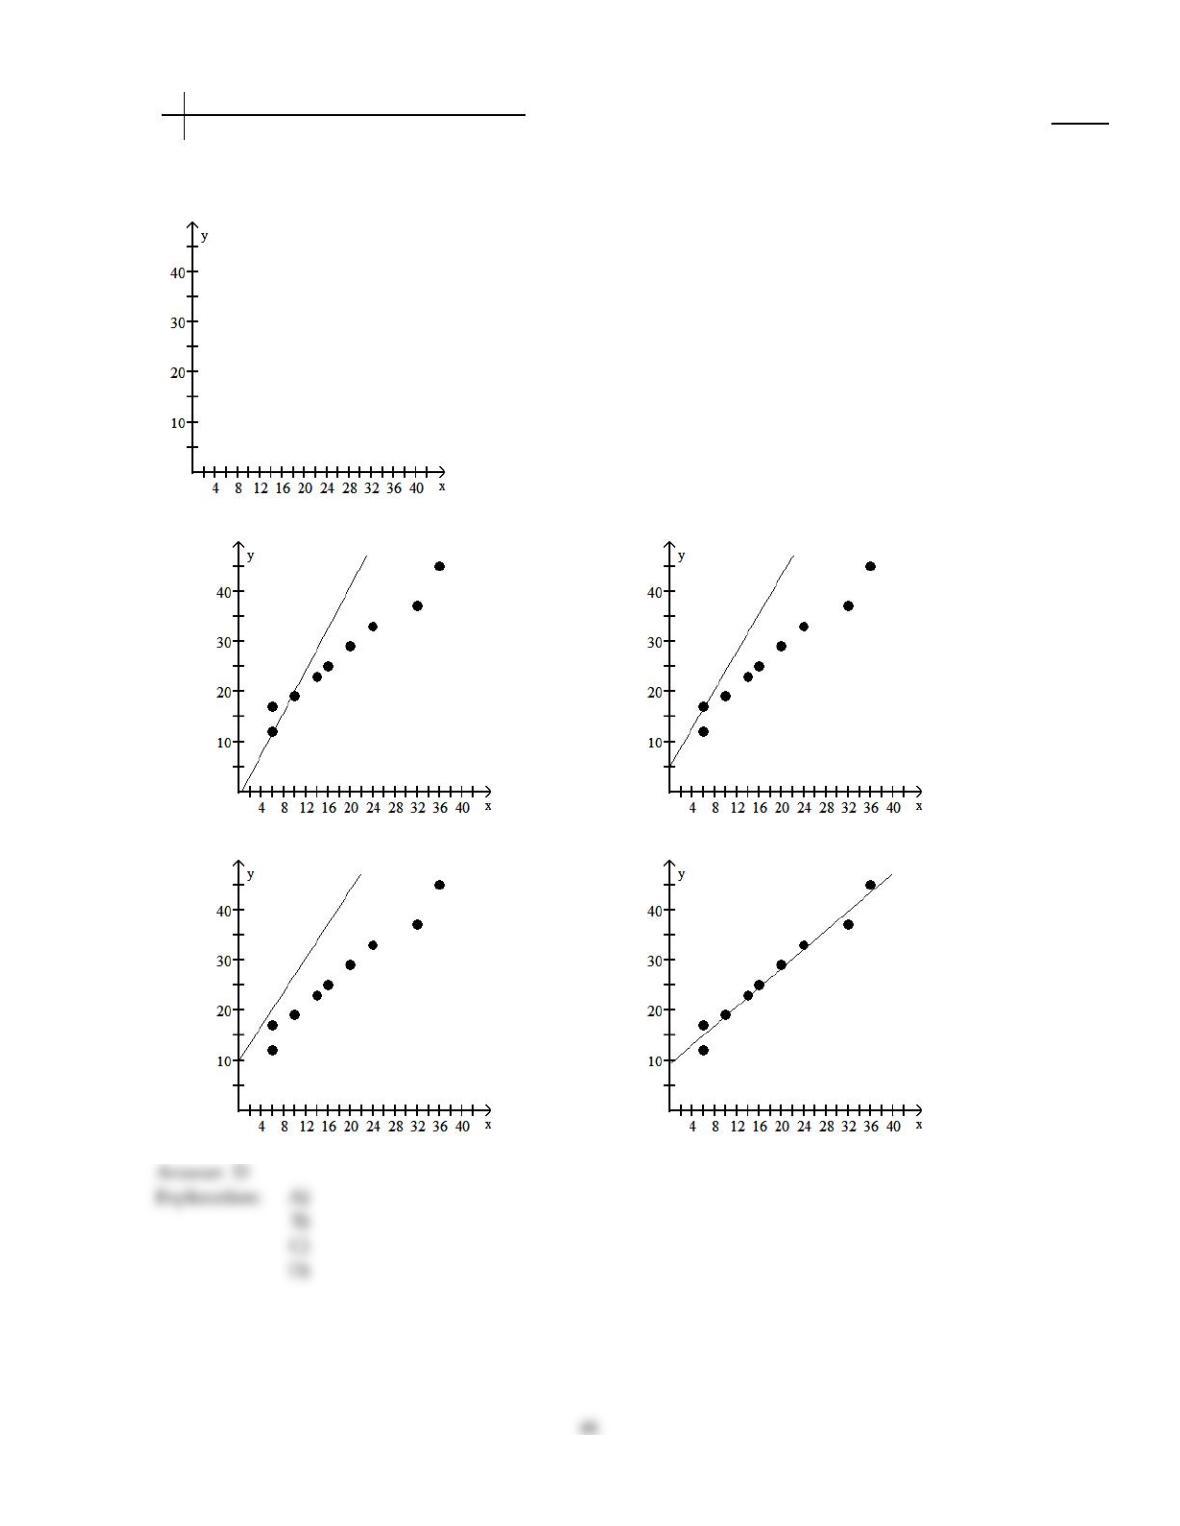
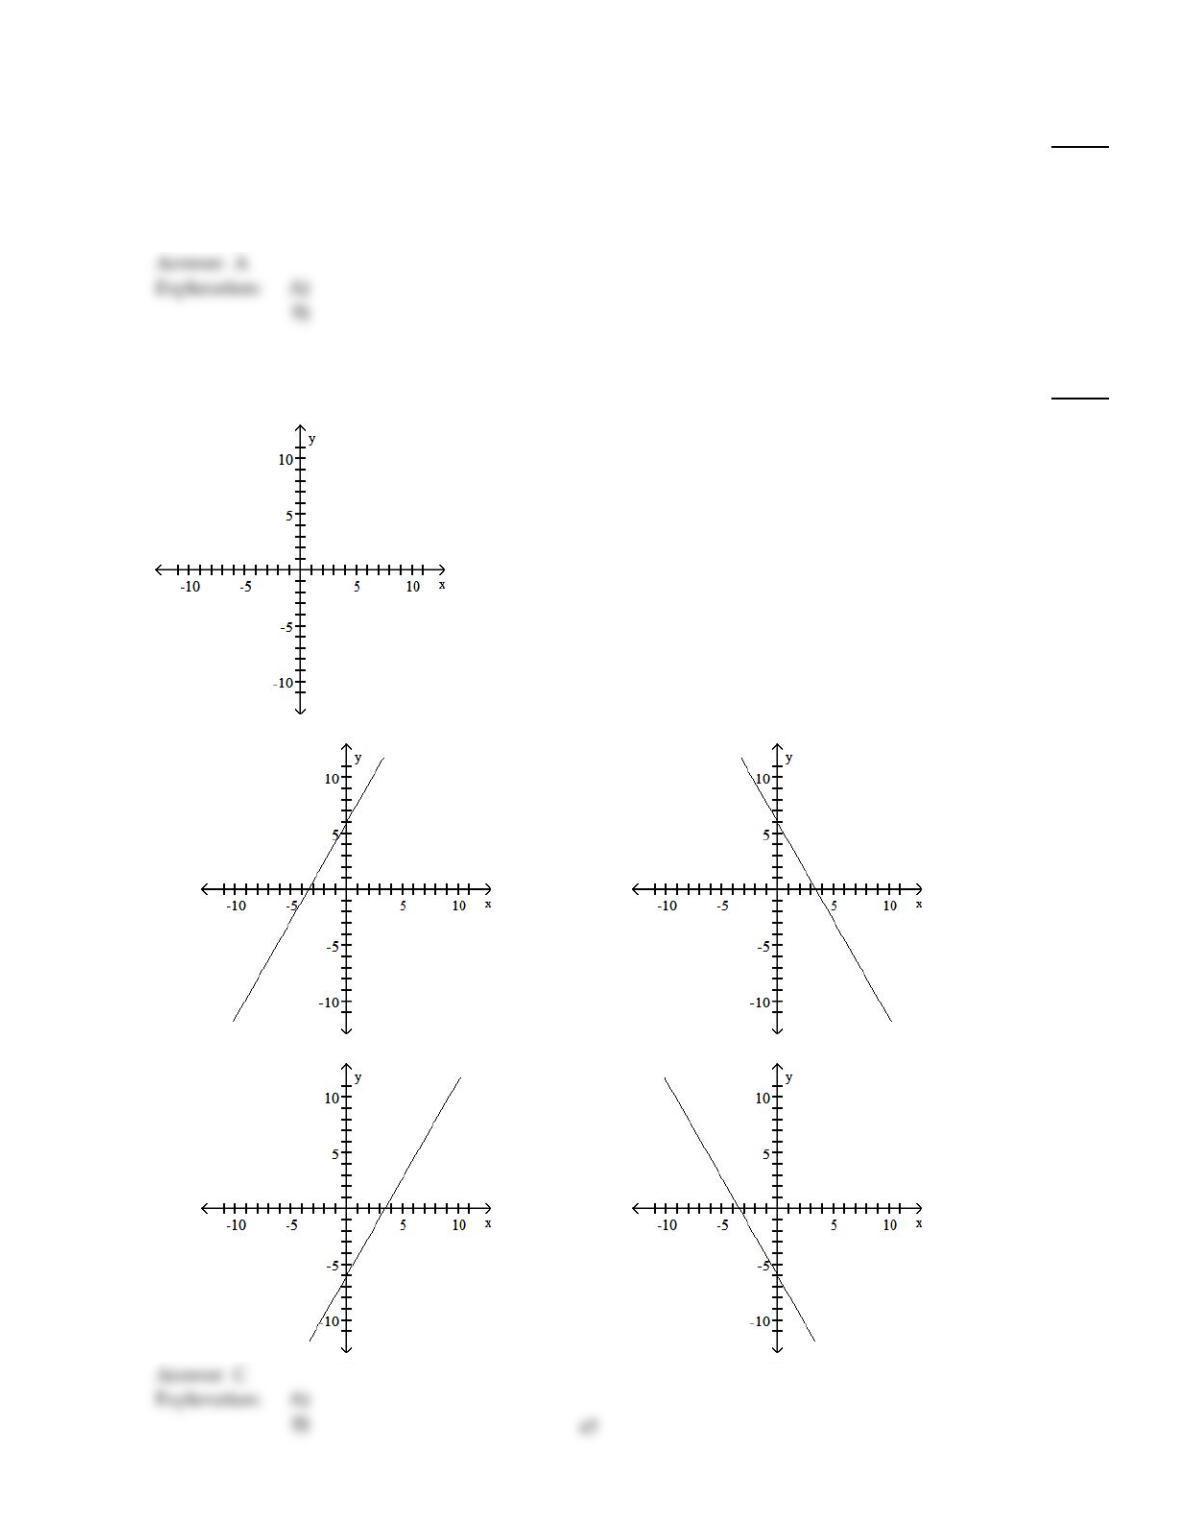
The regression equation for the given data points is provided. Graph the regression equation and the data points.
45
A
116)
^
x 10 14 20 6 6 14 16 24 32 36
y 19 23 29 12 17 23 25 33 37 45
y= 9.3 + 0.95x
116)
A)
B)
C)
D)
Provide an appropriate response.
117)
^
For a particular regression analysis, the following regression equation is obtained: y= 8.3x + 32,
where x represents the number of hours studied for a test and y represents the score on the test.
True or false? If the coefficient of determination is 0.976, the number of hours studied is very useful
for predicting the test score.
117)
A)
True
B)
False
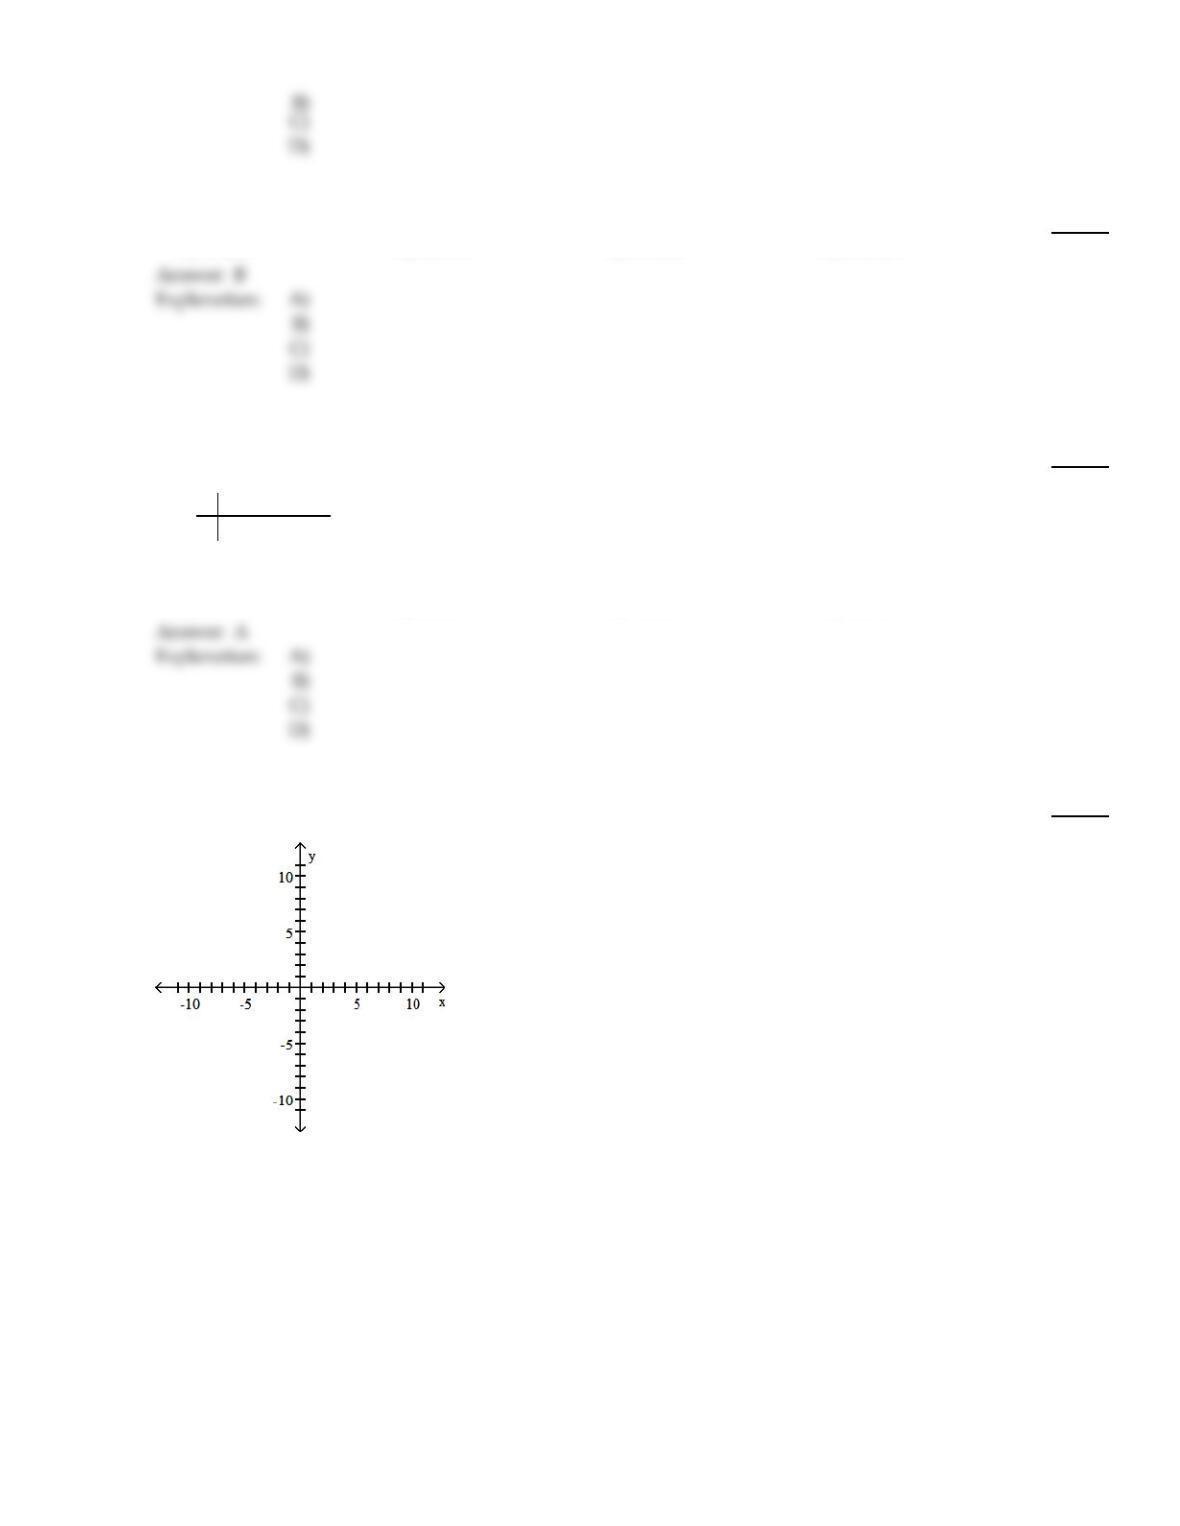
You are given information about a straight line. Use two points to graph the equation.
118)
The equation of the line is y = – 6+ 1.75x.
118)
A)
B)
C)
D)
Compute the coefficient of determination. Round your answer to four decimal places.
119)
For a particular regression analysis, it is found that SST =721.5 and SSE =277.7.
119)
A)
0.3849
B)
0.6151
C)
0.7843
D)
2.5981
Compute the specified sum of squares.
120)
^
The regression equation for the data below is y= 3.000x.
x 2 4 5 6
y 7 11 13 20
SSR
120)
A)
78.75
B)
72.45
C)
10.00
D)
88.75
You are given information about a straight line. Use two points to graph the equation.
121)
The y–intercept is –1 and the slope is 1.
121)
48
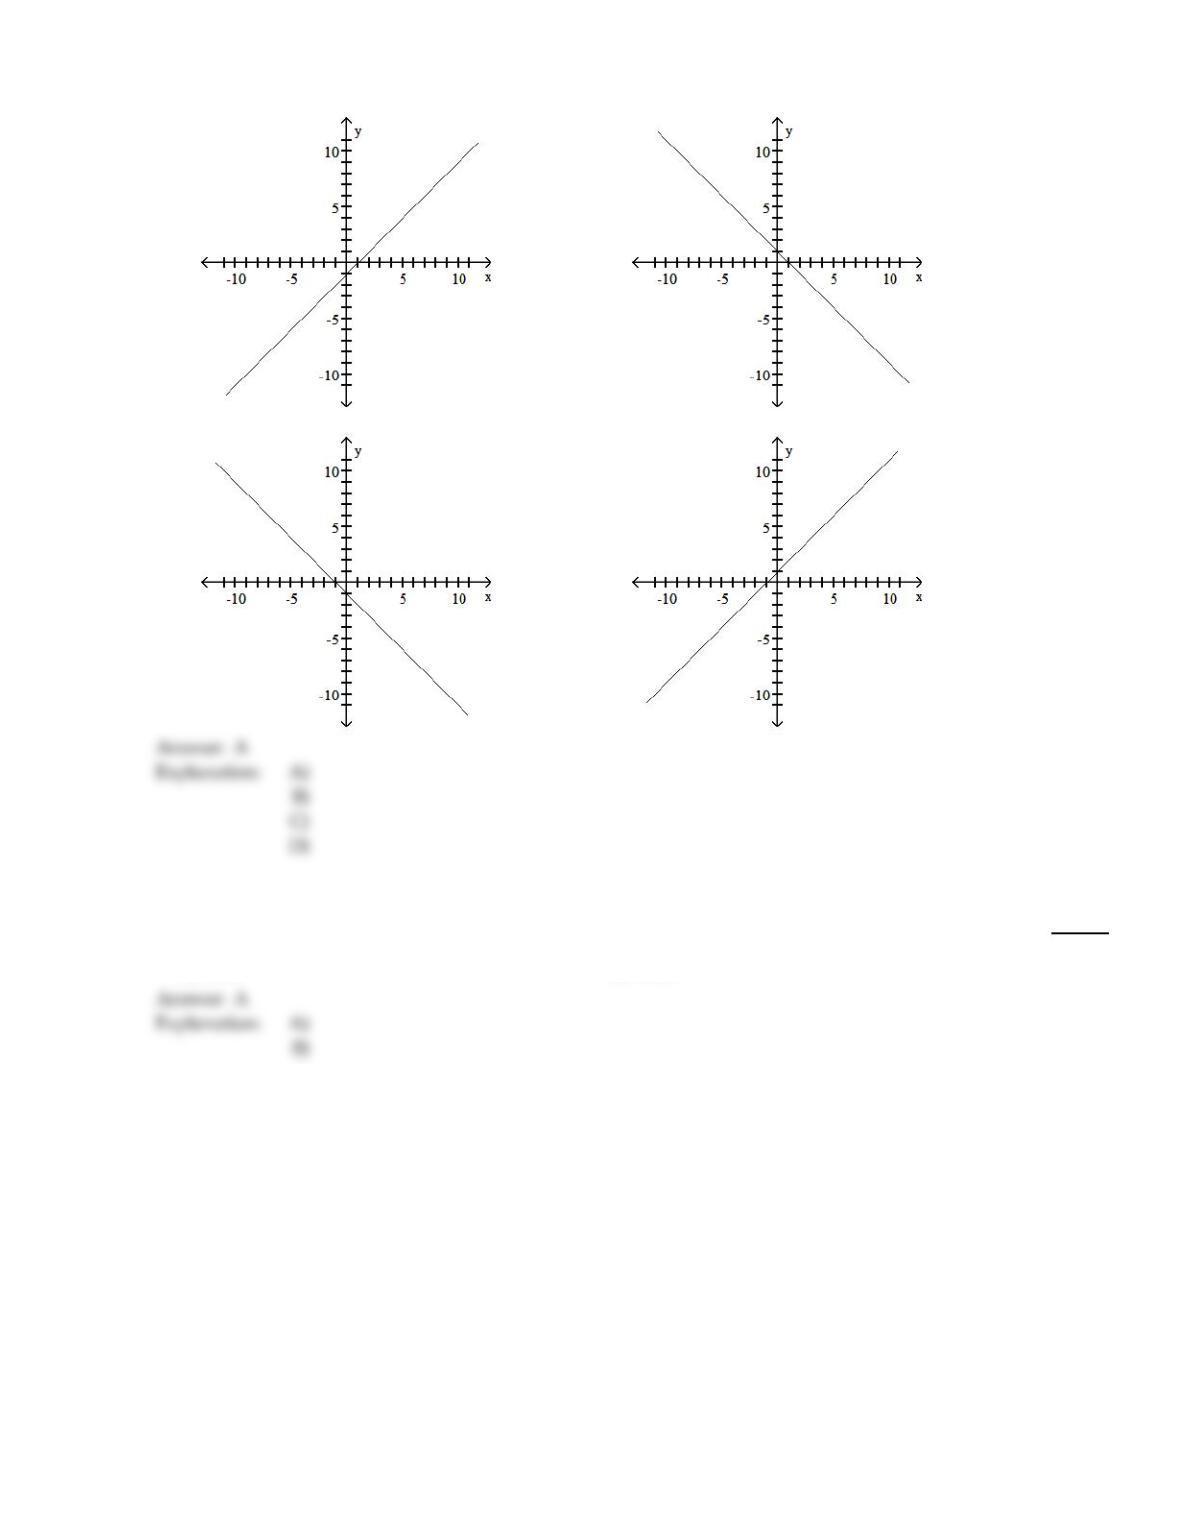
A)
B)
C)
D)
Provide an appropriate response.
122)
True or false? In the context of regression analysis, the regression sum of squares is the variation in
the observed values of the response variable explained by the regression.
122)
A)
True
B)
False
You are given information about a straight line. Use two points to graph the equation.
49
123)
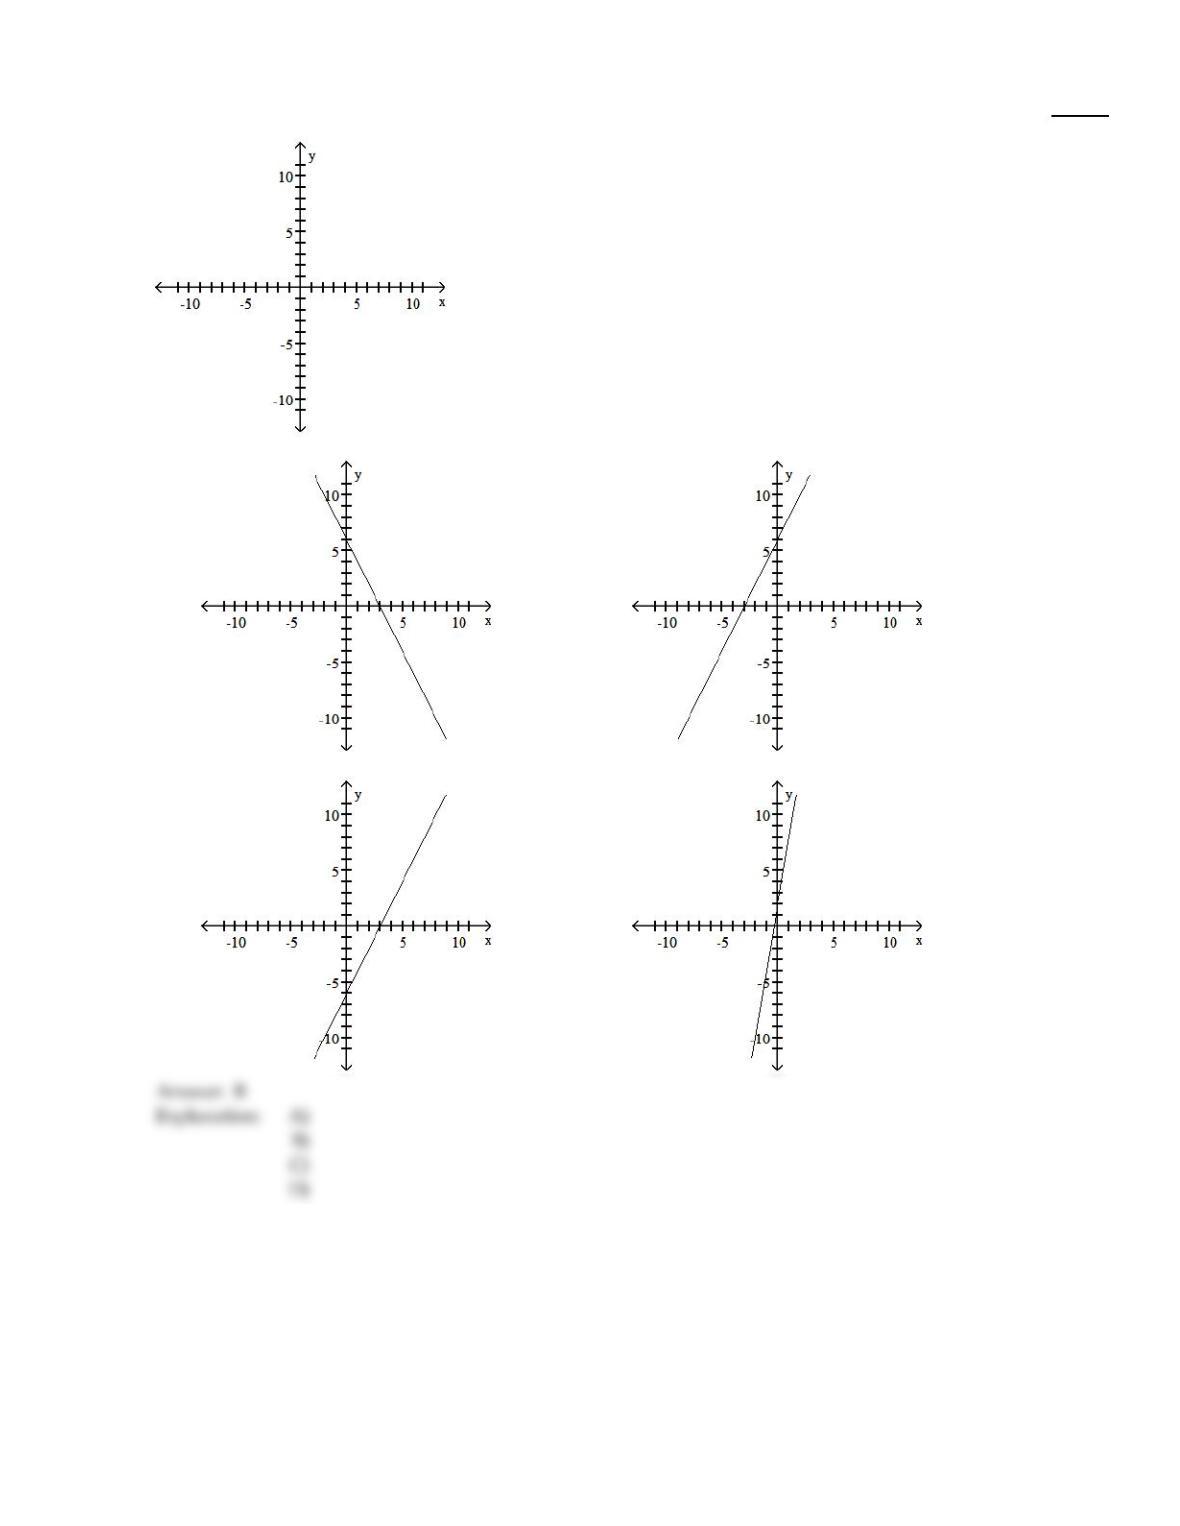
The equation of the line is y =6+ 2x.
123)
A)
B)
C)
D)
50
Obtain the linear correlation coefficient for the data. Round your answer to three decimal places.
124)
Two different tests are designed to measure employee productivity (x) and dexterity (y). Several
employees are randomly selected and tested with these results. Calculate the linear correlation
coefficient r. Can you conclude from the value of r alone that the variables x and y are linearly
related?
x
y
23 25 28 21 21 25 26 30 34 36
49 53 59 42 47 53 55 63 67 75
124)
A)
0.986; No
B)
0.972 No
C)
0.986; Yes
D)
0.972;Yes
The y–intercept and slope, respectively, of a straight line are given. Find the equation of the line.
125)
–5 and –6
125)
A)
y – 6x = – 5
B)
y = – 5+ 6x
C)
y = – 5x – 6
D)
y = – 5– 6x
Obtain the linear correlation coefficient for the data. Round your answer to three decimal places.
126)
The data below show the temperature (x) and the amount a plant grew (y), in millimeters, for each
of nine randomly selected days. Calculate the linear correlation coefficient r. Can you conclude
from the value of r alone that the variables x and y are unrelated?
x 62 76 50 51 71 46 51 44 79
y 36 39 50 13 33 33 17 616
126)
A)
0.038; Yes
B)
0.038; No
C)
0.196; No
D)
0.196; Yes
Compute the specified sum of squares.
127)
^
The data below consist of test scores (y) and hours of preparation (x) for 5 randomly selected
students. The regression equation is y= 44.8447 + 3.52427x.
x 5 2 9 6 10
y 64 48 72 73 80
SSR
127)
A)
511.724
B)
87.4757
C)
599.200
D)
498.103
Determine the percentage of variation in the observed values of the response variable that is explained by the regression.
Round to the nearest tenth of a percent if needed.
128)
x 9 2 3 4 2 5 9 10
y 85 52 55 68 67 86 83 73
128)
A)
23.5%
B)
24.6%
C)
50.1%
D)
70.8%
You are given information about a straight line. Determine whether the line slopes upward, slopes downward, or is
horizontal.
129)
The equation of the line is y = – 5.6 –7x.
129)
A)
Slopes upward
B)
Is horizontal
C)
Slopes downward
Determine the regression equation for the data. Round the final values to three significant digits, if necessary.
130)
x 0 3 4 5 12
y 8 2 6 9 12
130)
A)
^
y= 4.98 + 0.425x
B)
^
y= 4.88 + 0.625x
C)
^
y= 4.88 + 0.525x
D)
^
y= 4.98 + 0.725x
Obtain the linear correlation coefficient for the data. Round your answer to three decimal places.
131)
Two separate tests, x and y, are designed to measure a student’s ability to solve problems. Several
students are randomly selected to take both tests and their results are shown below.
x 48 52 58 44 43 43 40 51 59
y73 67 73 59 58 56 58 64 74
131)
A)
0.548
B)
0.109
C)
0.714
D)
0.867
Is the data point, P, an outlier, a potential influential observation, both, or neither?
132)
132)
A)
Neither
B)
Both
C)
Outlier
D)
Potential influential observation
Compute the specified sum of squares.
133)
^
The regression equation for the data below is y= 3.000x.
x 2 4 5 6
y 7 11 13 20
SSE
133)
A)
78.75
B)
88.75
C)
14.25
D)
10.00
Answer Key
Testname: C14
54
Answer Key
Testname: C14
55
Answer Key
Testname: C14
56
Answer Key
Testname: C14
57
Answer Key
Testname: C14
Answer Key
Testname: C14
Answer Key
Testname: C14