186)
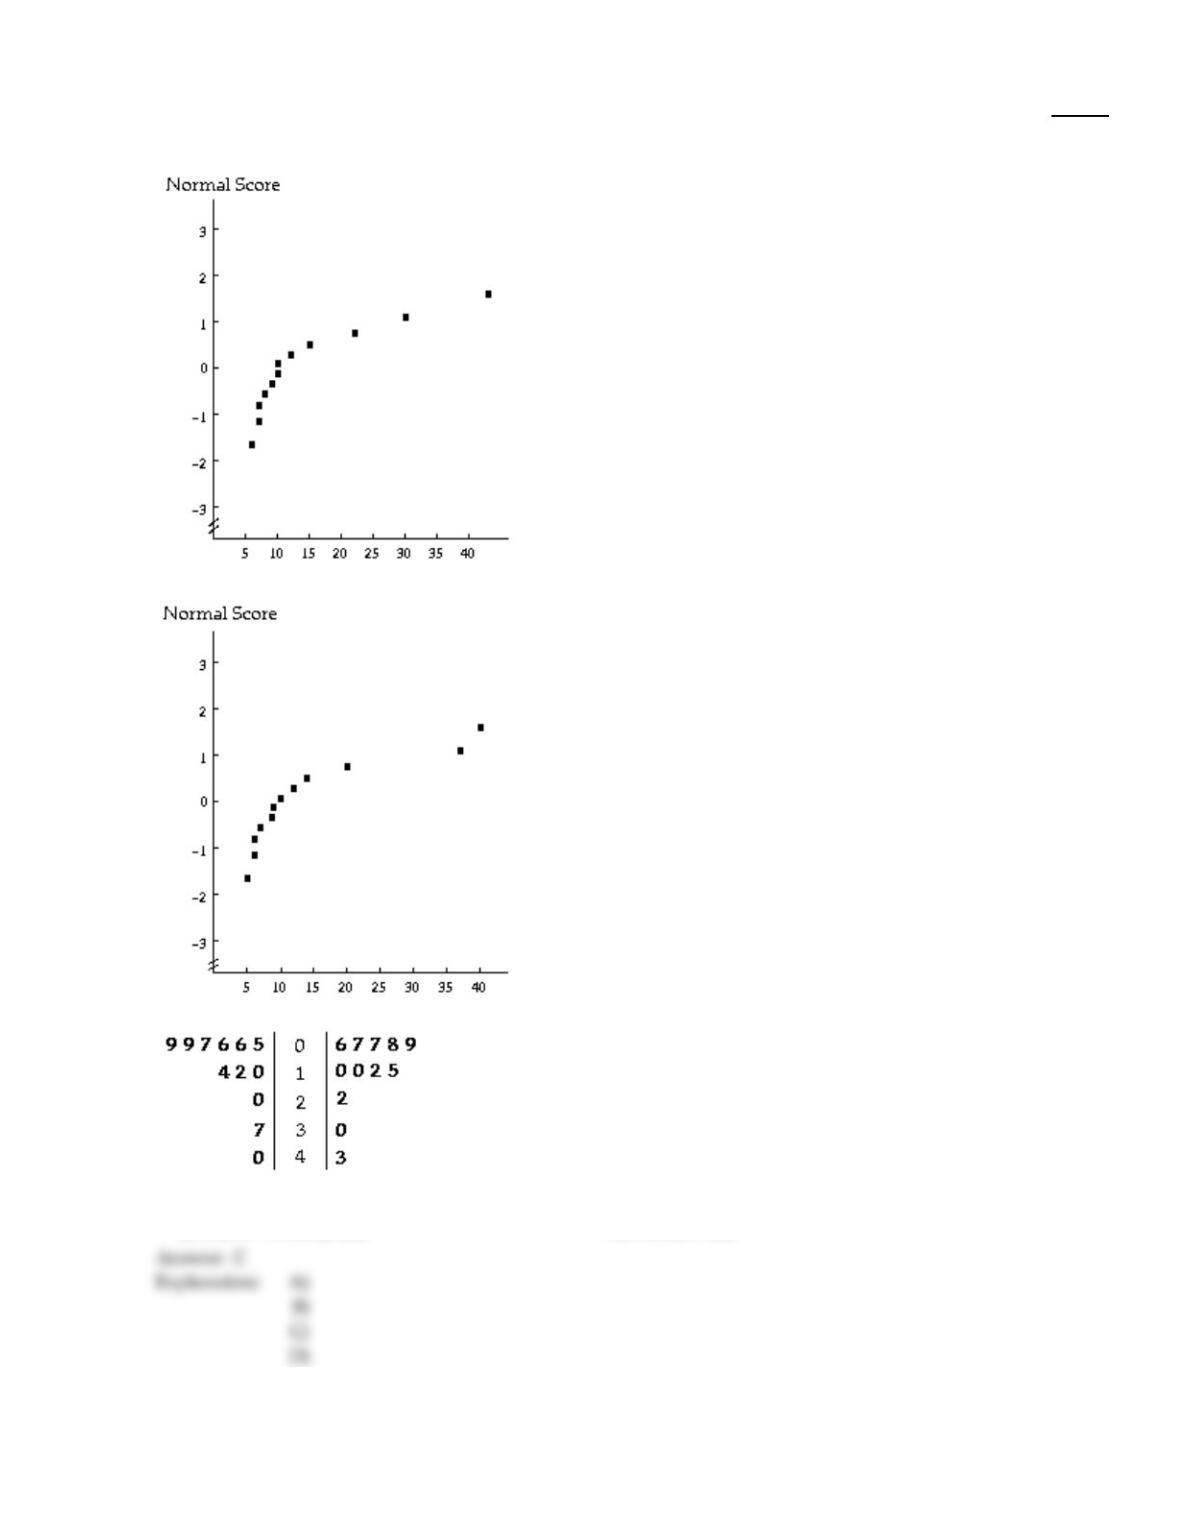
Independent; n1= 12 and n2= 12. A normal probability plot for each sample and a back–to–back
stem–and–leaf diagram are given below.
186)
A)
Pooled t–test
B)
Paired Wilcoxon signed–rank test
C)
Mann–Whitney test
D)
Paired t–test
81
Explanation:
Provide an appropriate response.
187)
Suppose that x is a variable on each of two populations. Independent samples of sizes 5 and 8,
respectively, are selected from the two populations. True or false? x1–x2 is normally distributed,
regardless of the distributions of the variable on the two populations.
187)
A)
True
B)
False
Solve the problem.
188)
A variable of two populations has a mean of 47 and a standard deviation of 13 for one of the
populations and a mean of 13 and a standard deviation of 15 for the other population. For
independent samples of sizes 8 and 12, respectively, find the mean of x1–x2.
188)
A)
34
B)
4.8
C)
60
D)
–34
Use the Mann–Whitney Table to find the critical values. For a left–tailed or two–tailed test, you will also need the relation
M1–A=n1(n1+n2+
1) –MA.
189)
n1= 8, n2= 5, significance level = 0.01, right–tailed test
189)
A)
72
B)
44
C)
65
D)
51
Solve the problem.
190)
The forced vital capacity (FVC) is often used by physicians to assess a person’s ability to move air in
and out of their lungs. It is the maximum amount of air that can be exhaled after a deep breath. A
researcher wants to perform a hypothesis test to determine whether the mean forced vital capacity
for women is less than the mean forced vital capacity for men. Identify the two populations for the
proposed hypothesis test.
190)
A)
Women with low forced vital capacity and women with high forced vital capacity
B)
Forced vital capacity values for women and forced vital capacity values for men
C)
Women and men
D)
Mean forced vital capacity for women and mean forced vital capacity for men
82
Apply the nonpooled t–interval procedure to obtain the required confidence interval. You may assume that the
assumptions for using the procedure are satisfied.
191)
A researcher was interested in comparing the resting pulse rates of people who exercise regularly
and people who do not exercise regularly. Independent simple random samples of 16 people ages
30–40 who do not exercise regularly and 12 people ages 30–40 who do exercise regularly were
selected, and the resting pulse rate (in beats per minute) of each person was measured. The
summary statistics are as follows.
Do Not Exercise Do Exercise
x1=72.4 x2=68.6
s1= 10.9 s2= 8.2
n1= 16 n2= 12
Determine a 95% confidence interval for the difference, µ1–µ2, between the mean pulse rate of
people who do not exercise and the mean pulse rate of people who do exercise.
191)
A)
–3.64 to 11.24 beats per minute
B)
–3.93 to 11.53 beats per minute
C)
–5.17 to 12.77 beats per minute
D)
–2.62 to 10.22 beats per minute
192)
A researcher was interested in comparing the heights of women in two different countries.
Independent simple random samples of 9 women from country A and 9 women from country B
yielded the following heights (in inches).
Country A Country B
64.1 65.3
66.4 60.2
61.7 61.7
62.0 65.8
67.3 61.0
64.9 64.6
64.7 60.0
68.0 65.4
63.6 59.0
Determine a 90% confidence interval for the difference, µ1–µ2, between the mean height of
women in country A and the mean height of women in country B.
(Note: x1= 64.744, x2= 62.556, s1= 2.192, s2= 2.697.)
192)
A)
0.16 to 4.22 inches
B)
–1.22 to 5.60 inches
C)
0.63 to 3.74 inches
D)
–0.83 to 5.2 inches
83
A type of sampling (independent or paired), sample size(s), and a figure showing the results of preliminary data analyses
on the sample(s) are provided. The intent is to employ the sample data to perform a hypothesis test to compare the means
of the two populations from which the data were obtained. Use the information provided to decide which procedure
should be applied.
193)
Independent; n1= 12 and n2= 12. A normal probability plot for each sample and a back–to–back
stem–and–leaf diagram are given below.
193)
84
7 5
6 3 2
5
2
7 5 2
7 2
2
3
4
5
6
7
8
4
2
2 5
0 5 7
1 2 5 7 9
A)
Pooled t–test
B)
Paired Wilcoxon signed–rank test
C)
Mann–Whitney test
D)
Consult a statistician
Provide an appropriate response.
194)
True or false? In the pooled t–test, sp2 is an estimate of the unknown population variance, 2, and
it is obtained by averaging the two sample variances.
194)
A)
True
B)
False
Explanation:
Summary statistics are given for independent simple random samples from two populations. Use the pooled t–interval
procedure to obtain the specified confidence interval.
195)
x1=72.3, s1=10.1, n1= 16, x2=69.9, s2=8.7, n2= 12
Determine a 90% confidence interval.
195)
A)
–3.81 to 8.61
B)
–4.46 to 9.26
C)
–2.39 to 7.19
D)
–1.60 to 6.40
Explanation:
Provide an appropriate response.
196)
Suppose that you want to perform a hypothesis test to compare the means of two populations
using independent simple random samples. Suppose that preliminary data analyses of the samples
suggest that the distribution of the variable under consideration is normal for one population and
uniform for the other. The sample sizes are 8 and 11. Should you use the pooled t–test, the
nonpooled t–test, the Mann–Whitney test, or none of these tests?
196)
A)
pooled t–test
B)
nonpooled t–test
C)
Mann–Whitney test
D)
none of these tests
Explanation:
85
Explanation:

Use the Mann–Whitney Table to find the critical values. For a left–tailed or two–tailed test, you will also need the relation
M1–A=n1(n1+n2+
1) –MA.
197)
n1= 4, n2= 7, significance level = 0.05, two–tailed test
197)
A)
13, 35
B)
31, 53
C)
33, 51
D)
15,33
Provide an appropriate response.
198)
A company which designs sports shoes has made an improvement to their popular running shoe.
They hope that athletes wearing the new running shoe will be able to run faster over short
distances. They will use a paired sample to determine whether the mean time to run 100 meters for
sprinters wearing the new running shoe is less than the mean time to run the 100 meters for
sprinters wearing the old running shoe. Identify the paired–difference variable for the proposed
hypothesis test.
198)
A)
Difference between mean time to run 100 meters for sprinters wearing the new running shoe
and mean time to run 100 meters for sprinters wearing the old running shoe
B)
Difference between time to run 100 meters for a randomly selected sprinter wearing the new
running shoe and time to run 100 meters for a randomly selected sprinter wearing the old
running shoe
C)
Difference between time to run 100 meters for a sprinter wearing the new running shoe and
time to run 100 meters for the same sprinter wearing the old running shoe
D)
Difference between time to run 100 meters for a sprinter wearing the new running shoe and
time to run 100 meters for the same sprinter after a training period
86
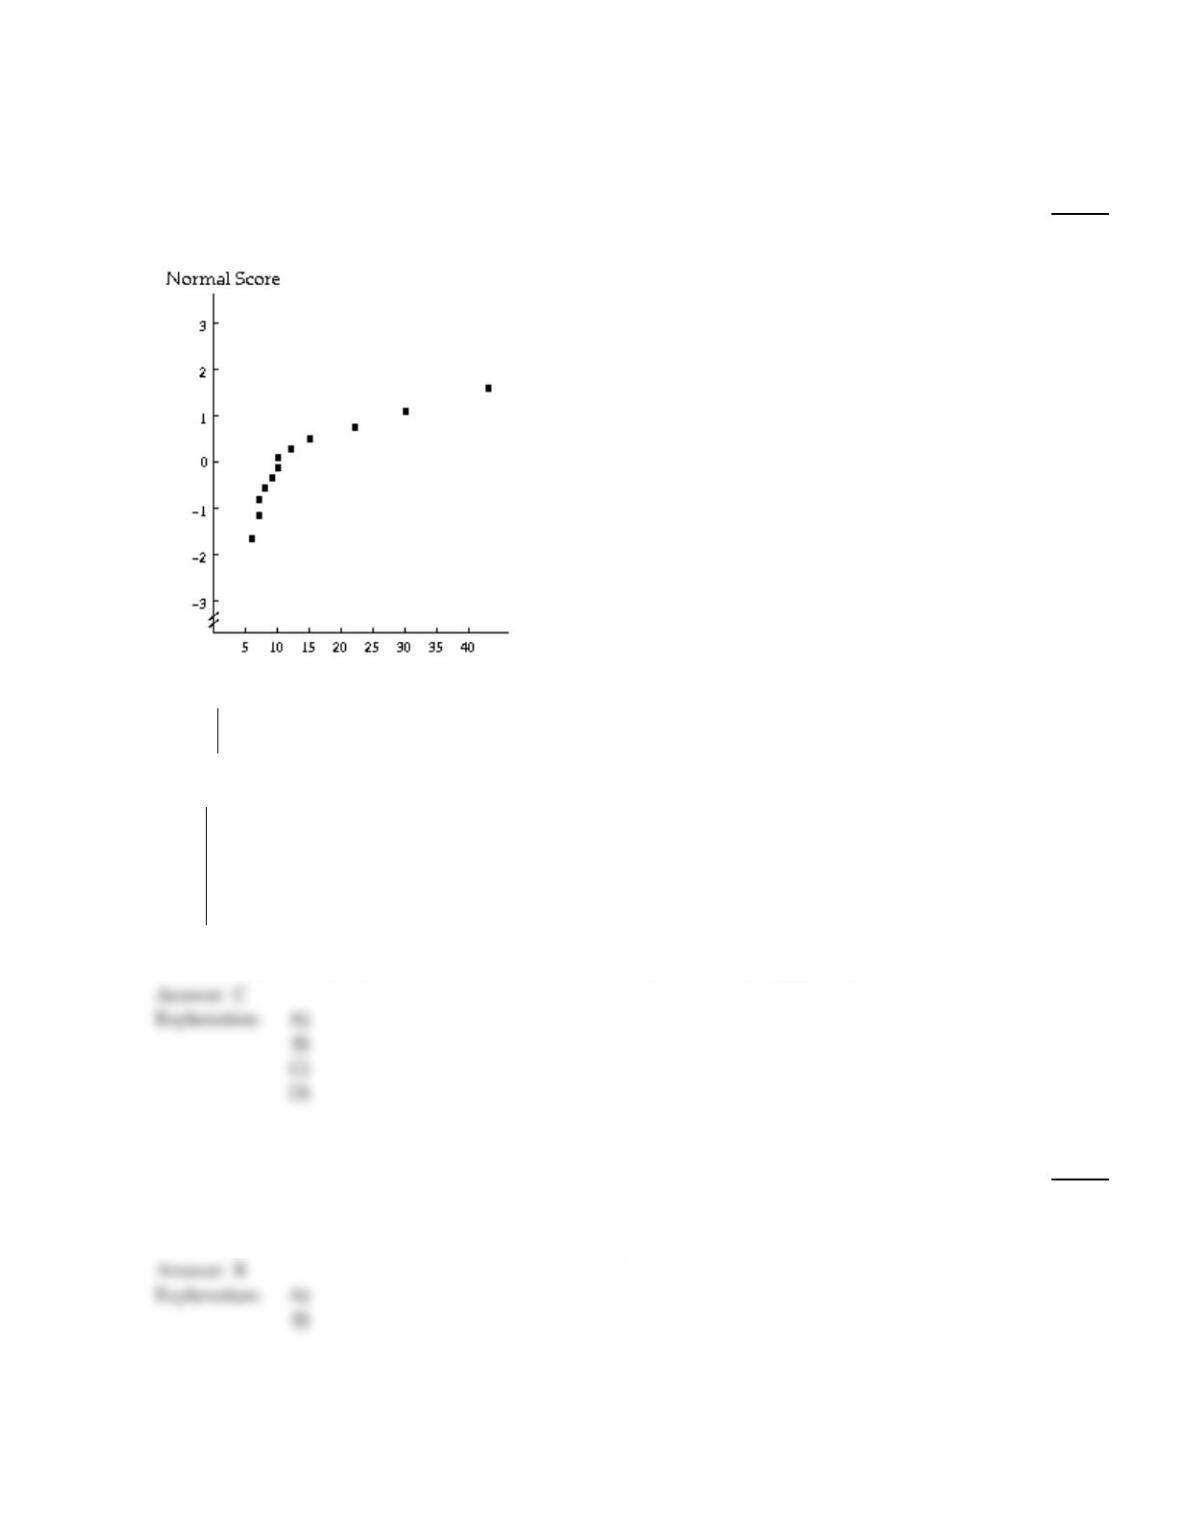
A type of sampling (independent or paired), sample size(s), and a figure showing the results of preliminary data analyses
on the sample(s) are provided. The intent is to employ the sample data to perform a hypothesis test to compare the means
of the two populations from which the data were obtained. Use the information provided to decide which procedure
should be applied.
199)
Paired; n = 12 . A normal probability plot and a stem–and–leaf diagram for the paired differences
are given below.
Paired Difference
0 6 7 7 8 9
0
1
2
3
4
6 7 7 8 9
0 0 2 5
2
0
3
199)
A)
Mann–Whitney test
B)
Paired t–test
C)
Consult a statistician
D)
Paired Wilcoxon signed–rank test
Provide an appropriate response.
200)
Suppose that you want to perform a hypothesis test to compare the means of two populations
using a paired sample. True or false? If the paired–difference variable is normally distributed, the
paired Wilcoxon signed–rank test will be more powerful than the paired t–test.
200)
A)
True
B)
False
Explanation:
87
Explanation:
A confidence interval (CI) for the difference µ1–µ2 between two population means is given. Interpret the confidence
interval.
201)
98% CI from 196 to 284
201)
A)
We can be 98% confident that µ1–µ2 lies somewhere between 196 and 284. Equivalently, we
can be 98% confident that µ1 is somewhere between 196 and 284 greater than µ2.
B)
We can be 98% confident that µ2–µ1 lies somewhere between 196 and 284. Equivalently, we
can be 98% confident that µ2 is somewhere between 196 and 284 greater than µ1.
C)
We can be 98% confident that µ1 and µ2 both lie somewhere between 196 and 284.
D)
We can be 98% confident that µ1–µ2 lies somewhere between 196 and 284. Equivalently, we
can be 98% confident that µ1 is somewhere between 196 and 284 less than µ2.
Determine the null and alternative hypotheses for the proposed hypothesis test.
202)
A researcher wants to perform a hypothesis test to determine whether the mean length of
marriages in California differs from the mean length of marriages in Texas.
202)
A)
Let µ1 denote the mean length of marriages in California and let µ2 denote the mean length of
marriages in Texas. The null and alternative hypotheses are H0: µ1µ2 and Ha: µ1=µ2.
B)
Let µ1 denote the mean length of marriages in California and let µ2 denote the mean length of
marriages in Texas. The null and alternative hypotheses are H0: µ1=µ2 and Ha: µ1µ2.
C)
Let x1 denote the mean length of marriages in California and let x2 denote the mean length
of marriages in Texas. The null and alternative hypotheses are H0: x1=x2 and Ha: x1x2.
D)
Let µ1 denote the mean length of marriages in California and let µ2 denote the mean length of
marriages in Texas. The null and alternative hypotheses are H0: µ1=µ2 and Ha: µ1>µ2.
Solve the problem.
203)
A researcher wants to perform a hypothesis test to determine whether the mean length of
marriages in California differs from the mean length of marriages in Texas. Identify the variable for
the proposed hypothesis test.
203)
A)
Difference between mean length of marriages in California and mean length of marriages in
Texas
B)
State
C)
Length of marriage
D)
Percent of marriages ending in divorce
88
204)
A nutritionist wants to investigate whether her new diet will be effective in helping women aged
30–40 to lose weight. She will use a paired sample to determine whether the mean weight of
women before going on this diet is greater than the mean weight of women after being on this diet
for two months. Identify the variable for the proposed hypothesis test.
204)
A)
Weight
B)
Type of diet
C)
Age
D)
Gender
D)
Provide an appropriate response.
205)
Suppose that x is a variable on each of two populations. Independent samples of sizes 125 and 102,
respectively, are selected from the two populations. True or false? x1–x2 is approximately
normally distributed, regardless of the distributions of the variable on the two populations.
205)
A)
True
B)
False
Explanation:
206)
Suppose that you want to perform a hypothesis test to compare the means of two populations
using independent simple random samples. Suppose that preliminary data analyses of the samples
suggest that the two distributions of the variable under consideration are normal but do not have
the same standard deviation. Should you use the pooled t–test, the nonpooled t–test, the
Mann–Whitney test, or none of these tests?
206)
A)
pooled t–test
B)
Mann–Whitney test
C)
nonpooled t–test
D)
none of these tests
Explanation:
D)
A type of sampling (independent or paired), sample size(s), and a figure showing the results of preliminary data analyses
on the sample(s) are provided. The intent is to employ the sample data to perform a hypothesis test to compare the means
of the two populations from which the data were obtained. Use the information provided to decide which procedure
should be applied.
89
Explanation:
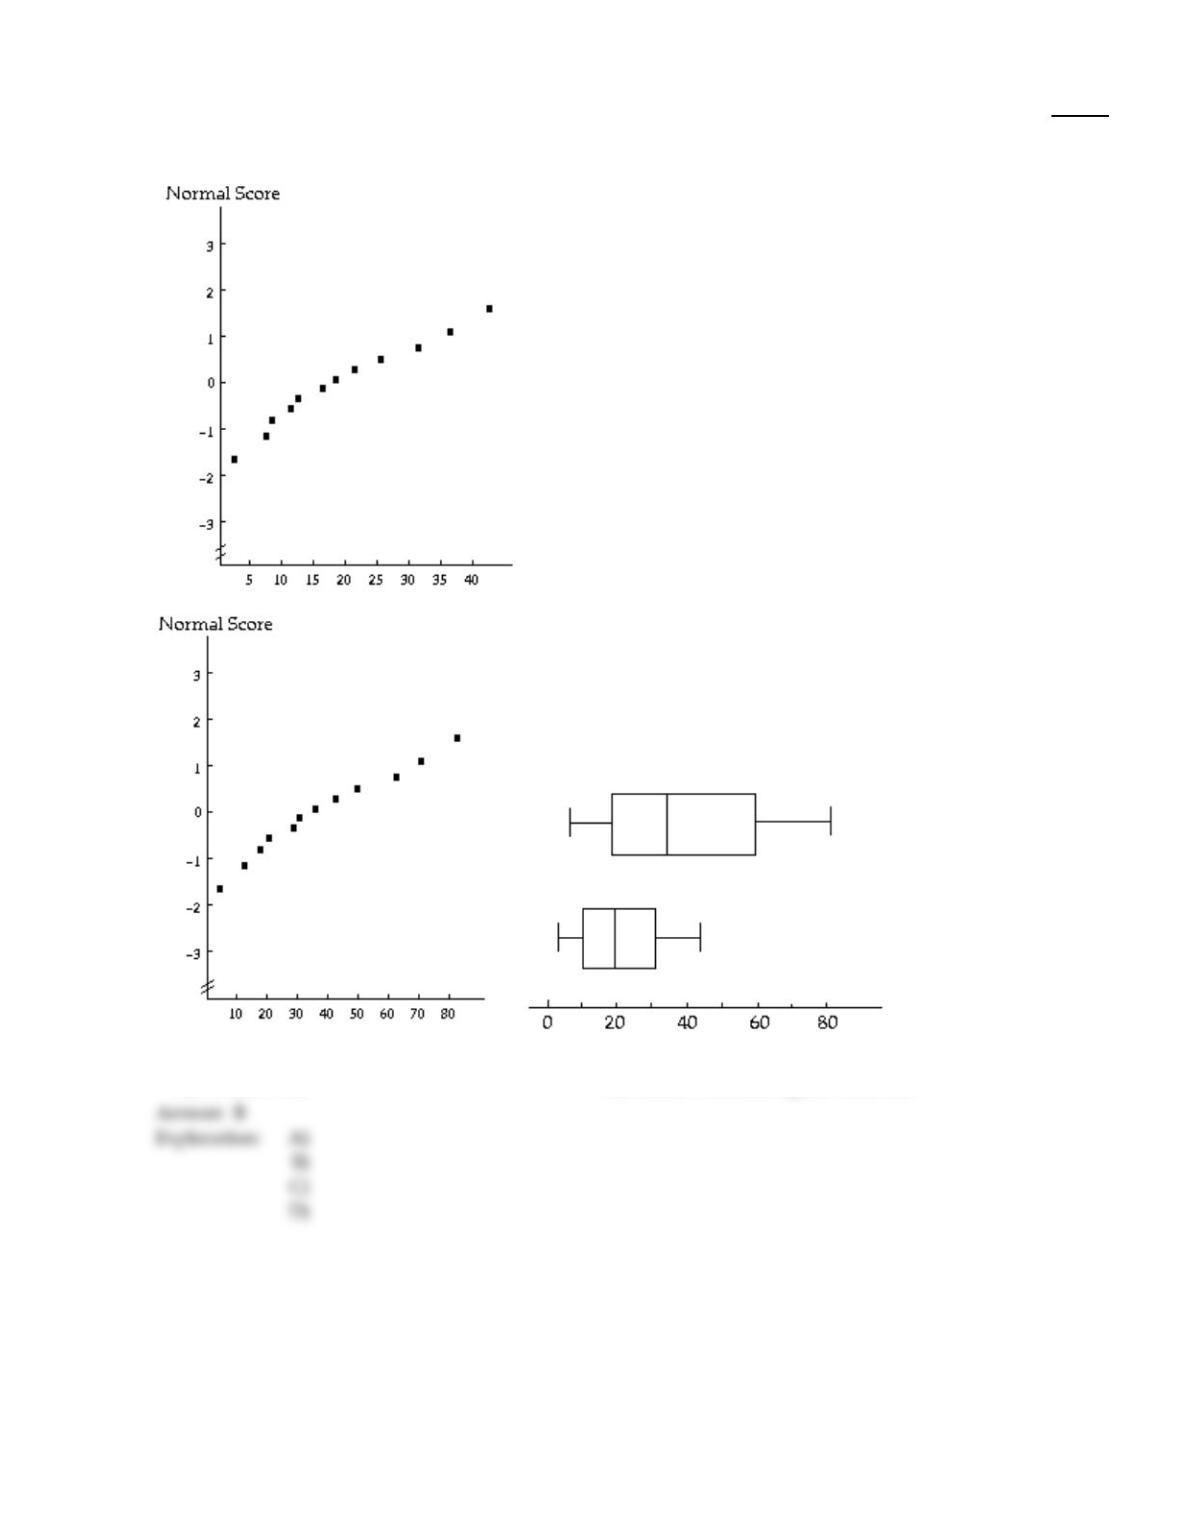
207)
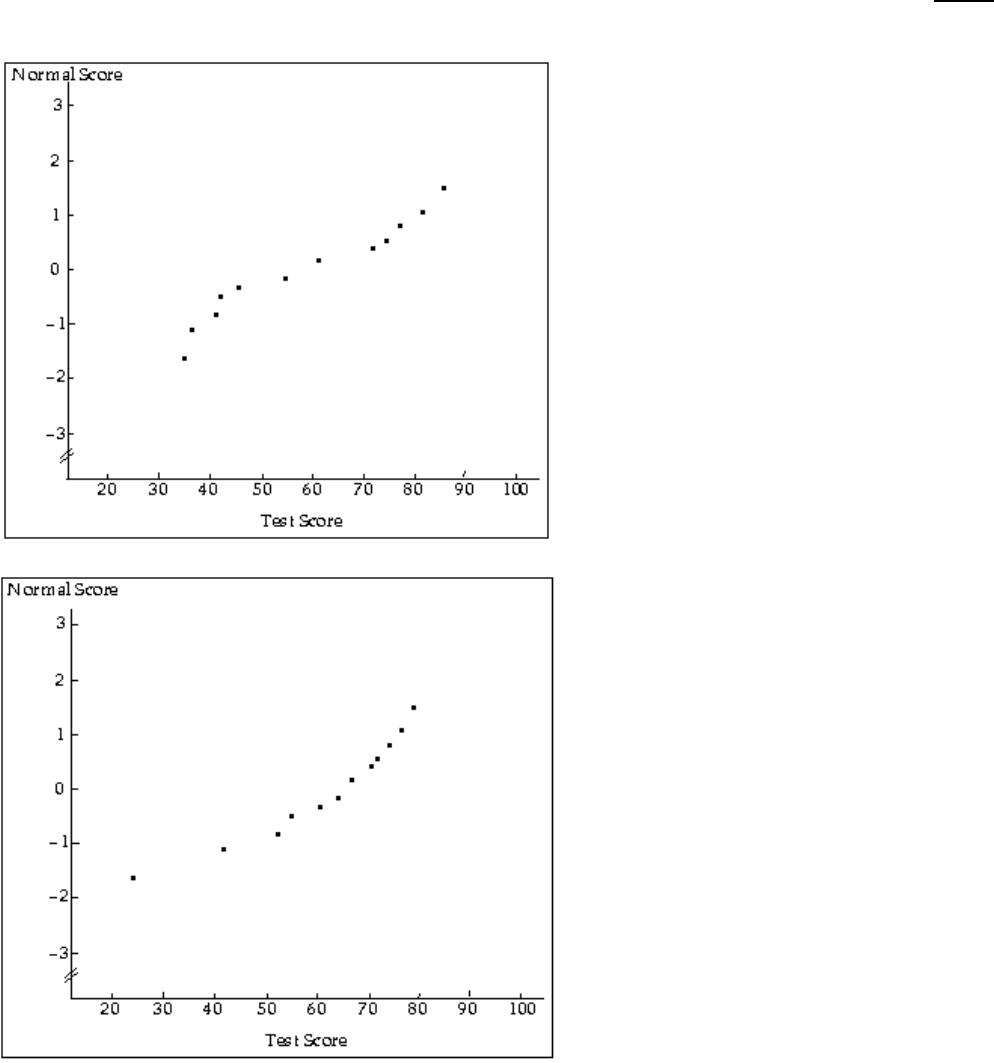
Independent; n1= 12, n2= 12. A normal probability plot and a boxplot for each sample are given
below.
207)
A)
Mann–Whitney test
B)
Nonpooled t–test
C)
Pooled t–test
D)
Paired Wilcoxon signed–rank test
90
Explanation:

Summary statistics are given for independent simple random samples from two populations. Use the nonpooled
t–interval procedure to obtain the specified confidence interval.
208)
x1=12.3, s1= 3.9, n1= 14, x2=13.5, s2= 5.2, n2= 17
99% confidence interval
208)
A)
–5.34 to 2.94
B)
–5.84 to 3.44
C)
–5.24 to 2.84
D)
–5.72 to 3.32
91
Answer Key
Testname: C10
92